Download as PDF, PPTX

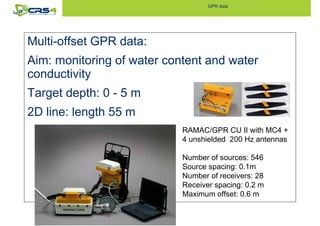
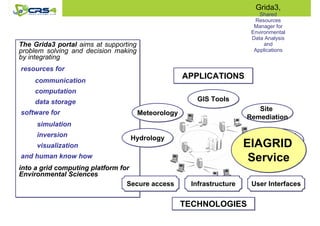
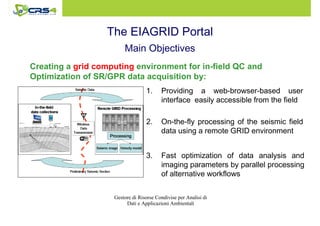
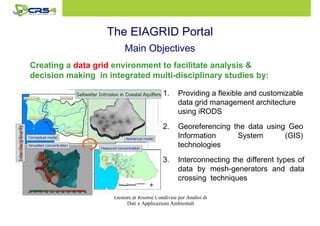
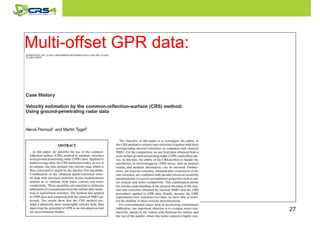
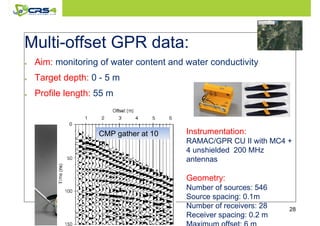
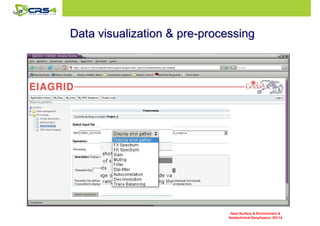
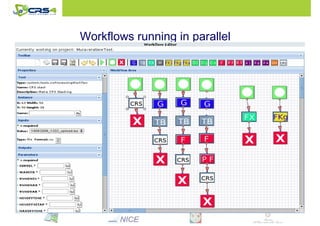
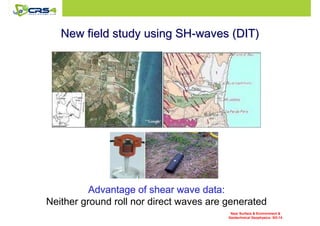
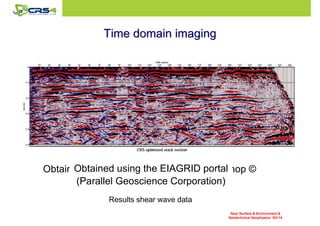
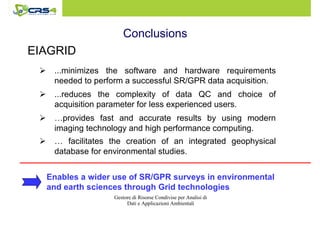

The SmartGeo project aims to enhance the use of geophysical prospecting techniques for characterizing contaminated sites by integrating computational, modeling, and industry expertise. It includes the development of data analysis applications, information dissemination, and practical specifications that align with user requirements, as well as the implementation of multi-offset Ground Penetrating Radar (GPR) surveys. Additionally, the project promotes the use of advanced imaging technology and grid computing to optimize data collection and analysis in environmental studies.