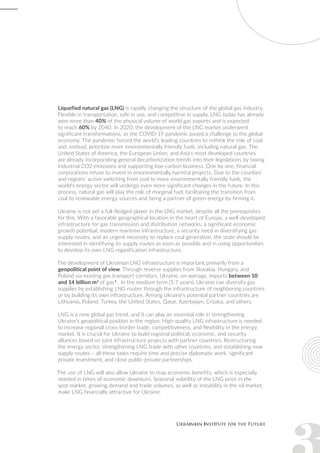
The document discusses the evolving liquefied natural gas (LNG) market and its importance for Ukraine amidst global trends towards decarbonization and environmental sustainability. It highlights Ukraine’s potential to develop its LNG infrastructure, diversify gas supply routes, and enhance its geopolitical position, despite current economic challenges and a reliance on gas imports. The need for significant investment, political alliances, and a focus on environmentally friendly energy sources is emphasized to address Ukraine's energy security and economic viability.


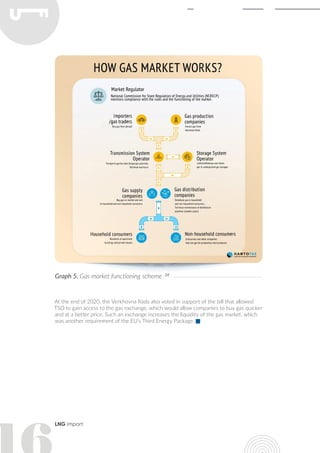


![OVERVIEW OF THE OIL & GAS EXPLORATION AND [Autosaved]](https://cdn.slidesharecdn.com/ss_thumbnails/f980b2ed-b37b-4c91-b049-14cec3820fe3-150826222206-lva1-app6891-thumbnail.jpg?width=640&height=640&fit=bounds)


