
Download to read offline
![20
60
80
100
0
40
120
Chow-fed Fructose-fed
(2 days)
0
20
40
60
80
100
120
Control Fructose
(3mM )
0
200
400
600
800
1000
enterocytes hepatocytes
P < 0.01
LabeledApoB-48(%ofcontrol)
LabeledApoB-48(%ofcontrol)
Labeledcholesterol
0
50
100
150
200
250
300
350
400
450
enterocytes hepatocytes
LabeledTriglyceride
P < 0.0001
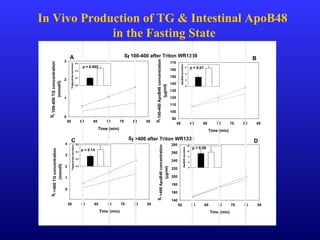
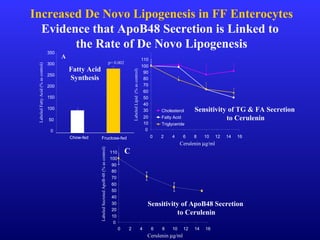
Acute Fructose Feeding or Exposure Does NOT Affect
Intestinal ApoB48 Secretion
[14
C] Fructose
Incorporation
into TG &
Cholesterol
Two-day Fructose
Feeding In Vitro Incubation
of Enterocytes with
Fructose](https://image.slidesharecdn.com/05vrawxgttmypje5ooob-signature-185c9c8f74195a69485b096cbf5bfb73f6b3ed8b7754452e736ee4598185e9e3-poli-160919191613/85/Slides2938-8-320.jpg)
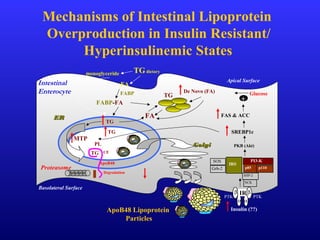

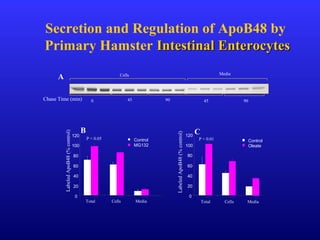
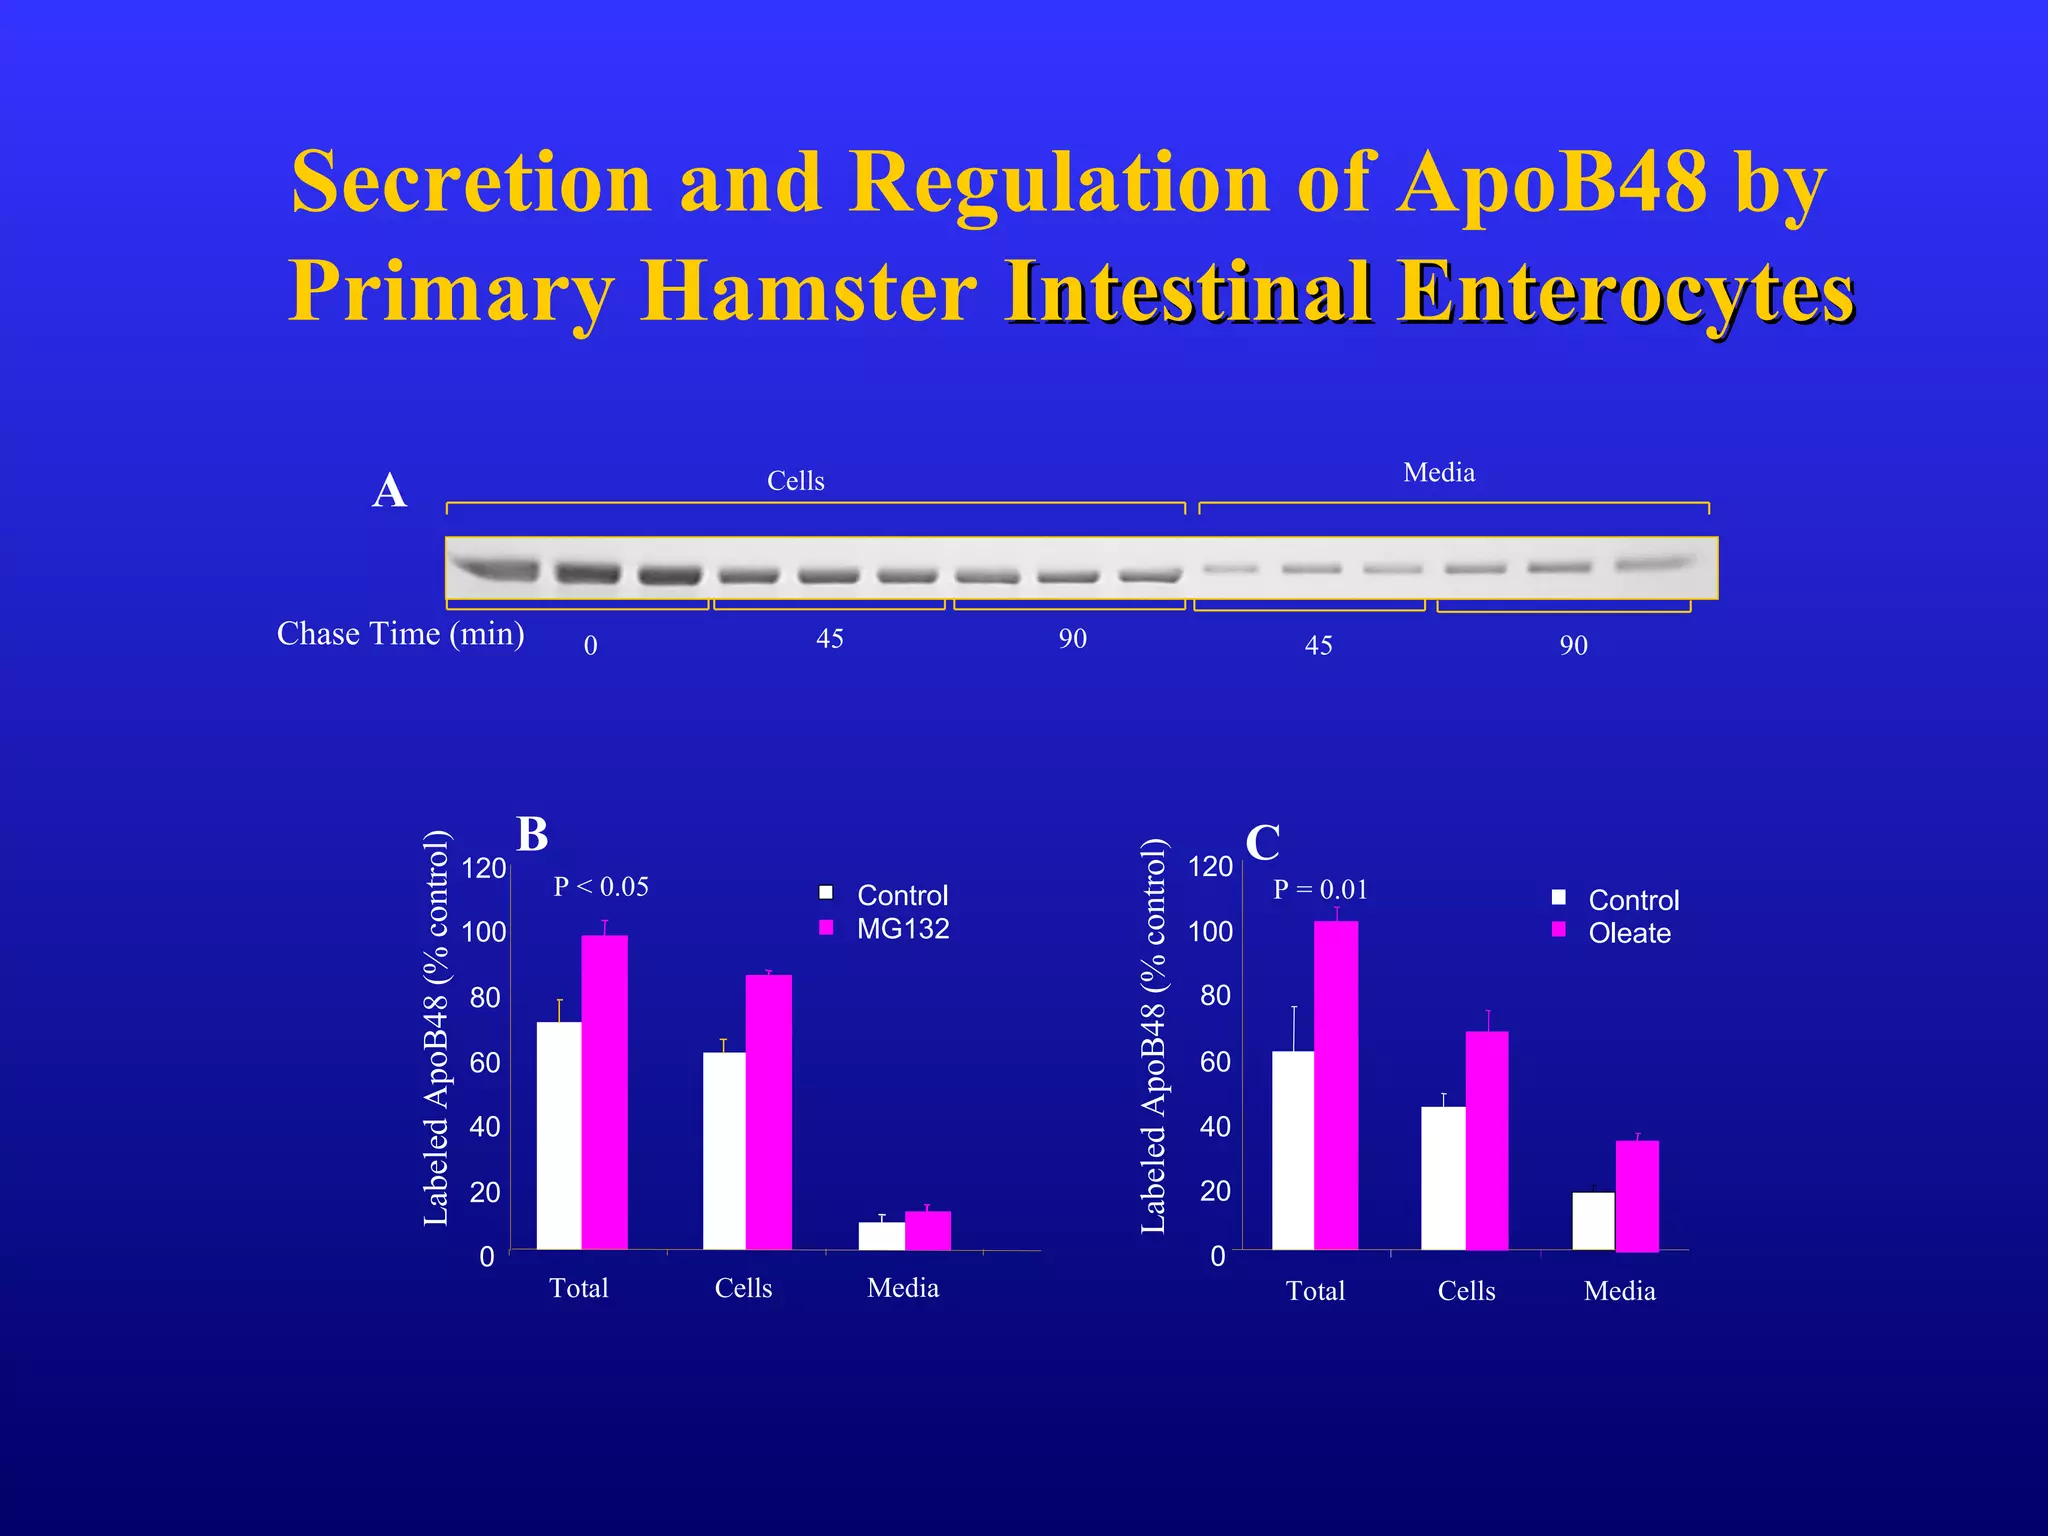
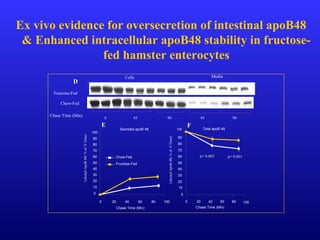
The document presents research on the secretion and regulation of apolipoprotein B48 (ApoB48) by primary hamster intestinal enterocytes. Studies show increased intracellular stability and oversecretion of ApoB48 from fructose-fed hamster enterocytes. The results suggest that hyperinsulinemia and increased de novo lipogenesis in the intestine may enhance ApoB48 secretion and contribute to elevated triglyceride levels.


