170 insulin signaling & vldl overproduction
•Download as PPT, PDF•
0 likes•74 views

SHAPE Society

Recommended
More Related Content
Similar to 170 insulin signaling & vldl overproduction
Similar to 170 insulin signaling & vldl overproduction (16)
More from Society for Heart Attack Prevention and Eradication
More from Society for Heart Attack Prevention and Eradication (20)
Recently uploaded
Recently uploaded (20)
170 insulin signaling & vldl overproduction
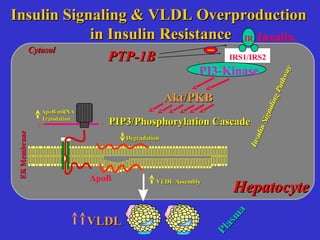
- 1. CytosolCytosol HepatocyteHepatocyte ApoB DegradationDegradation 5' 3' ApoB mRNAApoB mRNA TranslationTranslation ERMembraneERMembrane Insulin IRS1/IRS2 IR InsulinSignalingPathway InsulinSignalingPathway Plasm a Plasm a VLDLVLDL Insulin Signaling & VLDL OverproductionInsulin Signaling & VLDL Overproduction in Insulin Resistancein Insulin Resistance PI3-Kinase VLDL AssemblyVLDL Assembly PIP3/Phosphorylation CascadePIP3/Phosphorylation Cascade Akt/PKBAkt/PKB PTP-1BPTP-1B 3'
- 2. D InsulinReceptorproteinMass (scanningunits/mgproteinx10-3 ) Control Fructose-fed Control Fructose-fed 0 50 100 150 200 250 IRS-1ProteinMass (scanningunits/mgproteinx10-3 ) Control Fructose-fed Control Fructose-fed 0 40 80 120 E F Control Fructose-fed 0 20 40 60 80 100 120 Control Fructose-fed IRS-2Mass(percentofcontrol) C PhosphorylatedIRS-2 (relativetobasallevelofcontrol) 0 20 40 60 80 100 120 140 160 180 _ + _ + Insulin + + + +Insulin _ _ _ _ Control Fructose-fed Control Fructose-fed Impaired Hepatic Tyrosine Phosphorylation of Insulin Receptor, IRS-1, and IRS-2 in Fructose-Fed Hamsters A PhosphorylatedInsulinReceptorMass (scanningunits/mgproteinx10-3 ) Control Fructose-fed 0 100 200 300 400 500 600 _ + _ + Insulin + + + +Insulin _ _ _ _ * B _ + _ + Insulin PhosphorylatedIRS-1 (scanningunits/mgproteinx10-3 ) Control Fructose-fed 0 20 40 60 80 100 120 Control Fructose-fed + + + +Insulin _ _ _ _ P= 0.04 P= 0.009 P= 0.02 P= 0.03 P= 0.029 * *
- 3. B 0 50 100 150 200 PTP-1BMass (percentofcontrol) Control Fructose-fed Control Fructose-fed C 0 100 200 300 PTP-1BActivity (percentofcontrol) Control Fructose-fed A 0 20 40 60 80 100 120 PI3-KinaseActivity (percentofcontrol) Control Fructose-fed * ** *** D + + + +Insulin 0 20 40 60 80 100 120 140 Insulin-InducedAktSerine Phosphorylation(%ofcontrol) Control Fructose-fed Insulin _ + _ + E Insulin Insulin-InducedAktThreonine Phosphorylation(%ofcontrol) Control Fructose-fed 0 20 40 60 80 100 120 _ + _ + + + + + Insulin F Control Fructose-fed 20 40 60 80 100 120 140 160 AktProteinMass (percentofcontrol) 0 Control Fructose-fed **** *** * Evidence for Reduced PI-3 Kinase Activity, Reduced Akt Phosphorylation, & Enhanced PTP-1B Mass & Activity
- 4. 0 20 40 60 80 100 120 0 20 40 60 80 Vanadate (µM) RecoveredCellularApoB (relativetountreated) B 0 20 40 60 80 100 120 0 20 40 60 80 Vanadate (µM) RecoveredLabeledMediaApoB (relativetountreated) C Vanadate (µM) RecoveredTotalApoB (relativetountreated) 0 20 40 60 80 100 120 0 20 40 60 80 D Vanadate (µM) 0 10 40 80 IR-pY 0 100 200 300 400 500 600 0 20 40 60 80 Vanadate (µM) InsulinReceptorPhosphorylation (relativetountreated) A 0 10 20 40 80Vanadate (µM) Cellular ApoB Secreted ApoB E Inhibition of Cellular Phosphatase Activity with Vanadate Enhances Insulin Signaling and Reduces ApoB Secretion IR-IR-ppYY Cellular ApoBCellular ApoB ApoB StabilityApoB Stability ApoB SecretionApoB Secretion