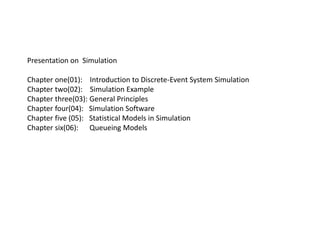
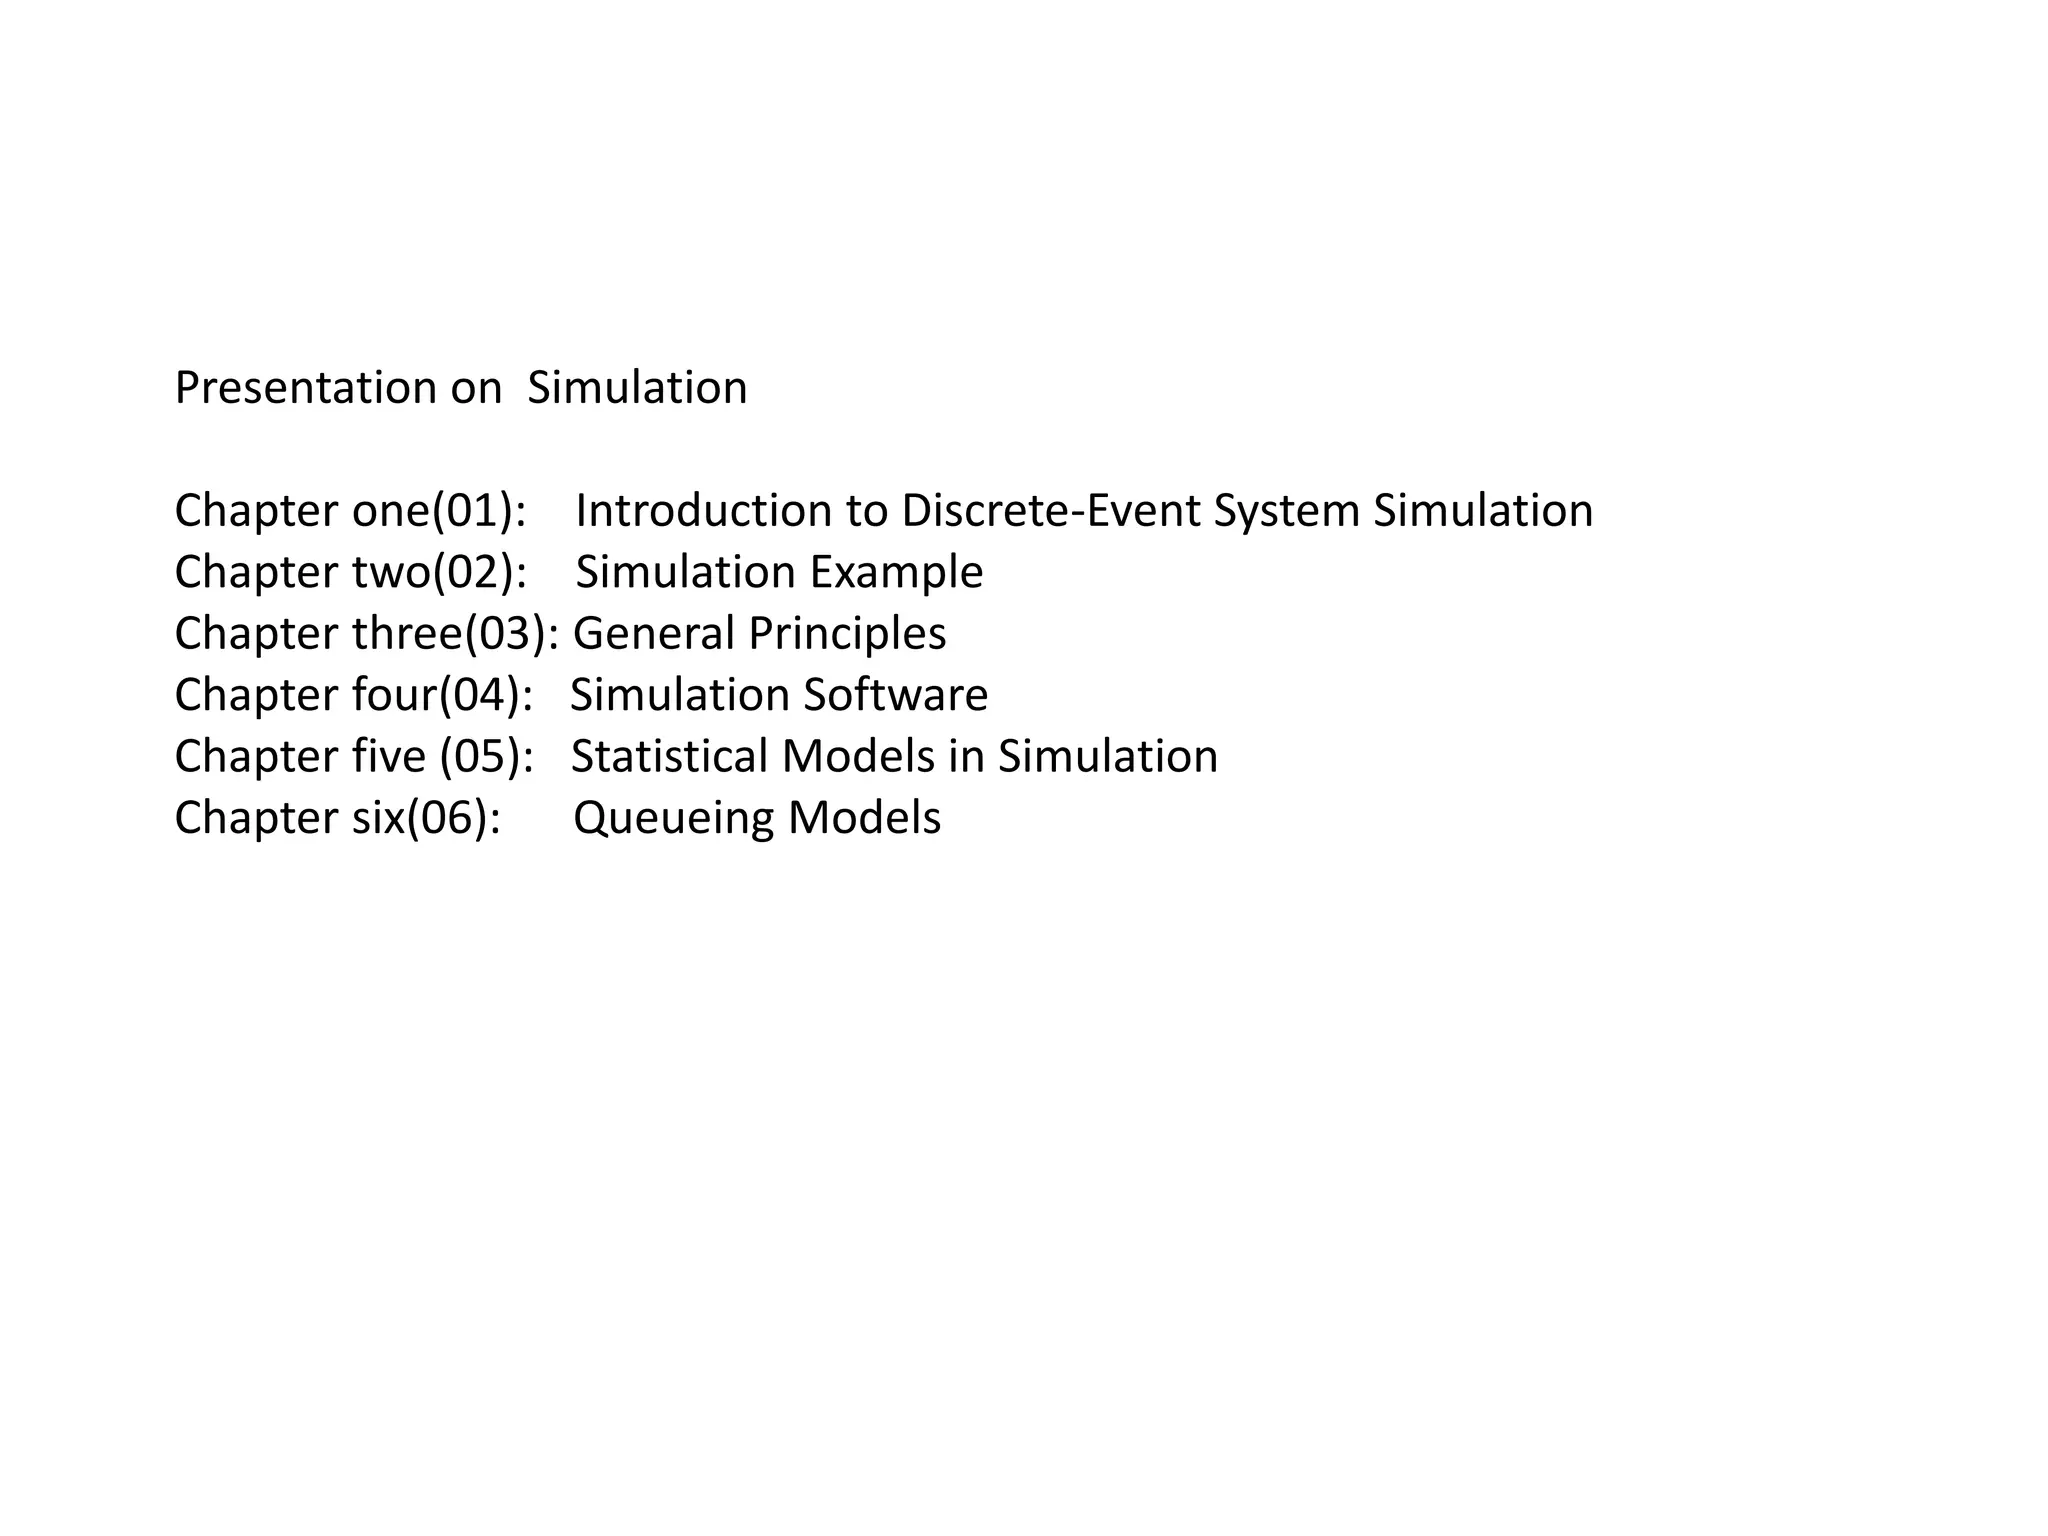
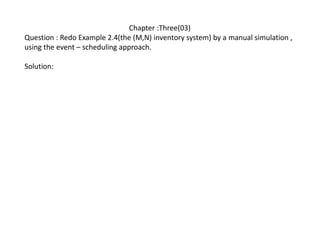
Presentation on Simulation
Chapter one(01): Introduction to Discrete-Event System Simulation
Chapter two(02): Simulation Example
Chapter three(03): General Principles
Chapter four(04): Simulation Software
Chapter five (05): Statistical Models in Simulation
Chapter six(06): Queueing Models
Submitted To:
Muhammad Anwarul Azim
Associate Professor
Dept. of Computer Science & Engineering Department
University of Chittagong
Submitted by:
Aseem Chakrabarthy
Id: 12205078
session: 2011-2012
year: 4th
Dept. of Computer Science & Engineering Department
University of Chittagong
Chapter : One(01)
Question 8: Get a copy of a recent WSC Proceedings and report on the most
unusual application that you can find.
Answer: WSC 2016 is held in Arlington, Virginia, just outside of Washington, D.C.
at the Crystal Gateway Marriott on December 11-14, 2016.
WSC Proceedings :
1. Healthcare Applications
2. PhD Colloquium
3. Big Data Simulation and Decision Making
4. Modeling Methodology
5. Project Management and Construction
6. Social and Behavioral Simulation
7. General & Scientific Applications
8. Environmental and Sustainability Applications.
WSC unusual application :
Most unusual application Simulation optimization.
Chapter: Two(02)
Question 8: An elevator in a manufacturing plant carries exactly 400 kilograms of
material. There are three kinds of material and these are in boxes, that arrive for a
ride on the elevator. These materials and their distributions of time between
arrivals are as follows:
Material weight(Kilograms) Interarrival Time(Minutes)
A 200 5±2 (uniform)
B 100 6 (constant)
C 50 p(2)=0.33
p(2)=0.67
It takes the elevator 1 minute to go up to the second floor, 2 minutes to unload,
and 1 minute to return to the first floor. The elevator does not leave the first floor
unless it has a full load. Simulate 1 hour of operation of the system. What is the
average transit time for a box of material A (time from its arrival until it is
unloaded)? What is the average waiting time for a box of material B? How many
boxes of material C made the trip in 1 hour?
Solution:
Material A (200kg/box)
Interarrival Time Probability Cumulative Probability RD Assignment
3 0.2 0.2 1-2
4 0.2 0.4 3-4
5 0.2 0.6 5-6
6 0.2 0.8 7-8
7 0.2 1.0 9-0
Box RD for Interarrival Time Interarrival Time Clock Time
1 1 3 3
2 4 4 7
3 8 6 13
4 3 4 17
.
.
.
14 4 4 60
Material B (100kg/box)
Box 1 2 3 ………… 10
Clock Time 6 12 18 …………. 60
Material C(50kg/box)
Interarrival Time Probability Cumulative Probability RD Assignment
2 0.33 0.33 01-33
3 0.67 1.00 34-00
Box RD for Interarrival Time Interarrival Time Clock Time
1 58 5 3
2 92 3 6
3 87 3 9
4 31 2 11
. . . .
. . . .
. . . .
22 62 3 60
Clock Time A Arrival B Arrival C Arrival
3 1 1
6 1 2
7 2
9 3
11 4
12 2
.
.
.
Typical results:
Average transit time for box A (£A)
Total waiting time of A +(No. of boxes of A)(1 minutes up to unload)
£A =
No of boxes of A
28+12(1)
=
12
=3.33 minutes
Average waiting time for box B (ѿB)
(Total Time B in Queue)
ѿB =
No. of boxes of B
10
=
10
= 1 minutes / box of B
Total boxes of C shipped = Value of C Counter = 22 boxes
Clock No.of A No. of B No.of C queue Time Time Time A Time B A B C
Time in Queue in Queue in Queue Weight Service Service in Queue in Queue Counter Counter Counter
Begins Ends
3 1 0 1 250
6 0 0 0 0 6 10 3 0 1 1 2
7 1 0 0 200
9 1 0 1 250
11 1 0 2 300
12 0 0 0 350 12 16 5 0 2 2 4
.
.
.
Chapter: Five(05)
Question 8: The number of hurricanes hitting the coast of Florida annually has a
Poisson Distribution with a mean of 0.8
a. What is the probability that more than two hurricanes will hit the Florida
coast in a year?
b. What is the probability that exactly one hurricane will hit the coast of Florida
in a year?
Solution: The number of hurricanes per years, X,is Poisson (α=0.8) with the
probability mass function p(x)=e^-0.8(0.8)^x/x!, Where,x=0,1,……
(a) The probability of more than two hurricanes in one year is
p(X>2) = 1-P(X≤2)
= 1-e^(-0.8)-e^(-0.8)(0.8)-e^(-0.8)(0.8^2/2)
=0.0474
(b) The probability of exactly one hurricane in one year is
p(1)=0.3595
Chapter :Six(06)
Question 8: Arrivals to an airport are all directed to the same runway. At a certain
time of the day , these arrivals form a Poisson with rate 30 per hour . The time to
land an aircraft is a constant 90 seconds . Determine Lq , Wq , L and w for this
airport . If a delayed aircraft burns $5000 worth of fuel per hour on the average ,
determine the average cost per aircraft of delay in waiting to land.
Solution: The airport is modeled as an M/G/1 queue with arrival rate λ = 30/60 =
0.5 per minutes, service rate μ = 60/90 = 2/3 per minutes, and service time
variance σ^2 = 0. the runway utilization is ρ = λ/μ = ¾. Applying the formulas for
the M/G/1 queue we obtain
Lq = ρ^2(1+σ^2μ^2)/(2(1-ρ))=1.125 aircraft
Wq = Lq/λ = 2.25 minutes
w = Wq + 1/μ = 3.75 minutes
L = λ/μ + Lq = 1.875 aircraft
Here , Lq=Average number of
Aircraft in a queue
Wq=Average time spent
Aircraft in a queue
W=Average time spent in a queue per aircraft
L=The number aircraft in a system
Chapter :Three(03)
Question : Redo Example 2.4(the (M,N) inventory system) by a manual simulation ,
using the event – scheduling approach.
Solution:
Chapter :Four(04)
Question 8: A superhighway connects one large metropolitan area to another. A
vehicle leaves the first city every 20 ±15 seconds. Twenty percent of the vehicles
have 1 passengers, 30% of the vehicles have 2 passengers, 10% have 3
passengers , and 10% have 4 passengers. The remaining 30% of the vehicles are
buses , which carry 40 people. It takes 60±10 minutes for a vehicles to travel
between the two metropolitan areas. How long does it take for 5000 people to
arrive in the second city?
Solution:
The end
Thank you

Simulation presentation

  • 1.
    Presentation on Simulation Chapterone(01): Introduction to Discrete-Event System Simulation Chapter two(02): Simulation Example Chapter three(03): General Principles Chapter four(04): Simulation Software Chapter five (05): Statistical Models in Simulation Chapter six(06): Queueing Models
  • 2.
    Submitted To: Muhammad AnwarulAzim Associate Professor Dept. of Computer Science & Engineering Department University of Chittagong Submitted by: Aseem Chakrabarthy Id: 12205078 session: 2011-2012 year: 4th Dept. of Computer Science & Engineering Department University of Chittagong
  • 3.
    Chapter : One(01) Question8: Get a copy of a recent WSC Proceedings and report on the most unusual application that you can find. Answer: WSC 2016 is held in Arlington, Virginia, just outside of Washington, D.C. at the Crystal Gateway Marriott on December 11-14, 2016. WSC Proceedings : 1. Healthcare Applications 2. PhD Colloquium 3. Big Data Simulation and Decision Making 4. Modeling Methodology 5. Project Management and Construction 6. Social and Behavioral Simulation 7. General & Scientific Applications 8. Environmental and Sustainability Applications.
  • 4.
    WSC unusual application: Most unusual application Simulation optimization.
  • 5.
    Chapter: Two(02) Question 8:An elevator in a manufacturing plant carries exactly 400 kilograms of material. There are three kinds of material and these are in boxes, that arrive for a ride on the elevator. These materials and their distributions of time between arrivals are as follows: Material weight(Kilograms) Interarrival Time(Minutes) A 200 5±2 (uniform) B 100 6 (constant) C 50 p(2)=0.33 p(2)=0.67 It takes the elevator 1 minute to go up to the second floor, 2 minutes to unload, and 1 minute to return to the first floor. The elevator does not leave the first floor unless it has a full load. Simulate 1 hour of operation of the system. What is the average transit time for a box of material A (time from its arrival until it is unloaded)? What is the average waiting time for a box of material B? How many boxes of material C made the trip in 1 hour?
  • 6.
    Solution: Material A (200kg/box) InterarrivalTime Probability Cumulative Probability RD Assignment 3 0.2 0.2 1-2 4 0.2 0.4 3-4 5 0.2 0.6 5-6 6 0.2 0.8 7-8 7 0.2 1.0 9-0 Box RD for Interarrival Time Interarrival Time Clock Time 1 1 3 3 2 4 4 7 3 8 6 13 4 3 4 17 . . . 14 4 4 60
  • 7.
    Material B (100kg/box) Box1 2 3 ………… 10 Clock Time 6 12 18 …………. 60 Material C(50kg/box) Interarrival Time Probability Cumulative Probability RD Assignment 2 0.33 0.33 01-33 3 0.67 1.00 34-00 Box RD for Interarrival Time Interarrival Time Clock Time 1 58 5 3 2 92 3 6 3 87 3 9 4 31 2 11 . . . . . . . . . . . . 22 62 3 60
  • 8.
    Clock Time AArrival B Arrival C Arrival 3 1 1 6 1 2 7 2 9 3 11 4 12 2 . . . Typical results: Average transit time for box A (£A) Total waiting time of A +(No. of boxes of A)(1 minutes up to unload) £A = No of boxes of A 28+12(1) = 12 =3.33 minutes
  • 9.
    Average waiting timefor box B (ѿB) (Total Time B in Queue) ѿB = No. of boxes of B 10 = 10 = 1 minutes / box of B Total boxes of C shipped = Value of C Counter = 22 boxes Clock No.of A No. of B No.of C queue Time Time Time A Time B A B C Time in Queue in Queue in Queue Weight Service Service in Queue in Queue Counter Counter Counter Begins Ends 3 1 0 1 250 6 0 0 0 0 6 10 3 0 1 1 2 7 1 0 0 200 9 1 0 1 250 11 1 0 2 300 12 0 0 0 350 12 16 5 0 2 2 4 . . .
  • 10.
    Chapter: Five(05) Question 8:The number of hurricanes hitting the coast of Florida annually has a Poisson Distribution with a mean of 0.8 a. What is the probability that more than two hurricanes will hit the Florida coast in a year? b. What is the probability that exactly one hurricane will hit the coast of Florida in a year? Solution: The number of hurricanes per years, X,is Poisson (α=0.8) with the probability mass function p(x)=e^-0.8(0.8)^x/x!, Where,x=0,1,…… (a) The probability of more than two hurricanes in one year is p(X>2) = 1-P(X≤2) = 1-e^(-0.8)-e^(-0.8)(0.8)-e^(-0.8)(0.8^2/2) =0.0474 (b) The probability of exactly one hurricane in one year is p(1)=0.3595
  • 11.
    Chapter :Six(06) Question 8:Arrivals to an airport are all directed to the same runway. At a certain time of the day , these arrivals form a Poisson with rate 30 per hour . The time to land an aircraft is a constant 90 seconds . Determine Lq , Wq , L and w for this airport . If a delayed aircraft burns $5000 worth of fuel per hour on the average , determine the average cost per aircraft of delay in waiting to land. Solution: The airport is modeled as an M/G/1 queue with arrival rate λ = 30/60 = 0.5 per minutes, service rate μ = 60/90 = 2/3 per minutes, and service time variance σ^2 = 0. the runway utilization is ρ = λ/μ = ¾. Applying the formulas for the M/G/1 queue we obtain Lq = ρ^2(1+σ^2μ^2)/(2(1-ρ))=1.125 aircraft Wq = Lq/λ = 2.25 minutes w = Wq + 1/μ = 3.75 minutes L = λ/μ + Lq = 1.875 aircraft Here , Lq=Average number of Aircraft in a queue Wq=Average time spent Aircraft in a queue W=Average time spent in a queue per aircraft L=The number aircraft in a system
  • 12.
    Chapter :Three(03) Question :Redo Example 2.4(the (M,N) inventory system) by a manual simulation , using the event – scheduling approach. Solution:
  • 13.
    Chapter :Four(04) Question 8:A superhighway connects one large metropolitan area to another. A vehicle leaves the first city every 20 ±15 seconds. Twenty percent of the vehicles have 1 passengers, 30% of the vehicles have 2 passengers, 10% have 3 passengers , and 10% have 4 passengers. The remaining 30% of the vehicles are buses , which carry 40 people. It takes 60±10 minutes for a vehicles to travel between the two metropolitan areas. How long does it take for 5000 people to arrive in the second city? Solution:
  • 14.