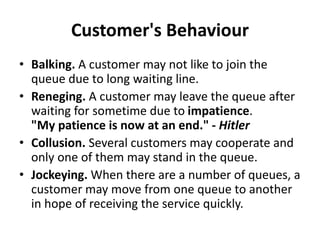
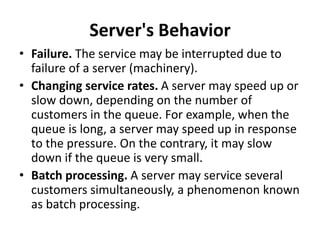
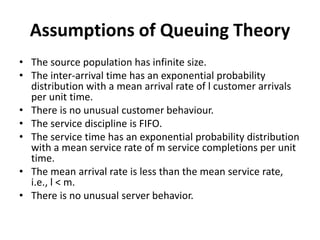
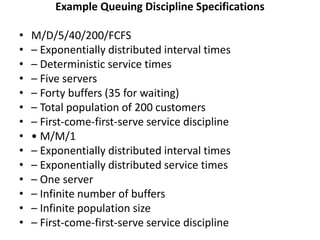
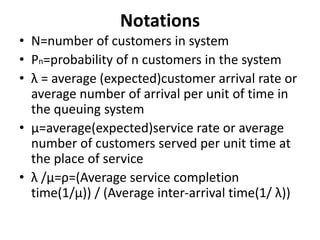
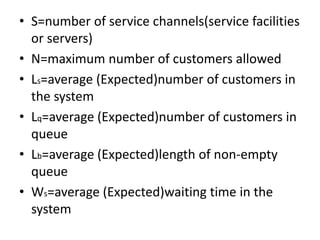
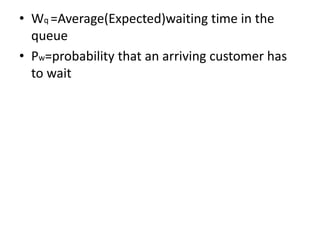
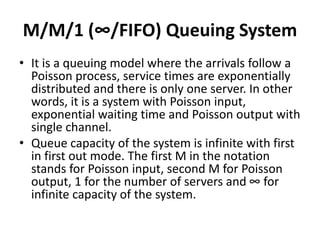
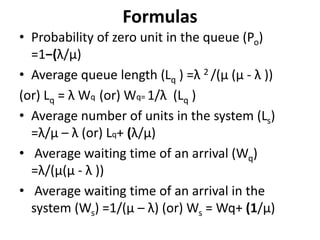
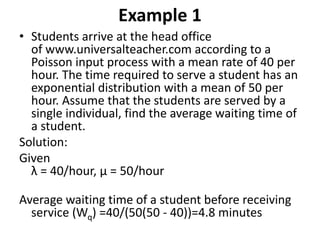
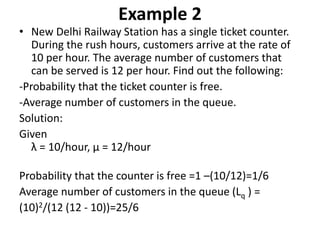
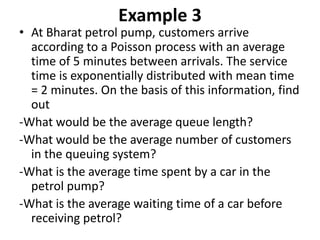
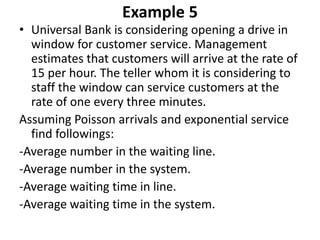
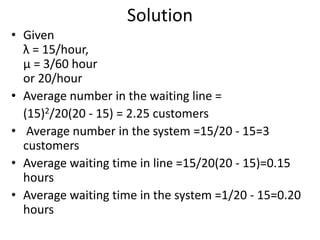
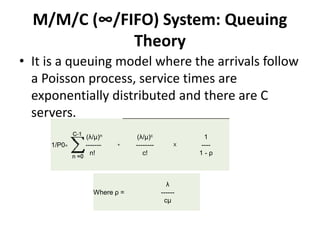
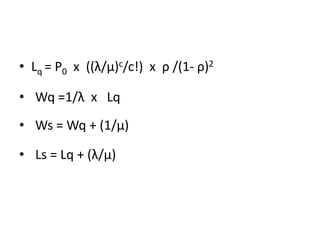
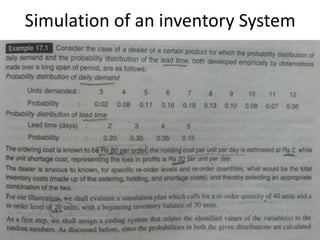
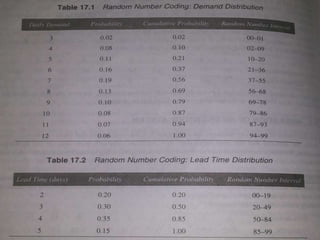
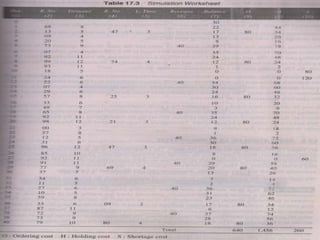
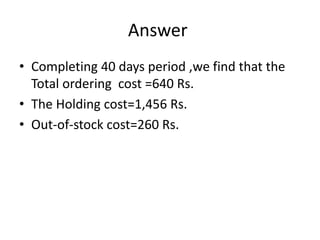
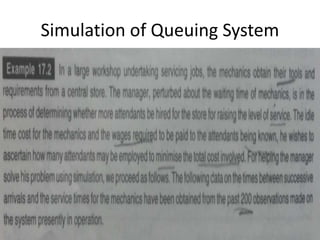
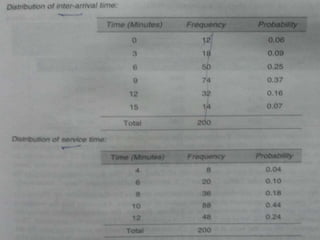
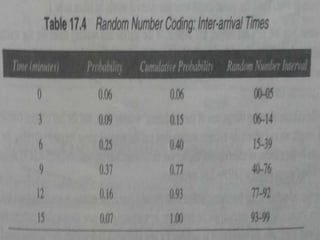
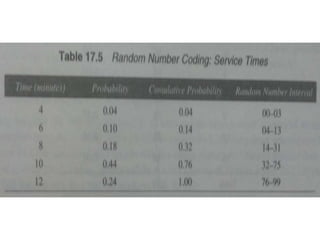
Queuing theory is the mathematical study of waiting lines in service systems where customers arrive for service. Some key concepts include arrival and service rates, queues, queue lengths, waiting times, and models like the M/M/1 model. The M/M/1 model describes a system with Poisson arrivals, exponential service times, and a single server. Formulas are provided to calculate values like the probability of no customers, average queue length, and average waiting times in both the queue and system for the M/M/1 model. Several examples demonstrate how to apply the M/M/1 model and formulas to calculate performance measures for queuing systems.
Queueing theory is the mathematical study of waiting lines, or queues. A queueing model is constructed so that queue lengths and waiting time can be predicted
This a project on generation of a FCFS , single server queuing theory model followed by stats to analyze the queue length, customer distribution etc. & various possible cases to improve
Talks about what is Queuing and its application, practical life usage, with a complex problem statement with its solution. Pre-emptive and non-preemptive queue models and its algorithm.
Developed to provide models for forecasting behaviors of systems subject to random demand
The first problems addressed concerned congestion of telephone traffic
Erlang observed that a telephone system can be modeled by Poisson customer arrivals and exponentially distributed service times
Molina, Pollaczek, Kolmogorov, Khintchine, Palm, Crommelin followed the track
Common phenomenon of everyday life
Line maybe People / Items
Examples
– Grocery shop, Bank, Petrol refilling units, Automobile Service station, Airplane, Train etc.
This is a presentation created to facilitate a research paper discussion on 'Feedback queuing models for time shared systems' for a final year undergraduate course. This includes a summary of the concepts presented with the paper, excluding their statistical proofs.
Data Queues provide a speedy, versatile, and functional program-to program communication method and also provide a perfect coupling and transaction layer in modern application design models, aiming at separating the data processing and business logic from the presentation layer, and thus achieving independence between the back-end and the front-end of the application.
Uncertainty Problem in Control & Decision TheorySSA KPI
AACIMP 2010 Summer School lecture by Viktor Ivanenko. "Applied Mathematics" stream. "On the Models of Uncertainty in Decision and Control Problems" course. Part 1.
More info at http://summerschool.ssa.org.ua
Watershed Conference - "The value nature vs the nature of value" - 2006Steve McKinney
The historical perspective of what today is considered the modern study of environmental economics begins with problems proposed by Garret Hardin in his famous essay "The Tragedy of the Commons" in 1968. Many scientists, engineers, and economists have proposed methods of assessing the value of the natural environment since this time. This presentation will discuss many of these methods with specific focus on application of substitute cost method and its potential for application in stormwater management and mitigation.
Traditional M/M/1 queuing systems use single class first come first serve scheduling discipline, Under FCFS scheduling, customers are served in the order in which they arrive, regardless of the priority of these customers. In order to offer different quality of service for different types of customers, we often control a queuing system by providing multiple classes with different priorities. Familiar priority control mechanisms are preemptive priority and non-preemptive priority. This presentation reviews the differences between normal M/M/1 and priority M/M/1 queues.
This is the presentation I gave at the Grace Hopper Celebration for Women in Computing October 2015. It covers three main ethical market models that could support the emergence of a Personal Data Ecosystem centered on individuals and their personal clouds. The three models are Vendor Relationship Management, Infomediaries, and Data Aggregators. It highlights the need for Accountability Frameworks (also called Trust Frameworks) combinations of code and law/policy. This is contextualized in an overall Landscape picture where two other modes of governance also co-exist - Peer Governance and Identifier Governance.
Logic Models, Program Evaluation, and other Frightening Topicsmlcvista
Presentation given at Minnesota Literacy Council AmeriCorps VISTA Early Service Training, August 24, 2012, by John Hamerlinck (Minnesota Campus Compact)
APPLICATION OF QUEUE MODEL TO ENHANCE BANK SERVICE IN WAITING LINESPavel Islam
. In this slide, queue theory is applied to enhance the service of a bank in lines. For this, firstly a queue model (M/M/C): (GD/∞/∞) is selected to find out efficiency of the servers, number of service facilities, when (days of the week) customers can typically be expected to arrive,amount of time customers has to spend to get the desired service, length of the queue, how much time the customers have to wait before the service starts, how much time the customers have to wait in the bank, human psychology (frustration). After that, the optimal number of counter is calculated to improve the operational efficiency. At last, we calculate the optimal service rate and service efficiency.
MCM,MCA,MSc, MMM, MPhil, PhD (Computer Applications)
Working as Associate Professor at Zeal Education Society, Pune for MCA Progrmme.
Having 18 Years teaching experience
Hierarchical Digital Twin of a Naval Power SystemKerry Sado
A hierarchical digital twin of a Naval DC power system has been developed and experimentally verified. Similar to other state-of-the-art digital twins, this technology creates a digital replica of the physical system executed in real-time or faster, which can modify hardware controls. However, its advantage stems from distributing computational efforts by utilizing a hierarchical structure composed of lower-level digital twin blocks and a higher-level system digital twin. Each digital twin block is associated with a physical subsystem of the hardware and communicates with a singular system digital twin, which creates a system-level response. By extracting information from each level of the hierarchy, power system controls of the hardware were reconfigured autonomously. This hierarchical digital twin development offers several advantages over other digital twins, particularly in the field of naval power systems. The hierarchical structure allows for greater computational efficiency and scalability while the ability to autonomously reconfigure hardware controls offers increased flexibility and responsiveness. The hierarchical decomposition and models utilized were well aligned with the physical twin, as indicated by the maximum deviations between the developed digital twin hierarchy and the hardware.
Overview of the fundamental roles in Hydropower generation and the components involved in wider Electrical Engineering.
This paper presents the design and construction of hydroelectric dams from the hydrologist’s survey of the valley before construction, all aspects and involved disciplines, fluid dynamics, structural engineering, generation and mains frequency regulation to the very transmission of power through the network in the United Kingdom.
Author: Robbie Edward Sayers
Collaborators and co editors: Charlie Sims and Connor Healey.
(C) 2024 Robbie E. Sayers
Sachpazis:Terzaghi Bearing Capacity Estimation in simple terms with Calculati...Dr.Costas Sachpazis
Terzaghi's soil bearing capacity theory, developed by Karl Terzaghi, is a fundamental principle in geotechnical engineering used to determine the bearing capacity of shallow foundations. This theory provides a method to calculate the ultimate bearing capacity of soil, which is the maximum load per unit area that the soil can support without undergoing shear failure. The Calculation HTML Code included.
CFD Simulation of By-pass Flow in a HRSG module by R&R Consult.pptxR&R Consult
CFD analysis is incredibly effective at solving mysteries and improving the performance of complex systems!
Here's a great example: At a large natural gas-fired power plant, where they use waste heat to generate steam and energy, they were puzzled that their boiler wasn't producing as much steam as expected.
R&R and Tetra Engineering Group Inc. were asked to solve the issue with reduced steam production.
An inspection had shown that a significant amount of hot flue gas was bypassing the boiler tubes, where the heat was supposed to be transferred.
R&R Consult conducted a CFD analysis, which revealed that 6.3% of the flue gas was bypassing the boiler tubes without transferring heat. The analysis also showed that the flue gas was instead being directed along the sides of the boiler and between the modules that were supposed to capture the heat. This was the cause of the reduced performance.
Based on our results, Tetra Engineering installed covering plates to reduce the bypass flow. This improved the boiler's performance and increased electricity production.
It is always satisfying when we can help solve complex challenges like this. Do your systems also need a check-up or optimization? Give us a call!
Work done in cooperation with James Malloy and David Moelling from Tetra Engineering.
More examples of our work https://www.r-r-consult.dk/en/cases-en/
Welcome to WIPAC Monthly the magazine brought to you by the LinkedIn Group Water Industry Process Automation & Control.
In this month's edition, along with this month's industry news to celebrate the 13 years since the group was created we have articles including
A case study of the used of Advanced Process Control at the Wastewater Treatment works at Lleida in Spain
A look back on an article on smart wastewater networks in order to see how the industry has measured up in the interim around the adoption of Digital Transformation in the Water Industry.
2. • Queuing theory is the mathematical study of waiting
lines which are the most frequently encountered
problems in everyday life.
• For example, queue at a cafeteria, library, bank, etc.
• Common to all of these cases are the arrivals of objects
requiring service and the attendant delays when the
service mechanism is busy.
• Waiting lines cannot be eliminated completely, but
suitable techniques can be used to reduce the waiting
time of an object in the system.
• A long waiting line may result in loss of customers to
an organization. Waiting time can be reduced by
providing additional service facilities, but it may result
in an increase in the idle time of the service
mechanism.
3. Basic Terminology: Queuing theory (Waiting Line
Models)
• The present section focuses on the standard
vocabulary of Waiting Line Models (Queuing
Theory).
4. Queuing Model
• It is a suitable model used to represent a
service oriented problem, where customers
arrive randomly to receive some service, the
service time being also a random variable.
Arrival
• The statistical pattern of the arrival can be
indicated through the probability distribution
of the number of the arrivals in an interval.
5. Service Time
- The time taken by a server to complete
service is known as service time.
Server
• It is a mechanism through which service is
offered.
Queue Discipline
• It is the order in which the members of the
queue are offered service.
6. Poisson Process
• It is a probabilistic phenomenon where the
number of arrivals in an interval of length t
follows a Poisson distribution with parameter λt,
where λ is the rate of arrival.
Queue
• A group of items waiting to receive service,
including those receiving the service, is known as
queue.
Waiting time in queue
• Time spent by a customer in the queue before
being served.
7. Waiting time in the system
• It is the total time spent by a customer in the
system. It can be calculated as follows:
Waiting time in the system = Waiting time in
queue + Service time
• Queue length
• Number of persons in the system at any time.
• Average length of line
• The number of customers in the queue per
unit of time.
8. • Average idle time
• The average time for which the system
remains idle.
• FIFO
• It is the first in first out queue discipline.
• Bulk Arrivals
• If more than one customer enter the system at
an arrival event, it is known as bulk arrivals.
Please note that bulk arrivals are not
embodied in the models of the subsequent
sections.
9. Queuing System Components
• Input Source: The input source generates
customers for the service mechanism.
• The most important characteristic of the input
source is its size. It may be either finite or infinite.
(Please note that the calculations are far easier
for the infinite case, therefore, this assumption is
often made even when the actual size is relatively
large. If the population size is finite, then the
analysis of queuing model becomes more
involved.)
• The statistical pattern by which calling units are
generated over time must also be specified. It
may be Poisson or Exponential probability
distribution.
10. • Queue: It is characterized by the maximum
permissible number of units that it can
contain. Queues may be infinite or finite.
• Service Discipline: It refers to the order in
which members of the queue are selected for
service. Frequently, the discipline is first come,
first served.
Following are some other disciplines:
• LIFO (Last In First Out)
• SIRO (Service In Random Order)
• Priority System
11. Service Mechanism
• A specification of the service mechanism
includes a description of time to complete a
service and the number of customers who are
satisfied at each service event.
12.
13. Customer's Behaviour
• Balking. A customer may not like to join the
queue due to long waiting line.
• Reneging. A customer may leave the queue after
waiting for sometime due to impatience.
"My patience is now at an end." - Hitler
• Collusion. Several customers may cooperate and
only one of them may stand in the queue.
• Jockeying. When there are a number of queues, a
customer may move from one queue to another
in hope of receiving the service quickly.
14. Server's Behavior
• Failure. The service may be interrupted due to
failure of a server (machinery).
• Changing service rates. A server may speed up or
slow down, depending on the number of
customers in the queue. For example, when the
queue is long, a server may speed up in response
to the pressure. On the contrary, it may slow
down if the queue is very small.
• Batch processing. A server may service several
customers simultaneously, a phenomenon known
as batch processing.
15. Assumptions of Queuing Theory
• The source population has infinite size.
• The inter-arrival time has an exponential probability
distribution with a mean arrival rate of l customer arrivals
per unit time.
• There is no unusual customer behaviour.
• The service discipline is FIFO.
• The service time has an exponential probability distribution
with a mean service rate of m service completions per unit
time.
• The mean arrival rate is less than the mean service rate,
i.e., l < m.
• There is no unusual server behavior.
16. Example Queuing Discipline Specifications
• M/D/5/40/200/FCFS
• – Exponentially distributed interval times
• – Deterministic service times
• – Five servers
• – Forty buffers (35 for waiting)
• – Total population of 200 customers
• – First-come-first-serve service discipline
• • M/M/1
• – Exponentially distributed interval times
• – Exponentially distributed service times
• – One server
• – Infinite number of buffers
• – Infinite population size
• – First-come-first-serve service discipline
17. Notations
• N=number of customers in system
• Pn=probability of n customers in the system
• λ = average (expected)customer arrival rate or
average number of arrival per unit of time in
the queuing system
• µ=average(expected)service rate or average
number of customers served per unit time at
the place of service
• λ /µ=ρ=(Average service completion
time(1/µ)) / (Average inter-arrival time(1/ λ))
18. • S=number of service channels(service facilities
or servers)
• N=maximum number of customers allowed
• Ls=average (Expected)number of customers in
the system
• Lq=average (Expected)number of customers in
queue
• Lb=average (Expected)length of non-empty
queue
• Ws=average (Expected)waiting time in the
system
20. M/M/1 (∞/FIFO) Queuing System
• It is a queuing model where the arrivals follow a
Poisson process, service times are exponentially
distributed and there is only one server. In other
words, it is a system with Poisson input,
exponential waiting time and Poisson output with
single channel.
• Queue capacity of the system is infinite with first
in first out mode. The first M in the notation
stands for Poisson input, second M for Poisson
output, 1 for the number of servers and ∞ for
infinite capacity of the system.
21. Formulas
• Probability of zero unit in the queue (Po)
=1−(λ/μ)
• Average queue length (Lq ) =λ 2 /(μ (μ - λ ))
(or) Lq = λ Wq (or) Wq= 1/λ (Lq )
• Average number of units in the system (Ls)
=λ/μ – λ (or) Lq+ (λ/μ)
• Average waiting time of an arrival (Wq)
=λ/(μ(μ - λ ))
• Average waiting time of an arrival in the
system (Ws) =1/(μ – λ) (or) Ws = Wq+ (1/μ)
22. Example 1
• Students arrive at the head office
of www.universalteacher.com according to a
Poisson input process with a mean rate of 40 per
hour. The time required to serve a student has an
exponential distribution with a mean of 50 per
hour. Assume that the students are served by a
single individual, find the average waiting time of
a student.
Solution:
Given
λ = 40/hour, μ = 50/hour
Average waiting time of a student before receiving
service (Wq) =40/(50(50 - 40))=4.8 minutes
23. Example 2
• New Delhi Railway Station has a single ticket counter.
During the rush hours, customers arrive at the rate of
10 per hour. The average number of customers that
can be served is 12 per hour. Find out the following:
-Probability that the ticket counter is free.
-Average number of customers in the queue.
Solution:
Given
λ = 10/hour, μ = 12/hour
Probability that the counter is free =1 –(10/12)=1/6
Average number of customers in the queue (Lq ) =
(10)2/(12 (12 - 10))=25/6
24. Example 3
• At Bharat petrol pump, customers arrive
according to a Poisson process with an average
time of 5 minutes between arrivals. The service
time is exponentially distributed with mean time
= 2 minutes. On the basis of this information, find
out
-What would be the average queue length?
-What would be the average number of customers
in the queuing system?
-What is the average time spent by a car in the
petrol pump?
-What is the average waiting time of a car before
receiving petrol?
25. Solution
• Average inter arrival time =1/λ= 5minutes
=1/12hour
So λ = 12/hour
• Average service time =1/μ= 2 minutes =1/
30hour
So μ = 30/hour
• Average queue length, Lq =(12)2/30(30 - 12)=4/15
• Average number of customers, Ls =12/(30 – 12)
=2/3
26. • Average time spent at the petrol pump =1/
(30 – 12)=3.33 minutes
• Average waiting time of a car before
receiving petrol =12/30(30 - 12)=1.33 minutes
27. Example 4
• Chhabra Saree Emporium has a single cashier.
During the rush hours, customers arrive at the rate
of 10 per hour. The average number of customers
that can be processed by the cashier is 12 per hour.
On the basis of this information, find the following:
-Probability that the cashier is idle
-Average number of customers in the queuing system
-Average time a customer spends in the system
-Average number of customers in the queue
-Average time a customer spends in the queue
29. Example 5
• Universal Bank is considering opening a drive in
window for customer service. Management
estimates that customers will arrive at the rate of
15 per hour. The teller whom it is considering to
staff the window can service customers at the
rate of one every three minutes.
Assuming Poisson arrivals and exponential service
find followings:
-Average number in the waiting line.
-Average number in the system.
-Average waiting time in line.
-Average waiting time in the system.
30. Solution
• Given
λ = 15/hour,
μ = 3/60 hour
or 20/hour
• Average number in the waiting line =
(15)2/20(20 - 15) = 2.25 customers
• Average number in the system =15/20 - 15=3
customers
• Average waiting time in line =15/20(20 - 15)=0.15
hours
• Average waiting time in the system =1/20 - 15=0.20
hours
31. M/M/C (∞/FIFO) System: Queuing
Theory
• It is a queuing model where the arrivals follow
a Poisson process, service times are
exponentially distributed and there are C
servers.
1/P0=
(λ/μ)n
- -------
n!
+
(λ/μ)c
--------
c!
X
1
----
1 - ρ
Where ρ =
λ
------
cμ
32. • Lq = P0 x ((λ/μ)c/c!) x ρ /(1- ρ)2
• Wq =1/λ x Lq
• Ws = Wq + (1/μ)
• Ls = Lq + (λ/μ)
33. Example 1
• The Silver Spoon Restaurant has only two
waiters. Customers arrive according to a
Poisson process with a mean rate of 10 per
hour. The service for each customer is
exponential with mean of 4 minutes. On the
basis of this information, find the following:
-The probability of having to wait for
service.
-The expected percentage of idle time for
each waiter.
34.
35. Example 2
• Universal Bank has two tellers working on savings
accounts. The first teller handles withdrawals
only. The second teller handles deposits only. It
has been found that the service times
distributions for both deposits and withdrawals
are exponential with mean service time 2
minutes per customer. Deposits & withdrawals
are found to arrive in a Poisson fashion with
mean arrival rate 20 per hour. What would be the
effect on the average waiting time for depositors
and withdrawers, if each teller could handle both
withdrawers & depositors?
38. Outline for Today’s Talk
• Definition of Simulation
• Brief History
• Applications
• “Real World” Applications
• Example of how to build one
• Questions????
39. Definition:
“Simulation is the process of designing
a model of a real system and conducting
experiments with this model for the
purpose of either understanding the
behavior of the system and/or
evaluating various strategies for the
operation of the system.”
- Introduction to Simulation Using SIMAN
(2nd Edition)
40. Allows us to:
• Model complex systems in a detailed way
• Describe the behavior of systems
• Construct theories or hypotheses that account for
the observed behavior
• Use the model to predict future behavior, that is,
the effects that will be produced by changes in
the system
• Analyze proposed systems
41. Simulation is one of the most widely
used techniques in operations research
and management science…
42. Brief History Not a very old technique...
• World War II
• “Monte Carlo” simulation: originated with
the work on the atomic bomb. Used to
simulate bombing raids. Given the
security code name “Monte-Carlo”.
• Still widely used today for certain problems
which are not analytically solvable (for
example: complex multiple integrals…)
43. Brief History (cont.)
• Late ‘50s, early ‘60s
• Computers improve
• First languages introduced: SIMSCRIPT, GPSS (IBM)
• Simulation viewed at the tool of “last resort”
• Late ‘60s, early ‘70s
• Primary computers were mainframes: accessibility
and interaction was limited
• GASP IV introduced by Pritsker. Triggered a wave
of diverse applications. Significant in the evolution
of simulation.
44. Brief History (cont.)
• Late ‘70s, early ‘80s
• SLAM introduced in 1979 by Pritsker and Pegden.
• Models more credible because of sophisticated tools.
• SIMAN introduced in 1982 by Pegden. First language
to run on both a mainframe as well as a
microcomputer.
• Late ‘80s through present
• Powerful PCs
• Languages are very sophisticated (market almost
saturated)
• Major advancement: graphics. Models can now be
animated!
45. What can be simulated?
Almost anything can
and
almost everything has...
46. Applications:
• COMPUTER SYSTEMS: hardware components, software
systems, networks, data base management, information
processing, etc..
• MANUFACTURING: material handling systems, assembly
lines, automated production facilities, inventory control
systems, plant layout, etc..
• BUSINESS: stock and commodity analysis, pricing policies,
marketing strategies, cash flow analysis, forecasting, etc..
• GOVERNMENT: military weapons and their use, military
tactics, population forecasting, land use, health care
delivery, fire protection, criminal justice, traffic control,
etc..
And the list goes on and on...
47. Examples of Applications at Disney World
• Cruise Line Operation: Simulate the arrival and
check-in process at the dock. Discovered the
process they had in mind would cause hours
in delays before getting on the ship.
• Private Island Arrival: How to transport passengers
to the beach area? Drop-off point far from the
beach. Used simulation to determine whether
to invest in trams, how many trams to purchase,
average transport and waiting times, etc..
48. Examples of Applications at Disney World
• Bus Maintenance Facility: Investigated “best” way
of scheduling preventative maintenance trips.
• Alien Encounter Attraction: Visitors move through
three areas. Encountered major variability
when ride opened due to load and unload
times (therefore, visitors waiting long periods
before getting on the ride). Used simulation
to determine the length of the individual shows
so as to avoid bottlenecks.
50. Advantages to Simulation:
• Can be used to study existing systems without disrupting the
ongoing operations.
• Proposed systems can be “tested” before committing resources.
• Allows us to control time.
• Allows us to identify bottlenecks.
• Allows us to gain insight into which variables are most
important to system performance.
52. Disadvantages to Simulation
• Model building is an art as well as a science. The quality
of the analysis depends on the quality of the model and the
skill of the modeler (Remember: GIGO)
• Simulation results are sometimes hard to interpret.
• Simulation analysis can be time consuming and expensive.
Should not be used when an analytical method would
provide for quicker results.
53. Process of Simulation
Total four Phase of the Simulation Process
A)Definition of the problem and statement of objectives
B)Construction of an appropriate model
C)Experimentation with the model constructed
D)Evaluation of the result of Simulation