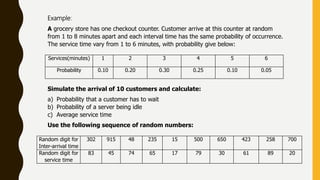
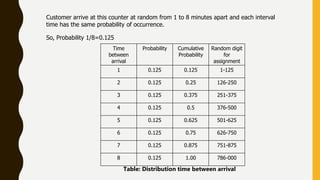
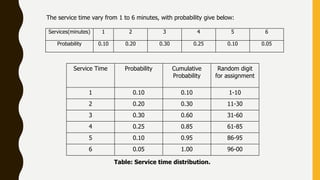
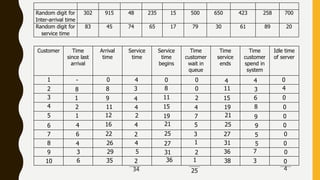
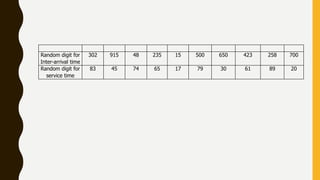
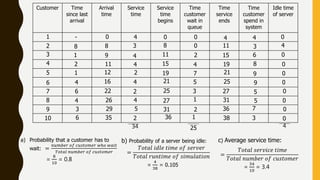
W E L C O M E T O M Y
P R E S E N T AT I O N
My presentation topic is:
Simulation of Queueing Systems(Single-Channel
Queue).
Md. Badrul alam hridoyjbd@gmail.com
A grocery store has one checkout counter. Customer arrive at this counter at random
from 1 to 8 minutes apart and each interval time has the same probability of occurrence.
The service time vary from 1 to 6 minutes, with probability give below:
Services(minutes) 1 2 3 4 5 6
Probability 0.10 0.20 0.30 0.25 0.10 0.05
Simulate the arrival of 10 customers and calculate:
a) Probability that a customer has to wait
b) Probability of a server being idle
c) Average service time
Use the following sequence of random numbers:
Random digit for
Inter-arrival time
302 915 48 235 15 500 650 423 258 700
Random digit for
service time
83 45 74 65 17 79 30 61 89 20
Example:
Time
between
arrival
Probability Cumulative
Probability
Random digit
for
assignment
1 0.125 0.125 1-125
2 0.125 0.25 126-250
3 0.125 0.375 251-375
4 0.125 0.5 376-500
5 0.125 0.625 501-625
6 0.125 0.75 626-750
7 0.125 0.875 751-875
8 0.125 1.00 786-000
Customer arrive at this counter at random from 1 to 8 minutes apart and each interval
time has the same probability of occurrence.
So, Probability 1/8=0.125
Table: Distribution time between arrival
Service Time Probability Cumulative
Probability
Random digit
for assignment
1 0.10 0.10 1-10
2 0.20 0.30 11-30
3 0.30 0.60 31-60
4 0.25 0.85 61-85
5 0.10 0.95 86-95
6 0.05 1.00 96-00
Services(minutes) 1 2 3 4 5 6
Probability 0.10 0.20 0.30 0.25 0.10 0.05
The service time vary from 1 to 6 minutes, with probability give below:
Table: Service time distribution.
Customer Time
since last
arrival
Arrival
time
Service
time
Service
time
begins
Time
customer
wait in
queue
Time
service
ends
Time
customer
spend in
system
Idle time
of server
Random digit for
Inter-arrival time
302 915 48 235 15 500 650 423 258 700
Random digit for
service time
83 45 74 65 17 79 30 61 89 20
434 25
1
2
3
4
6
5
7
8
9
10
-
41
3113
040
0
0
8 8 0 4
11 2 15 6
0
2 11
4 4
015 4 19 84
1 12 19 7 21 9 0
4 16 4 21 5 25 9 0
6 22 2 25 3 27 5 0
4 26 4 27 1 31 5 0
3 29 5 31 2 36 7 0
6 35 2 36 1 38 3 0
8
9
2
Random digit for
Inter-arrival time
302 915 48 235 15 500 650 423 258 700
Random digit for
service time
83 45 74 65 17 79 30 61 89 20
a) Probability that a customer has to
wait: =
𝑛𝑢𝑚𝑏𝑒𝑟 𝑜𝑓 𝑐𝑢𝑠𝑡𝑜𝑚𝑒𝑟 𝑤ℎ𝑜 𝑤𝑎𝑖𝑡
𝑇𝑜𝑡𝑎𝑙 𝑛𝑢𝑚𝑏𝑒𝑟 𝑜𝑓 𝑐𝑢𝑠𝑡𝑜𝑚𝑒𝑟
=
8
10
= 0.8
b) Probability of a server being idle:
=
𝑇𝑜𝑡𝑎𝑙 𝑖𝑑𝑙𝑒 𝑡𝑖𝑚𝑒 𝑜𝑓 𝑠𝑒𝑟𝑣𝑒𝑟
𝑇𝑜𝑡𝑎𝑙 𝑟𝑢𝑛𝑡𝑖𝑚𝑒 𝑜𝑓 𝑠𝑖𝑚𝑢𝑙𝑎𝑡𝑖𝑜𝑛
=
4
38
= 0.105
c) Average service time:
=
𝑇𝑜𝑡𝑎𝑙 𝑠𝑒𝑟𝑣𝑖𝑐𝑒 𝑡𝑖𝑚𝑒
𝑇𝑜𝑡𝑎𝑙 𝑛𝑢𝑚𝑏𝑒𝑟 𝑜𝑓 𝑐𝑢𝑠𝑡𝑜𝑚𝑒𝑟
=
34
10
= 3.4
Customer Time
since last
arrival
Arrival
time
Service
time
Service
time
begins
Time
customer
wait in
queue
Time
service
ends
Time
customer
spend in
system
Idle time
of server
434 25
1
2
3
4
6
5
7
8
9
10
-
41
3113
040
0
0
8 8 0 4
11 2 15 6
0
2 11
4 4
015 4 19 84
1 12 19 7 21 9 0
4 16 4 21 5 25 9 0
6 22 2 25 3 27 5 0
4 26 4 27 1 31 5 0
3 29 5 31 2 36 7 0
6 35 2 36 1 38 3 0
8
9
2
THANK YOU.

Simulation of Queueing Systems(Single-Channel Queue).

  • 1.
    W E LC O M E T O M Y P R E S E N T AT I O N
  • 2.
    My presentation topicis: Simulation of Queueing Systems(Single-Channel Queue). Md. Badrul alam hridoyjbd@gmail.com
  • 3.
    A grocery storehas one checkout counter. Customer arrive at this counter at random from 1 to 8 minutes apart and each interval time has the same probability of occurrence. The service time vary from 1 to 6 minutes, with probability give below: Services(minutes) 1 2 3 4 5 6 Probability 0.10 0.20 0.30 0.25 0.10 0.05 Simulate the arrival of 10 customers and calculate: a) Probability that a customer has to wait b) Probability of a server being idle c) Average service time Use the following sequence of random numbers: Random digit for Inter-arrival time 302 915 48 235 15 500 650 423 258 700 Random digit for service time 83 45 74 65 17 79 30 61 89 20 Example:
  • 4.
    Time between arrival Probability Cumulative Probability Random digit for assignment 10.125 0.125 1-125 2 0.125 0.25 126-250 3 0.125 0.375 251-375 4 0.125 0.5 376-500 5 0.125 0.625 501-625 6 0.125 0.75 626-750 7 0.125 0.875 751-875 8 0.125 1.00 786-000 Customer arrive at this counter at random from 1 to 8 minutes apart and each interval time has the same probability of occurrence. So, Probability 1/8=0.125 Table: Distribution time between arrival
  • 5.
    Service Time ProbabilityCumulative Probability Random digit for assignment 1 0.10 0.10 1-10 2 0.20 0.30 11-30 3 0.30 0.60 31-60 4 0.25 0.85 61-85 5 0.10 0.95 86-95 6 0.05 1.00 96-00 Services(minutes) 1 2 3 4 5 6 Probability 0.10 0.20 0.30 0.25 0.10 0.05 The service time vary from 1 to 6 minutes, with probability give below: Table: Service time distribution.
  • 6.
    Customer Time since last arrival Arrival time Service time Service time begins Time customer waitin queue Time service ends Time customer spend in system Idle time of server Random digit for Inter-arrival time 302 915 48 235 15 500 650 423 258 700 Random digit for service time 83 45 74 65 17 79 30 61 89 20 434 25 1 2 3 4 6 5 7 8 9 10 - 41 3113 040 0 0 8 8 0 4 11 2 15 6 0 2 11 4 4 015 4 19 84 1 12 19 7 21 9 0 4 16 4 21 5 25 9 0 6 22 2 25 3 27 5 0 4 26 4 27 1 31 5 0 3 29 5 31 2 36 7 0 6 35 2 36 1 38 3 0 8 9 2
  • 7.
    Random digit for Inter-arrivaltime 302 915 48 235 15 500 650 423 258 700 Random digit for service time 83 45 74 65 17 79 30 61 89 20
  • 8.
    a) Probability thata customer has to wait: = 𝑛𝑢𝑚𝑏𝑒𝑟 𝑜𝑓 𝑐𝑢𝑠𝑡𝑜𝑚𝑒𝑟 𝑤ℎ𝑜 𝑤𝑎𝑖𝑡 𝑇𝑜𝑡𝑎𝑙 𝑛𝑢𝑚𝑏𝑒𝑟 𝑜𝑓 𝑐𝑢𝑠𝑡𝑜𝑚𝑒𝑟 = 8 10 = 0.8 b) Probability of a server being idle: = 𝑇𝑜𝑡𝑎𝑙 𝑖𝑑𝑙𝑒 𝑡𝑖𝑚𝑒 𝑜𝑓 𝑠𝑒𝑟𝑣𝑒𝑟 𝑇𝑜𝑡𝑎𝑙 𝑟𝑢𝑛𝑡𝑖𝑚𝑒 𝑜𝑓 𝑠𝑖𝑚𝑢𝑙𝑎𝑡𝑖𝑜𝑛 = 4 38 = 0.105 c) Average service time: = 𝑇𝑜𝑡𝑎𝑙 𝑠𝑒𝑟𝑣𝑖𝑐𝑒 𝑡𝑖𝑚𝑒 𝑇𝑜𝑡𝑎𝑙 𝑛𝑢𝑚𝑏𝑒𝑟 𝑜𝑓 𝑐𝑢𝑠𝑡𝑜𝑚𝑒𝑟 = 34 10 = 3.4 Customer Time since last arrival Arrival time Service time Service time begins Time customer wait in queue Time service ends Time customer spend in system Idle time of server 434 25 1 2 3 4 6 5 7 8 9 10 - 41 3113 040 0 0 8 8 0 4 11 2 15 6 0 2 11 4 4 015 4 19 84 1 12 19 7 21 9 0 4 16 4 21 5 25 9 0 6 22 2 25 3 27 5 0 4 26 4 27 1 31 5 0 3 29 5 31 2 36 7 0 6 35 2 36 1 38 3 0 8 9 2
  • 9.