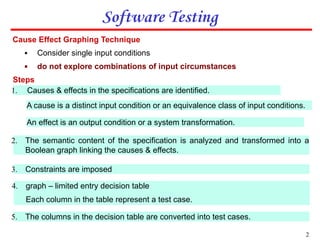
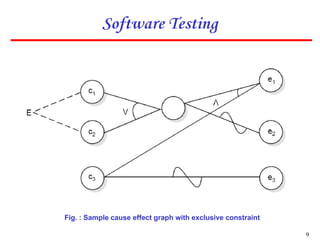
1. The document describes the cause effect graphing technique for software testing. It identifies causes as input conditions and effects as output conditions or system transformations.
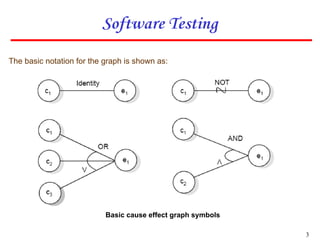
2. The technique involves identifying causes and effects from specifications, constructing a Boolean graph linking them, imposing constraints, and generating test cases from the graph.
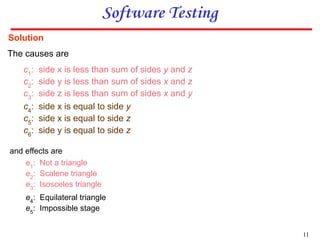
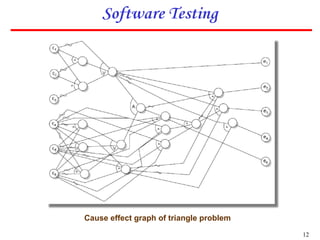
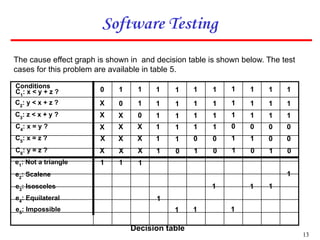
3. An example cause effect graph is provided for a program classifying triangle types based on side lengths, with causes as side length comparisons and effects as possible triangle types or errors.

![10
Software Testing
Example
Consider a simple program to classify a triangle. Its inputs is a triple of
positive integers (say x, y, z) and the data type for input parameters ensures
that these will be integers greater than 0 and less than or equal to 100. The
program output may be one of the following words:
[Scalene; Isosceles; Equilateral; Not a triangle]
Draw the Cause effect graph and identify the test cases.](https://image.slidesharecdn.com/causeeffectgraphing-220303200930/85/Cause-effect-graphing-ppt-10-320.jpg)