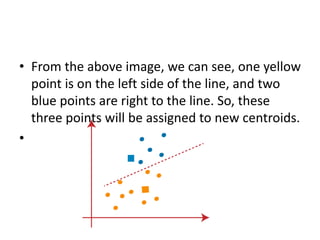
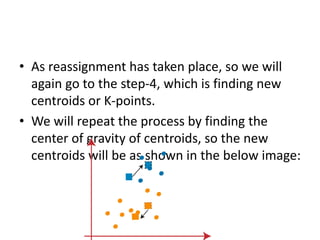
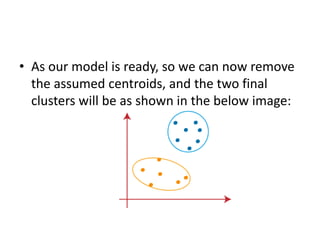
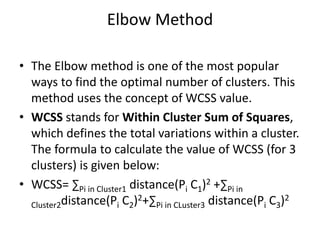
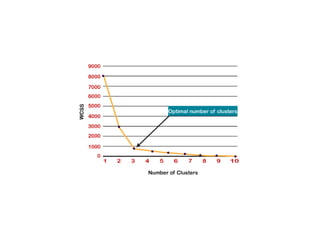
SlideShare a Scribd company logo
K-Means Clustering Algorithm
What is K-Means Algorithm?
• K-Means Clustering is an unsupervised learning
algorithm that is used to solve the clustering
problems in machine learning or data science.
• K-Means Clustering is an Unsupervised Learning
algorithm, which groups the unlabeled dataset
into different clusters.
• Here K defines the number of pre-defined
clusters that need to be created in the process, as
if K=2, there will be two clusters, and for K=3,
there will be three clusters, and so on.
• It allows us to cluster the data into different groups and a
convenient way to discover the categories of groups in the
unlabeled dataset on its own without the need for any
training.
• It is a centroid-based algorithm, where each cluster is
associated with a centroid. The main aim of this algorithm
is to minimize the sum of distances between the data point
and their corresponding clusters.
• The algorithm takes the unlabeled dataset as input, divides
the dataset into k-number of clusters, and repeats the
process until it does not find the best clusters. The value of
k should be predetermined in this algorithm.
The k-means clustering algorithm mainly performs
two tasks:
• Determines the best value for K center points or
centroids by an iterative process.
• Assigns each data point to its closest k-center.
Those data points which are near to the
particular k-center, create a cluster.
• Hence each cluster has datapoints with some
commonalities, and it is away from other clusters.
• The below diagram explains the working of
the K-means Clustering Algorithm:
How does the K-Means Algorithm
Work?
• Step-1: Select the number K to decide the number of
clusters.
• Step-2: Select random K points or centroids. (It can be
other from the input dataset).
• Step-3: Assign each data point to their closest centroid,
which will form the predefined K clusters.
• Step-4: Calculate the variance and place a new centroid of
each cluster.
• Step-5: Repeat the third steps, which means reassign each
datapoint to the new closest centroid of each cluster.
• Step-6: If any reassignment occurs, then go to step-4 else
go to FINISH.
• Step-7: The model is ready.
• Suppose we have two variables M1 and M2.
The x-y axis scatter plot of these two variables
is given below:
• Let's take number k of clusters, i.e., K=2, to
identify the dataset and to put them into
different clusters. It means here we will try to
group these datasets into two different clusters.
• We need to choose some random k points or
centroid to form the cluster. These points can be
either the points from the dataset or any other
point. So, here we are selecting the below two
points as k points, which are not the part of our
dataset. Consider the below image:
• Now we will assign each data point of the
scatter plot to its closest K-point or centroid.
We will compute it by applying some
mathematics that we have studied to calculate
the distance between two points. So, we will
draw a median between both the centroids.
Consider the below image:
• From the above image, it is clear that points
left side of the line is near to the K1 or blue
centroid, and points to the right of the line are
close to the yellow centroid. Let's color them
as blue and yellow for clear visualization.
• As we need to find the closest cluster, so we
will repeat the process by choosing a new
centroid. To choose the new centroids, we will
compute the center of gravity of these
centroids, and will find new centroids as
below:
• Next, we will reassign each datapoint to the
new centroid. For this, we will repeat the
same process of finding a median line. The
median will be like below image:
• From the above image, we can see, one yellow
point is on the left side of the line, and two
blue points are right to the line. So, these
three points will be assigned to new centroids.
•
• As reassignment has taken place, so we will
again go to the step-4, which is finding new
centroids or K-points.
• We will repeat the process by finding the
center of gravity of centroids, so the new
centroids will be as shown in the below image:
• As we got the new centroids so again will draw
the median line and reassign the data points.
So, the image will be:
• We can see in the above image; there are no
dissimilar data points on either side of the
line, which means our model is formed.
Consider the below image:
• As our model is ready, so we can now remove
the assumed centroids, and the two final
clusters will be as shown in the below image:
How to choose the value of "K number
of clusters" in K-means Clustering?
• The performance of the K-means clustering
algorithm depends upon highly efficient
clusters that it forms.
• But choosing the optimal number of clusters is
a big task. There are some different ways to
find the optimal number of clusters, but here
we are discussing the most appropriate
method to find the number of clusters or
value of K. The method is given below:
Elbow Method
• The Elbow method is one of the most popular
ways to find the optimal number of clusters. This
method uses the concept of WCSS value.
• WCSS stands for Within Cluster Sum of Squares,
which defines the total variations within a cluster.
The formula to calculate the value of WCSS (for 3
clusters) is given below:
• WCSS= ∑Pi in Cluster1 distance(Pi C1)2 +∑Pi in
Cluster2distance(Pi C2)2+∑Pi in CLuster3 distance(Pi C3)2
• In the above formula of WCSS,
• ∑Pi in Cluster1 distance(Pi C1)2: It is the sum of the
square of the distances between each data
point and its centroid within a cluster1 and
the same for the other two terms.
• To measure the distance between data points
and centroid, we can use any method such as
Euclidean distance or Manhattan distance.
• To find the optimal value of clusters, the elbow method follows the
below steps:
• It executes the K-means clustering on a given dataset for different K
values (ranges from 1-10).
• For each value of K, calculates the WCSS value.
• Plots a curve between calculated WCSS values and the number of
clusters K.
• The sharp point of bend or a point of the plot looks like an arm,
then that point is considered as the best value of K.
• Since the graph shows the sharp bend, which looks like an elbow,
hence it is known as the elbow method. The graph for the elbow
method looks like the below image:
•
K-Means Clustering Algorithm.pptx

More Related Content

What's hot

Introduction to Linear Discriminant Analysis
Introduction to Linear Discriminant AnalysisIntroduction to Linear Discriminant Analysis
Introduction to Linear Discriminant Analysis
Jaclyn Kokx
 
Time series data mining techniques
Time series data mining techniquesTime series data mining techniques
Time series data mining techniques
Shanmukha S. Potti
 
ML - Simple Linear Regression
ML - Simple Linear RegressionML - Simple Linear Regression
ML - Simple Linear Regression
Andrew Ferlitsch
 
Data Science - Part V - Decision Trees & Random Forests
Data Science - Part V - Decision Trees & Random Forests Data Science - Part V - Decision Trees & Random Forests
Data Science - Part V - Decision Trees & Random Forests
Derek Kane
 
Principal component analysis
Principal component analysisPrincipal component analysis
Principal component analysis
Partha Sarathi Kar
 
Introduction to Regression Analysis
Introduction to Regression AnalysisIntroduction to Regression Analysis
Introduction to Regression Analysis
Minha Hwang
 
What is the Expectation Maximization (EM) Algorithm?
What is the Expectation Maximization (EM) Algorithm?What is the Expectation Maximization (EM) Algorithm?
What is the Expectation Maximization (EM) Algorithm?
Kazuki Yoshida
 
07 regularization
07 regularization07 regularization
07 regularization
Ronald Teo
 
Logistic regression
Logistic regressionLogistic regression
Ridge regression
Ridge regressionRidge regression
Ridge regression
Ananda Swarup
 
Classification and regression trees (cart)
Classification and regression trees (cart)Classification and regression trees (cart)
Classification and regression trees (cart)
Learnbay Datascience
 
Gradient descent method
Gradient descent methodGradient descent method
Gradient descent method
Sanghyuk Chun
 
Linear Discriminant Analysis (LDA)
Linear Discriminant Analysis (LDA)Linear Discriminant Analysis (LDA)
Linear Discriminant Analysis (LDA)
Anmol Dwivedi
 
Artificial Neural Network Lect4 : Single Layer Perceptron Classifiers
Artificial Neural Network Lect4 : Single Layer Perceptron ClassifiersArtificial Neural Network Lect4 : Single Layer Perceptron Classifiers
Artificial Neural Network Lect4 : Single Layer Perceptron Classifiers
Mohammed Bennamoun
 
KNN
KNN KNN
Data Preprocessing
Data PreprocessingData Preprocessing
Support Vector Machines ( SVM )
Support Vector Machines ( SVM ) Support Vector Machines ( SVM )
Support Vector Machines ( SVM )
Mohammad Junaid Khan
 
KNN Algorithm - How KNN Algorithm Works With Example | Data Science For Begin...
KNN Algorithm - How KNN Algorithm Works With Example | Data Science For Begin...KNN Algorithm - How KNN Algorithm Works With Example | Data Science For Begin...
KNN Algorithm - How KNN Algorithm Works With Example | Data Science For Begin...
Simplilearn
 
Visual Explanation of Ridge Regression and LASSO
Visual Explanation of Ridge Regression and LASSOVisual Explanation of Ridge Regression and LASSO
Visual Explanation of Ridge Regression and LASSO
Kazuki Yoshida
 
Introduction to Machine Learning
Introduction to Machine LearningIntroduction to Machine Learning
Introduction to Machine Learning
Rahul Jain
 

What's hot (20)

Introduction to Linear Discriminant Analysis
Introduction to Linear Discriminant AnalysisIntroduction to Linear Discriminant Analysis
Introduction to Linear Discriminant Analysis
 
Time series data mining techniques
Time series data mining techniquesTime series data mining techniques
Time series data mining techniques
 
ML - Simple Linear Regression
ML - Simple Linear RegressionML - Simple Linear Regression
ML - Simple Linear Regression
 
Data Science - Part V - Decision Trees & Random Forests
Data Science - Part V - Decision Trees & Random Forests Data Science - Part V - Decision Trees & Random Forests
Data Science - Part V - Decision Trees & Random Forests
 
Principal component analysis
Principal component analysisPrincipal component analysis
Principal component analysis
 
Introduction to Regression Analysis
Introduction to Regression AnalysisIntroduction to Regression Analysis
Introduction to Regression Analysis
 
What is the Expectation Maximization (EM) Algorithm?
What is the Expectation Maximization (EM) Algorithm?What is the Expectation Maximization (EM) Algorithm?
What is the Expectation Maximization (EM) Algorithm?
 
07 regularization
07 regularization07 regularization
07 regularization
 
Logistic regression
Logistic regressionLogistic regression
Logistic regression
 
Ridge regression
Ridge regressionRidge regression
Ridge regression
 
Classification and regression trees (cart)
Classification and regression trees (cart)Classification and regression trees (cart)
Classification and regression trees (cart)
 
Gradient descent method
Gradient descent methodGradient descent method
Gradient descent method
 
Linear Discriminant Analysis (LDA)
Linear Discriminant Analysis (LDA)Linear Discriminant Analysis (LDA)
Linear Discriminant Analysis (LDA)
 
Artificial Neural Network Lect4 : Single Layer Perceptron Classifiers
Artificial Neural Network Lect4 : Single Layer Perceptron ClassifiersArtificial Neural Network Lect4 : Single Layer Perceptron Classifiers
Artificial Neural Network Lect4 : Single Layer Perceptron Classifiers
 
KNN
KNN KNN
KNN
 
Data Preprocessing
Data PreprocessingData Preprocessing
Data Preprocessing
 
Support Vector Machines ( SVM )
Support Vector Machines ( SVM ) Support Vector Machines ( SVM )
Support Vector Machines ( SVM )
 
KNN Algorithm - How KNN Algorithm Works With Example | Data Science For Begin...
KNN Algorithm - How KNN Algorithm Works With Example | Data Science For Begin...KNN Algorithm - How KNN Algorithm Works With Example | Data Science For Begin...
KNN Algorithm - How KNN Algorithm Works With Example | Data Science For Begin...
 
Visual Explanation of Ridge Regression and LASSO
Visual Explanation of Ridge Regression and LASSOVisual Explanation of Ridge Regression and LASSO
Visual Explanation of Ridge Regression and LASSO
 
Introduction to Machine Learning
Introduction to Machine LearningIntroduction to Machine Learning
Introduction to Machine Learning
 

Similar to K-Means Clustering Algorithm.pptx

Unsupervised Learning in Machine Learning
Unsupervised Learning in Machine LearningUnsupervised Learning in Machine Learning
Unsupervised Learning in Machine Learning
Pyingkodi Maran
 
CSA 3702 machine learning module 3
CSA 3702 machine learning module 3CSA 3702 machine learning module 3
CSA 3702 machine learning module 3
Nandhini S
 
Unsupervised learning Algorithms and Assumptions
Unsupervised learning Algorithms and AssumptionsUnsupervised learning Algorithms and Assumptions
Unsupervised learning Algorithms and Assumptions
refedey275
 
machine learning - Clustering in R
machine learning - Clustering in Rmachine learning - Clustering in R
machine learning - Clustering in R
Sudhakar Chavan
 
K Means Clustering Algorithm | K Means Clustering Example | Machine Learning ...
K Means Clustering Algorithm | K Means Clustering Example | Machine Learning ...K Means Clustering Algorithm | K Means Clustering Example | Machine Learning ...
K Means Clustering Algorithm | K Means Clustering Example | Machine Learning ...
Simplilearn
 
Slide-TIF311-DM-10-11.ppt
Slide-TIF311-DM-10-11.pptSlide-TIF311-DM-10-11.ppt
Slide-TIF311-DM-10-11.ppt
SandinoBerutu1
 
Slide-TIF311-DM-10-11.ppt
Slide-TIF311-DM-10-11.pptSlide-TIF311-DM-10-11.ppt
Slide-TIF311-DM-10-11.ppt
ImXaib
 
K Means Clustering Algorithm | K Means Example in Python | Machine Learning A...
K Means Clustering Algorithm | K Means Example in Python | Machine Learning A...K Means Clustering Algorithm | K Means Example in Python | Machine Learning A...
K Means Clustering Algorithm | K Means Example in Python | Machine Learning A...
Edureka!
 
Unsupervised Learning-Clustering Algorithms.pptx
Unsupervised Learning-Clustering Algorithms.pptxUnsupervised Learning-Clustering Algorithms.pptx
Unsupervised Learning-Clustering Algorithms.pptx
jasontseng19
 
Clustering.pptx
Clustering.pptxClustering.pptx
Clustering.pptx
19526YuvaKumarIrigi
 
Clustering techniques
Clustering techniquesClustering techniques
Clustering techniques
talktoharry
 
hierarchical clustering.pptx
hierarchical clustering.pptxhierarchical clustering.pptx
hierarchical clustering.pptx
PriyadharshiniG41
 
Training machine learning k means 2017
Training machine learning k means 2017Training machine learning k means 2017
Training machine learning k means 2017
Iwan Sofana
 
Lecture_3_k-mean-clustering.ppt
Lecture_3_k-mean-clustering.pptLecture_3_k-mean-clustering.ppt
Lecture_3_k-mean-clustering.ppt
SyedNahin1
 
CLUSTER ANALYSIS ALGORITHMS.pptx
CLUSTER ANALYSIS ALGORITHMS.pptxCLUSTER ANALYSIS ALGORITHMS.pptx
CLUSTER ANALYSIS ALGORITHMS.pptx
ShwetapadmaBabu1
 
k-mean-clustering.pdf
k-mean-clustering.pdfk-mean-clustering.pdf
k-mean-clustering.pdf
YatharthKhichar1
 
K means Clustering - algorithm to cluster n objects
K means Clustering - algorithm to cluster n objectsK means Clustering - algorithm to cluster n objects
K means Clustering - algorithm to cluster n objects
VoidVampire
 
kmean clustering
kmean clusteringkmean clustering
MODULE 4_ CLUSTERING.pptx
MODULE 4_ CLUSTERING.pptxMODULE 4_ CLUSTERING.pptx
MODULE 4_ CLUSTERING.pptx
nikshaikh786
 
What is the KMeans Clustering Algorithm and How Does an Enterprise Use it to ...
What is the KMeans Clustering Algorithm and How Does an Enterprise Use it to ...What is the KMeans Clustering Algorithm and How Does an Enterprise Use it to ...
What is the KMeans Clustering Algorithm and How Does an Enterprise Use it to ...
Smarten Augmented Analytics
 

Similar to K-Means Clustering Algorithm.pptx (20)

Unsupervised Learning in Machine Learning
Unsupervised Learning in Machine LearningUnsupervised Learning in Machine Learning
Unsupervised Learning in Machine Learning
 
CSA 3702 machine learning module 3
CSA 3702 machine learning module 3CSA 3702 machine learning module 3
CSA 3702 machine learning module 3
 
Unsupervised learning Algorithms and Assumptions
Unsupervised learning Algorithms and AssumptionsUnsupervised learning Algorithms and Assumptions
Unsupervised learning Algorithms and Assumptions
 
machine learning - Clustering in R
machine learning - Clustering in Rmachine learning - Clustering in R
machine learning - Clustering in R
 
K Means Clustering Algorithm | K Means Clustering Example | Machine Learning ...
K Means Clustering Algorithm | K Means Clustering Example | Machine Learning ...K Means Clustering Algorithm | K Means Clustering Example | Machine Learning ...
K Means Clustering Algorithm | K Means Clustering Example | Machine Learning ...
 
Slide-TIF311-DM-10-11.ppt
Slide-TIF311-DM-10-11.pptSlide-TIF311-DM-10-11.ppt
Slide-TIF311-DM-10-11.ppt
 
Slide-TIF311-DM-10-11.ppt
Slide-TIF311-DM-10-11.pptSlide-TIF311-DM-10-11.ppt
Slide-TIF311-DM-10-11.ppt
 
K Means Clustering Algorithm | K Means Example in Python | Machine Learning A...
K Means Clustering Algorithm | K Means Example in Python | Machine Learning A...K Means Clustering Algorithm | K Means Example in Python | Machine Learning A...
K Means Clustering Algorithm | K Means Example in Python | Machine Learning A...
 
Unsupervised Learning-Clustering Algorithms.pptx
Unsupervised Learning-Clustering Algorithms.pptxUnsupervised Learning-Clustering Algorithms.pptx
Unsupervised Learning-Clustering Algorithms.pptx
 
Clustering.pptx
Clustering.pptxClustering.pptx
Clustering.pptx
 
Clustering techniques
Clustering techniquesClustering techniques
Clustering techniques
 
hierarchical clustering.pptx
hierarchical clustering.pptxhierarchical clustering.pptx
hierarchical clustering.pptx
 
Training machine learning k means 2017
Training machine learning k means 2017Training machine learning k means 2017
Training machine learning k means 2017
 
Lecture_3_k-mean-clustering.ppt
Lecture_3_k-mean-clustering.pptLecture_3_k-mean-clustering.ppt
Lecture_3_k-mean-clustering.ppt
 
CLUSTER ANALYSIS ALGORITHMS.pptx
CLUSTER ANALYSIS ALGORITHMS.pptxCLUSTER ANALYSIS ALGORITHMS.pptx
CLUSTER ANALYSIS ALGORITHMS.pptx
 
k-mean-clustering.pdf
k-mean-clustering.pdfk-mean-clustering.pdf
k-mean-clustering.pdf
 
K means Clustering - algorithm to cluster n objects
K means Clustering - algorithm to cluster n objectsK means Clustering - algorithm to cluster n objects
K means Clustering - algorithm to cluster n objects
 
kmean clustering
kmean clusteringkmean clustering
kmean clustering
 
MODULE 4_ CLUSTERING.pptx
MODULE 4_ CLUSTERING.pptxMODULE 4_ CLUSTERING.pptx
MODULE 4_ CLUSTERING.pptx
 
What is the KMeans Clustering Algorithm and How Does an Enterprise Use it to ...
What is the KMeans Clustering Algorithm and How Does an Enterprise Use it to ...What is the KMeans Clustering Algorithm and How Does an Enterprise Use it to ...
What is the KMeans Clustering Algorithm and How Does an Enterprise Use it to ...
 

Recently uploaded

Influence of Marketing Strategy and Market Competition on Business Plan
Influence of Marketing Strategy and Market Competition on Business PlanInfluence of Marketing Strategy and Market Competition on Business Plan
Influence of Marketing Strategy and Market Competition on Business Plan
jerlynmaetalle
 
University of New South Wales degree offer diploma Transcript
University of New South Wales degree offer diploma TranscriptUniversity of New South Wales degree offer diploma Transcript
University of New South Wales degree offer diploma Transcript
soxrziqu
 
Population Growth in Bataan: The effects of population growth around rural pl...
Population Growth in Bataan: The effects of population growth around rural pl...Population Growth in Bataan: The effects of population growth around rural pl...
Population Growth in Bataan: The effects of population growth around rural pl...
Bill641377
 
06-12-2024-BudapestDataForum-BuildingReal-timePipelineswithFLaNK AIM
06-12-2024-BudapestDataForum-BuildingReal-timePipelineswithFLaNK AIM06-12-2024-BudapestDataForum-BuildingReal-timePipelineswithFLaNK AIM
06-12-2024-BudapestDataForum-BuildingReal-timePipelineswithFLaNK AIM
Timothy Spann
 
一比一原版(Coventry毕业证书)考文垂大学毕业证如何办理
一比一原版(Coventry毕业证书)考文垂大学毕业证如何办理一比一原版(Coventry毕业证书)考文垂大学毕业证如何办理
一比一原版(Coventry毕业证书)考文垂大学毕业证如何办理
74nqk8xf
 
DSSML24_tspann_CodelessGenerativeAIPipelines
DSSML24_tspann_CodelessGenerativeAIPipelinesDSSML24_tspann_CodelessGenerativeAIPipelines
DSSML24_tspann_CodelessGenerativeAIPipelines
Timothy Spann
 
4th Modern Marketing Reckoner by MMA Global India & Group M: 60+ experts on W...
4th Modern Marketing Reckoner by MMA Global India & Group M: 60+ experts on W...4th Modern Marketing Reckoner by MMA Global India & Group M: 60+ experts on W...
4th Modern Marketing Reckoner by MMA Global India & Group M: 60+ experts on W...
Social Samosa
 
一比一原版(Harvard毕业证书)哈佛大学毕业证如何办理
一比一原版(Harvard毕业证书)哈佛大学毕业证如何办理一比一原版(Harvard毕业证书)哈佛大学毕业证如何办理
一比一原版(Harvard毕业证书)哈佛大学毕业证如何办理
zsjl4mimo
 
Analysis insight about a Flyball dog competition team's performance
Analysis insight about a Flyball dog competition team's performanceAnalysis insight about a Flyball dog competition team's performance
Analysis insight about a Flyball dog competition team's performance
roli9797
 
Global Situational Awareness of A.I. and where its headed
Global Situational Awareness of A.I. and where its headedGlobal Situational Awareness of A.I. and where its headed
Global Situational Awareness of A.I. and where its headed
vikram sood
 
The Building Blocks of QuestDB, a Time Series Database
The Building Blocks of QuestDB, a Time Series DatabaseThe Building Blocks of QuestDB, a Time Series Database
The Building Blocks of QuestDB, a Time Series Database
javier ramirez
 
Challenges of Nation Building-1.pptx with more important
Challenges of Nation Building-1.pptx with more importantChallenges of Nation Building-1.pptx with more important
Challenges of Nation Building-1.pptx with more important
Sm321
 
06-04-2024 - NYC Tech Week - Discussion on Vector Databases, Unstructured Dat...
06-04-2024 - NYC Tech Week - Discussion on Vector Databases, Unstructured Dat...06-04-2024 - NYC Tech Week - Discussion on Vector Databases, Unstructured Dat...
06-04-2024 - NYC Tech Week - Discussion on Vector Databases, Unstructured Dat...
Timothy Spann
 
End-to-end pipeline agility - Berlin Buzzwords 2024
End-to-end pipeline agility - Berlin Buzzwords 2024End-to-end pipeline agility - Berlin Buzzwords 2024
End-to-end pipeline agility - Berlin Buzzwords 2024
Lars Albertsson
 
Experts live - Improving user adoption with AI
Experts live - Improving user adoption with AIExperts live - Improving user adoption with AI
Experts live - Improving user adoption with AI
jitskeb
 
My burning issue is homelessness K.C.M.O.
My burning issue is homelessness K.C.M.O.My burning issue is homelessness K.C.M.O.
My burning issue is homelessness K.C.M.O.
rwarrenll
 
Palo Alto Cortex XDR presentation .......
Palo Alto Cortex XDR presentation .......Palo Alto Cortex XDR presentation .......
Palo Alto Cortex XDR presentation .......
Sachin Paul
 
一比一原版(GWU,GW文凭证书)乔治·华盛顿大学毕业证如何办理
一比一原版(GWU,GW文凭证书)乔治·华盛顿大学毕业证如何办理一比一原版(GWU,GW文凭证书)乔治·华盛顿大学毕业证如何办理
一比一原版(GWU,GW文凭证书)乔治·华盛顿大学毕业证如何办理
bopyb
 
Intelligence supported media monitoring in veterinary medicine
Intelligence supported media monitoring in veterinary medicineIntelligence supported media monitoring in veterinary medicine
Intelligence supported media monitoring in veterinary medicine
AndrzejJarynowski
 
在线办理(英国UCA毕业证书)创意艺术大学毕业证在读证明一模一样
在线办理(英国UCA毕业证书)创意艺术大学毕业证在读证明一模一样在线办理(英国UCA毕业证书)创意艺术大学毕业证在读证明一模一样
在线办理(英国UCA毕业证书)创意艺术大学毕业证在读证明一模一样
v7oacc3l
 

Recently uploaded (20)

Influence of Marketing Strategy and Market Competition on Business Plan
Influence of Marketing Strategy and Market Competition on Business PlanInfluence of Marketing Strategy and Market Competition on Business Plan
Influence of Marketing Strategy and Market Competition on Business Plan
 
University of New South Wales degree offer diploma Transcript
University of New South Wales degree offer diploma TranscriptUniversity of New South Wales degree offer diploma Transcript
University of New South Wales degree offer diploma Transcript
 
Population Growth in Bataan: The effects of population growth around rural pl...
Population Growth in Bataan: The effects of population growth around rural pl...Population Growth in Bataan: The effects of population growth around rural pl...
Population Growth in Bataan: The effects of population growth around rural pl...
 
06-12-2024-BudapestDataForum-BuildingReal-timePipelineswithFLaNK AIM
06-12-2024-BudapestDataForum-BuildingReal-timePipelineswithFLaNK AIM06-12-2024-BudapestDataForum-BuildingReal-timePipelineswithFLaNK AIM
06-12-2024-BudapestDataForum-BuildingReal-timePipelineswithFLaNK AIM
 
一比一原版(Coventry毕业证书)考文垂大学毕业证如何办理
一比一原版(Coventry毕业证书)考文垂大学毕业证如何办理一比一原版(Coventry毕业证书)考文垂大学毕业证如何办理
一比一原版(Coventry毕业证书)考文垂大学毕业证如何办理
 
DSSML24_tspann_CodelessGenerativeAIPipelines
DSSML24_tspann_CodelessGenerativeAIPipelinesDSSML24_tspann_CodelessGenerativeAIPipelines
DSSML24_tspann_CodelessGenerativeAIPipelines
 
4th Modern Marketing Reckoner by MMA Global India & Group M: 60+ experts on W...
4th Modern Marketing Reckoner by MMA Global India & Group M: 60+ experts on W...4th Modern Marketing Reckoner by MMA Global India & Group M: 60+ experts on W...
4th Modern Marketing Reckoner by MMA Global India & Group M: 60+ experts on W...
 
一比一原版(Harvard毕业证书)哈佛大学毕业证如何办理
一比一原版(Harvard毕业证书)哈佛大学毕业证如何办理一比一原版(Harvard毕业证书)哈佛大学毕业证如何办理
一比一原版(Harvard毕业证书)哈佛大学毕业证如何办理
 
Analysis insight about a Flyball dog competition team's performance
Analysis insight about a Flyball dog competition team's performanceAnalysis insight about a Flyball dog competition team's performance
Analysis insight about a Flyball dog competition team's performance
 
Global Situational Awareness of A.I. and where its headed
Global Situational Awareness of A.I. and where its headedGlobal Situational Awareness of A.I. and where its headed
Global Situational Awareness of A.I. and where its headed
 
The Building Blocks of QuestDB, a Time Series Database
The Building Blocks of QuestDB, a Time Series DatabaseThe Building Blocks of QuestDB, a Time Series Database
The Building Blocks of QuestDB, a Time Series Database
 
Challenges of Nation Building-1.pptx with more important
Challenges of Nation Building-1.pptx with more importantChallenges of Nation Building-1.pptx with more important
Challenges of Nation Building-1.pptx with more important
 
06-04-2024 - NYC Tech Week - Discussion on Vector Databases, Unstructured Dat...
06-04-2024 - NYC Tech Week - Discussion on Vector Databases, Unstructured Dat...06-04-2024 - NYC Tech Week - Discussion on Vector Databases, Unstructured Dat...
06-04-2024 - NYC Tech Week - Discussion on Vector Databases, Unstructured Dat...
 
End-to-end pipeline agility - Berlin Buzzwords 2024
End-to-end pipeline agility - Berlin Buzzwords 2024End-to-end pipeline agility - Berlin Buzzwords 2024
End-to-end pipeline agility - Berlin Buzzwords 2024
 
Experts live - Improving user adoption with AI
Experts live - Improving user adoption with AIExperts live - Improving user adoption with AI
Experts live - Improving user adoption with AI
 
My burning issue is homelessness K.C.M.O.
My burning issue is homelessness K.C.M.O.My burning issue is homelessness K.C.M.O.
My burning issue is homelessness K.C.M.O.
 
Palo Alto Cortex XDR presentation .......
Palo Alto Cortex XDR presentation .......Palo Alto Cortex XDR presentation .......
Palo Alto Cortex XDR presentation .......
 
一比一原版(GWU,GW文凭证书)乔治·华盛顿大学毕业证如何办理
一比一原版(GWU,GW文凭证书)乔治·华盛顿大学毕业证如何办理一比一原版(GWU,GW文凭证书)乔治·华盛顿大学毕业证如何办理
一比一原版(GWU,GW文凭证书)乔治·华盛顿大学毕业证如何办理
 
Intelligence supported media monitoring in veterinary medicine
Intelligence supported media monitoring in veterinary medicineIntelligence supported media monitoring in veterinary medicine
Intelligence supported media monitoring in veterinary medicine
 
在线办理(英国UCA毕业证书)创意艺术大学毕业证在读证明一模一样
在线办理(英国UCA毕业证书)创意艺术大学毕业证在读证明一模一样在线办理(英国UCA毕业证书)创意艺术大学毕业证在读证明一模一样
在线办理(英国UCA毕业证书)创意艺术大学毕业证在读证明一模一样
 

K-Means Clustering Algorithm.pptx

  • 2. What is K-Means Algorithm? • K-Means Clustering is an unsupervised learning algorithm that is used to solve the clustering problems in machine learning or data science. • K-Means Clustering is an Unsupervised Learning algorithm, which groups the unlabeled dataset into different clusters. • Here K defines the number of pre-defined clusters that need to be created in the process, as if K=2, there will be two clusters, and for K=3, there will be three clusters, and so on.
  • 3. • It allows us to cluster the data into different groups and a convenient way to discover the categories of groups in the unlabeled dataset on its own without the need for any training. • It is a centroid-based algorithm, where each cluster is associated with a centroid. The main aim of this algorithm is to minimize the sum of distances between the data point and their corresponding clusters. • The algorithm takes the unlabeled dataset as input, divides the dataset into k-number of clusters, and repeats the process until it does not find the best clusters. The value of k should be predetermined in this algorithm.
  • 4. The k-means clustering algorithm mainly performs two tasks: • Determines the best value for K center points or centroids by an iterative process. • Assigns each data point to its closest k-center. Those data points which are near to the particular k-center, create a cluster. • Hence each cluster has datapoints with some commonalities, and it is away from other clusters.
  • 5. • The below diagram explains the working of the K-means Clustering Algorithm:
  • 6. How does the K-Means Algorithm Work? • Step-1: Select the number K to decide the number of clusters. • Step-2: Select random K points or centroids. (It can be other from the input dataset). • Step-3: Assign each data point to their closest centroid, which will form the predefined K clusters. • Step-4: Calculate the variance and place a new centroid of each cluster. • Step-5: Repeat the third steps, which means reassign each datapoint to the new closest centroid of each cluster. • Step-6: If any reassignment occurs, then go to step-4 else go to FINISH. • Step-7: The model is ready.
  • 7. • Suppose we have two variables M1 and M2. The x-y axis scatter plot of these two variables is given below:
  • 8. • Let's take number k of clusters, i.e., K=2, to identify the dataset and to put them into different clusters. It means here we will try to group these datasets into two different clusters. • We need to choose some random k points or centroid to form the cluster. These points can be either the points from the dataset or any other point. So, here we are selecting the below two points as k points, which are not the part of our dataset. Consider the below image:
  • 9.
  • 10. • Now we will assign each data point of the scatter plot to its closest K-point or centroid. We will compute it by applying some mathematics that we have studied to calculate the distance between two points. So, we will draw a median between both the centroids. Consider the below image:
  • 11.
  • 12. • From the above image, it is clear that points left side of the line is near to the K1 or blue centroid, and points to the right of the line are close to the yellow centroid. Let's color them as blue and yellow for clear visualization.
  • 13. • As we need to find the closest cluster, so we will repeat the process by choosing a new centroid. To choose the new centroids, we will compute the center of gravity of these centroids, and will find new centroids as below:
  • 14.
  • 15. • Next, we will reassign each datapoint to the new centroid. For this, we will repeat the same process of finding a median line. The median will be like below image:
  • 16. • From the above image, we can see, one yellow point is on the left side of the line, and two blue points are right to the line. So, these three points will be assigned to new centroids. •
  • 17. • As reassignment has taken place, so we will again go to the step-4, which is finding new centroids or K-points. • We will repeat the process by finding the center of gravity of centroids, so the new centroids will be as shown in the below image:
  • 18. • As we got the new centroids so again will draw the median line and reassign the data points. So, the image will be:
  • 19. • We can see in the above image; there are no dissimilar data points on either side of the line, which means our model is formed. Consider the below image:
  • 20. • As our model is ready, so we can now remove the assumed centroids, and the two final clusters will be as shown in the below image:
  • 21. How to choose the value of "K number of clusters" in K-means Clustering? • The performance of the K-means clustering algorithm depends upon highly efficient clusters that it forms. • But choosing the optimal number of clusters is a big task. There are some different ways to find the optimal number of clusters, but here we are discussing the most appropriate method to find the number of clusters or value of K. The method is given below:
  • 22. Elbow Method • The Elbow method is one of the most popular ways to find the optimal number of clusters. This method uses the concept of WCSS value. • WCSS stands for Within Cluster Sum of Squares, which defines the total variations within a cluster. The formula to calculate the value of WCSS (for 3 clusters) is given below: • WCSS= ∑Pi in Cluster1 distance(Pi C1)2 +∑Pi in Cluster2distance(Pi C2)2+∑Pi in CLuster3 distance(Pi C3)2
  • 23. • In the above formula of WCSS, • ∑Pi in Cluster1 distance(Pi C1)2: It is the sum of the square of the distances between each data point and its centroid within a cluster1 and the same for the other two terms. • To measure the distance between data points and centroid, we can use any method such as Euclidean distance or Manhattan distance.
  • 24. • To find the optimal value of clusters, the elbow method follows the below steps: • It executes the K-means clustering on a given dataset for different K values (ranges from 1-10). • For each value of K, calculates the WCSS value. • Plots a curve between calculated WCSS values and the number of clusters K. • The sharp point of bend or a point of the plot looks like an arm, then that point is considered as the best value of K. • Since the graph shows the sharp bend, which looks like an elbow, hence it is known as the elbow method. The graph for the elbow method looks like the below image: •