Download as PDF, PPTX
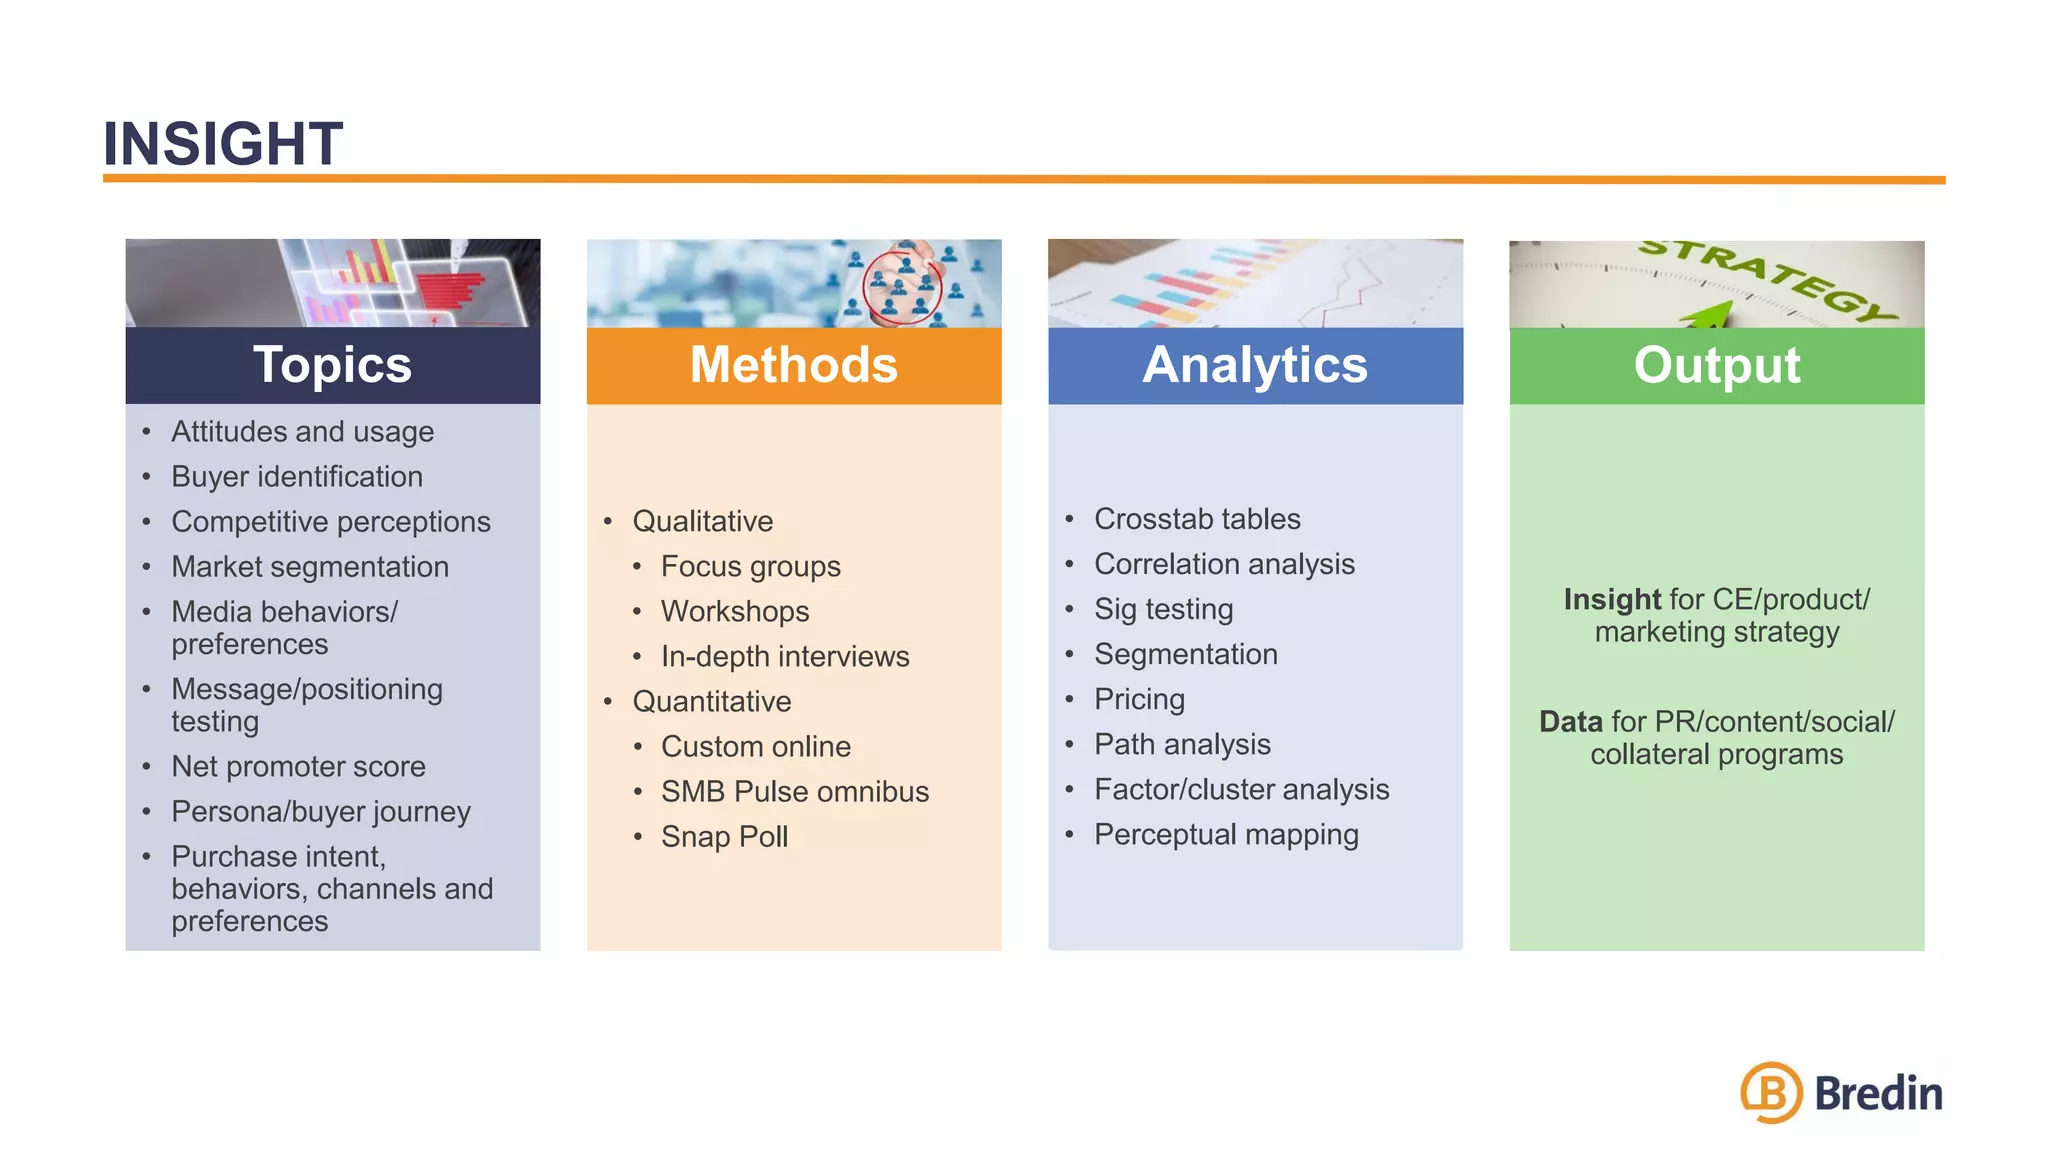
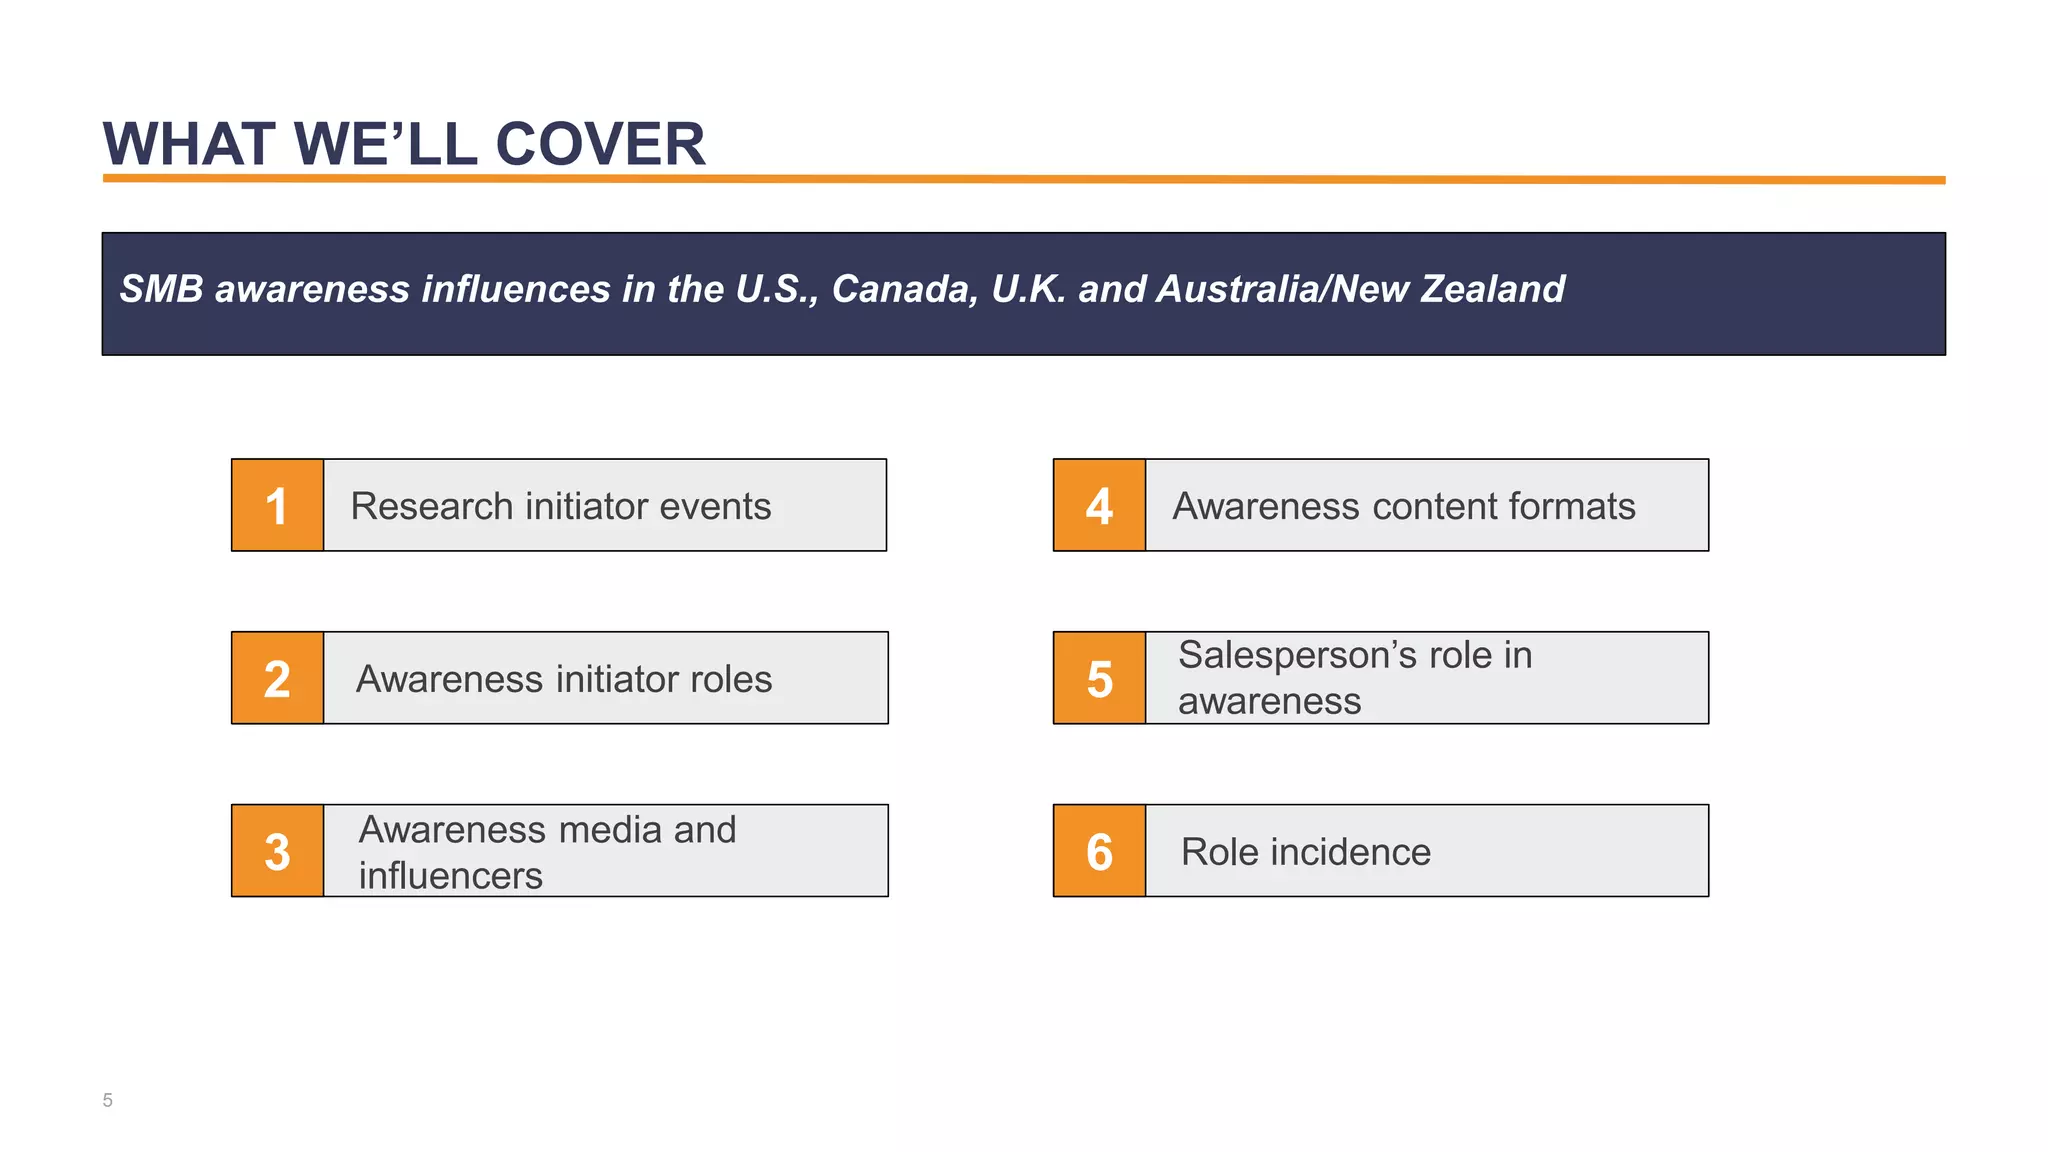

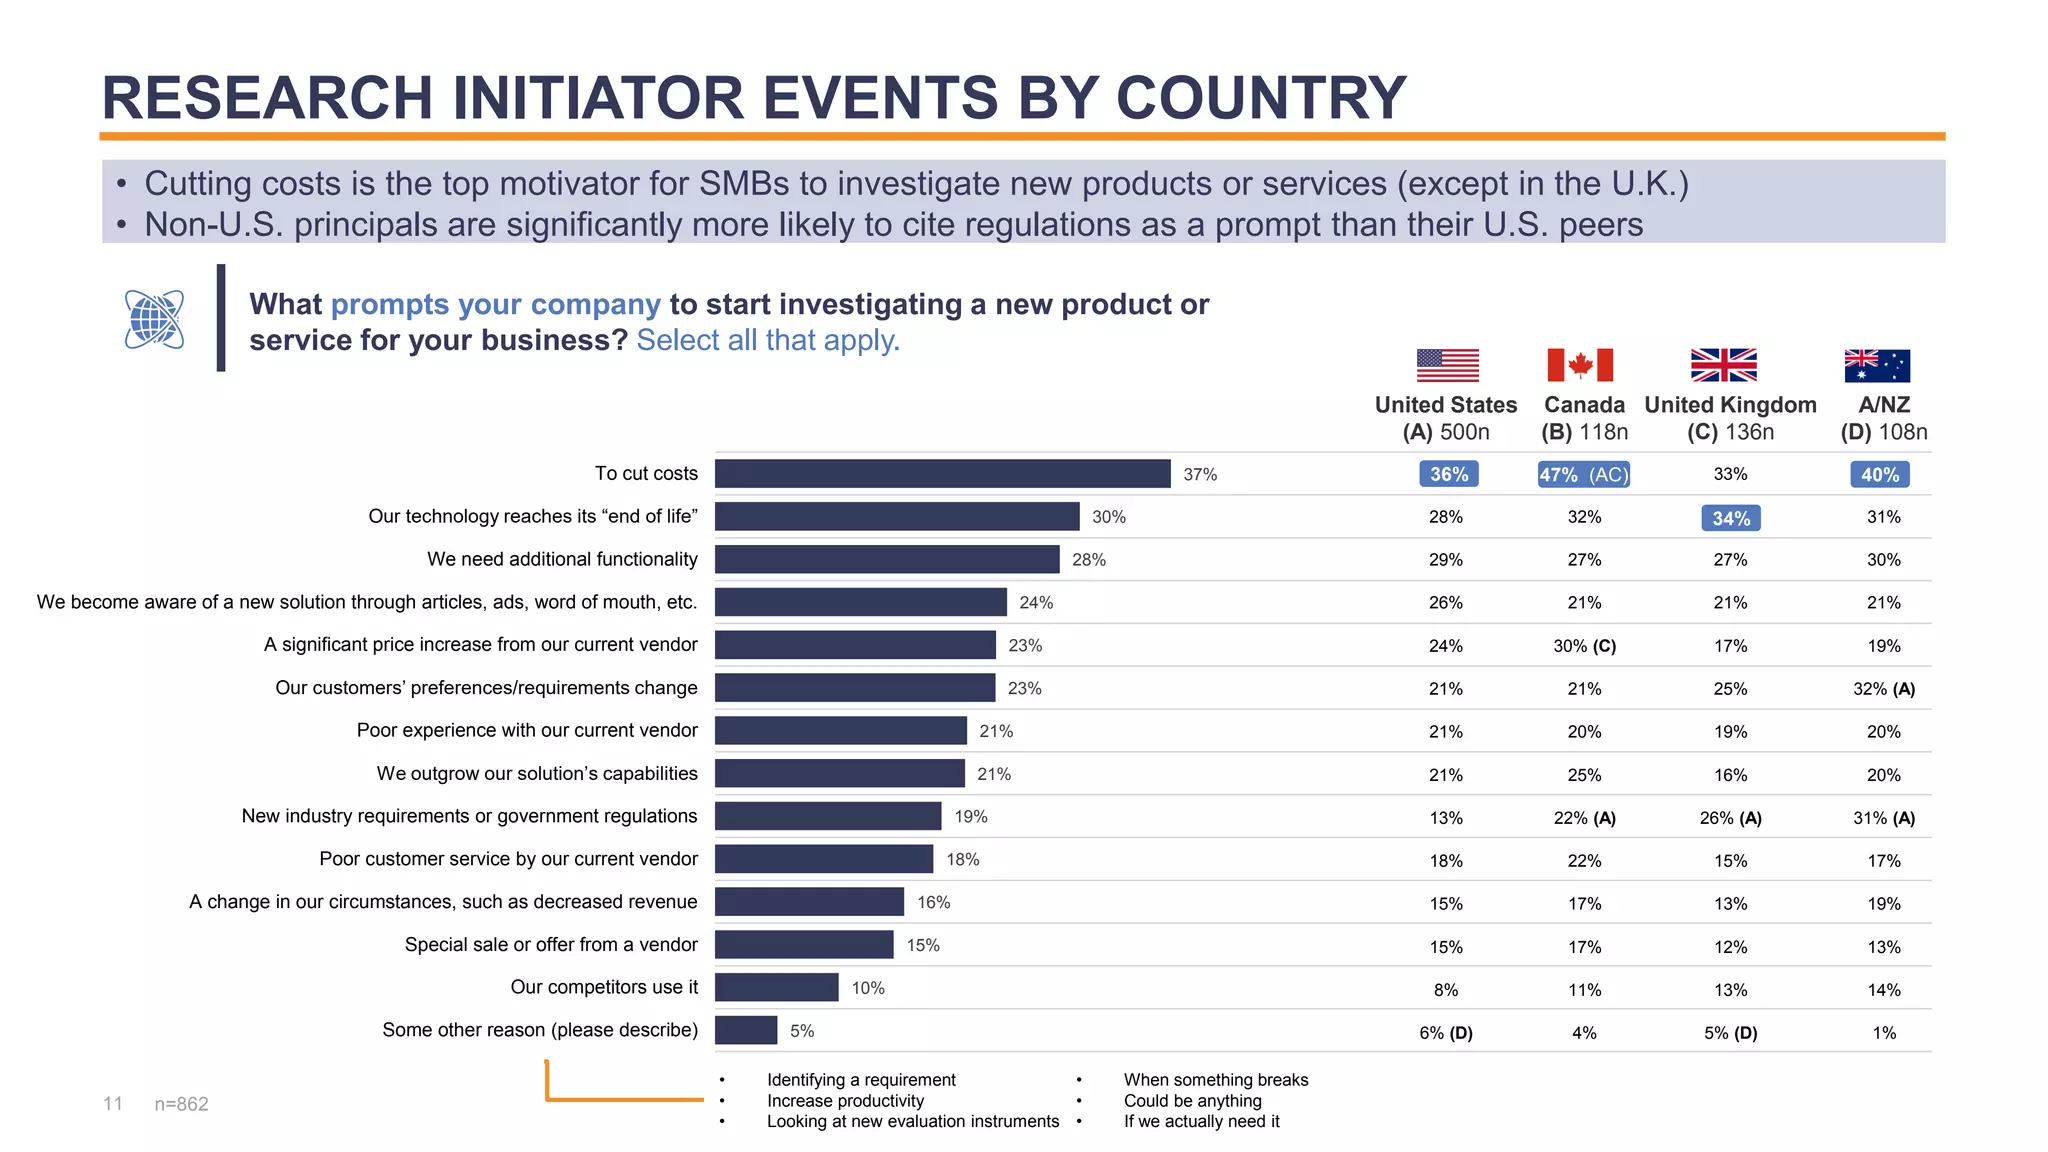

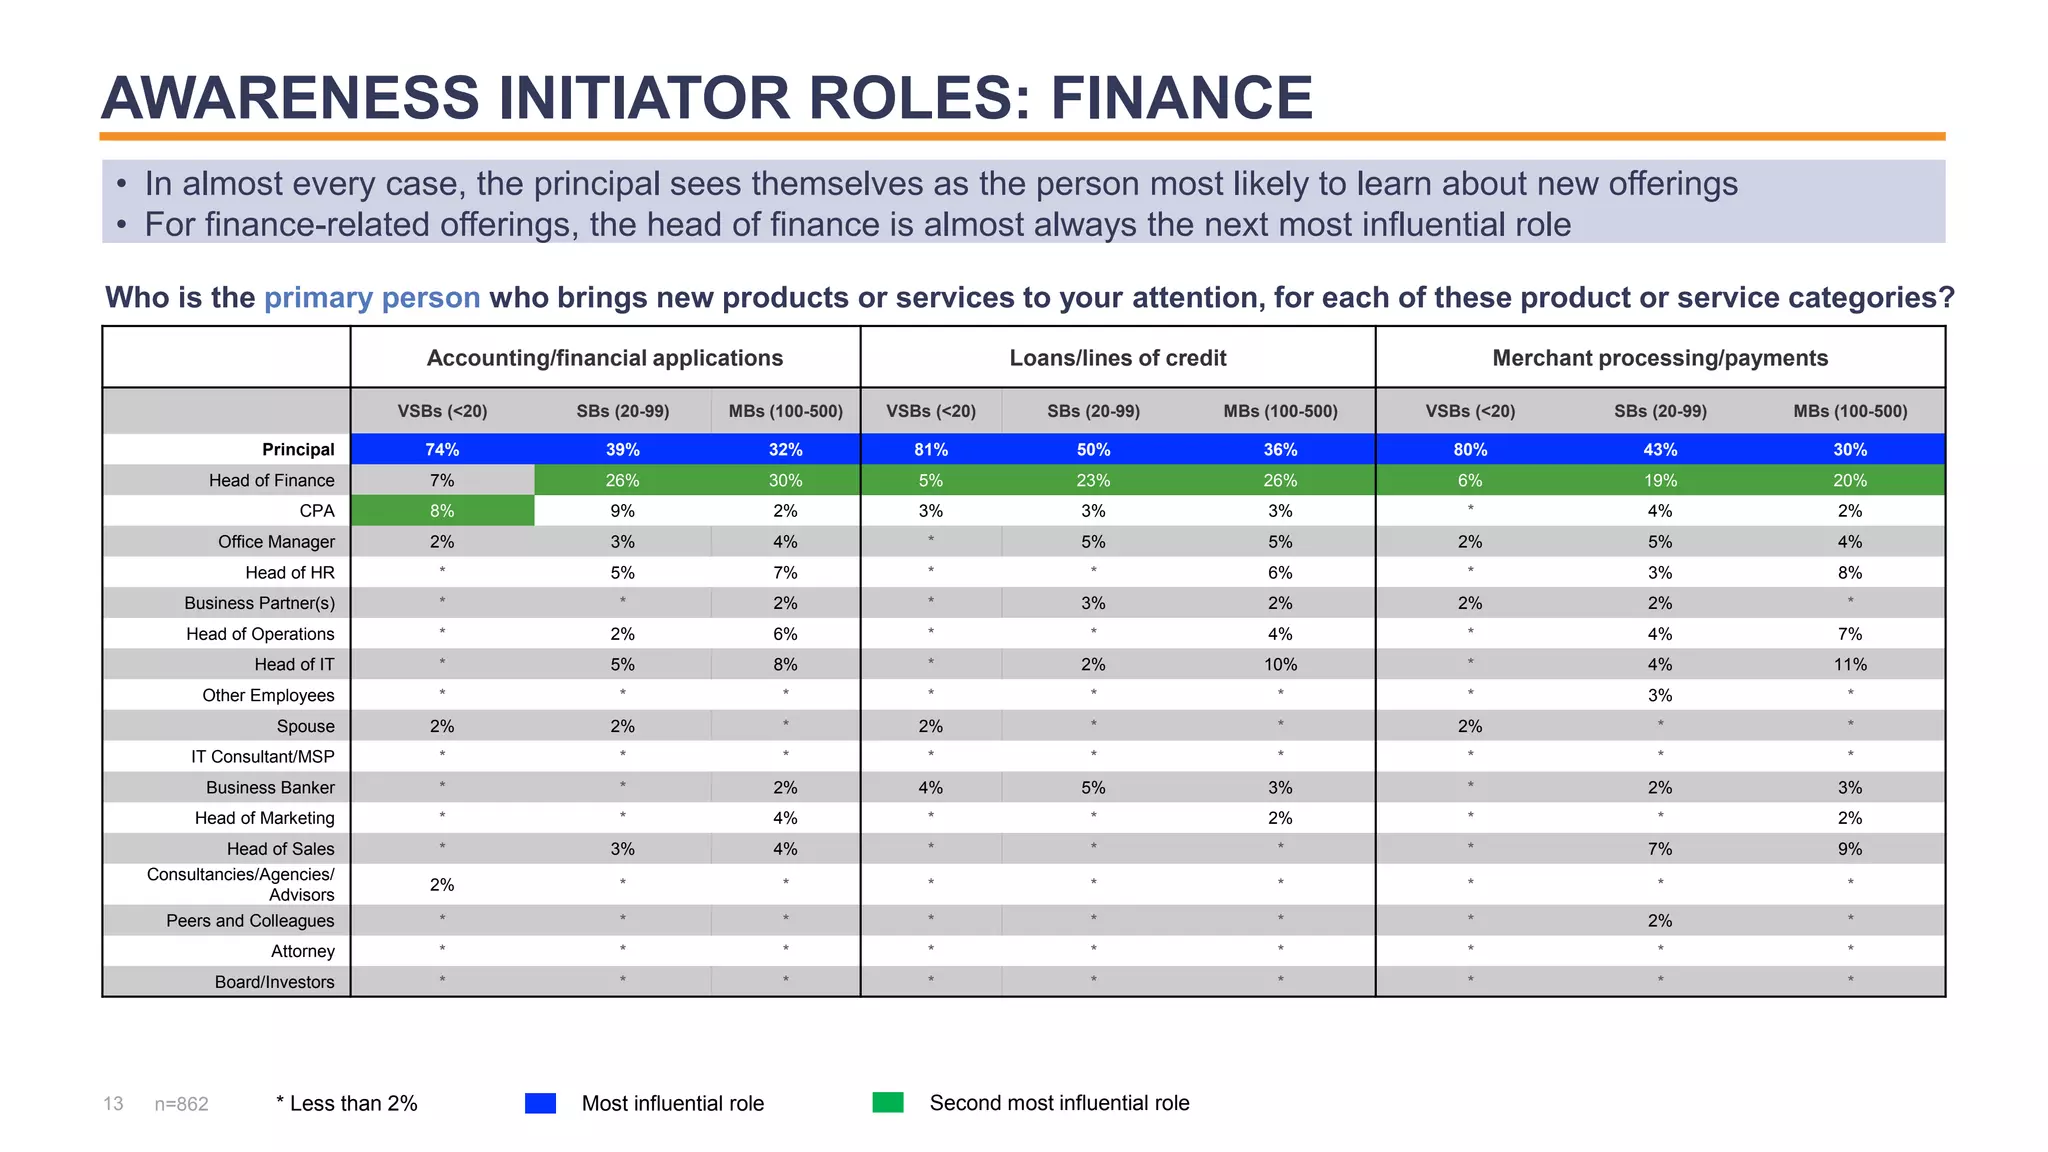


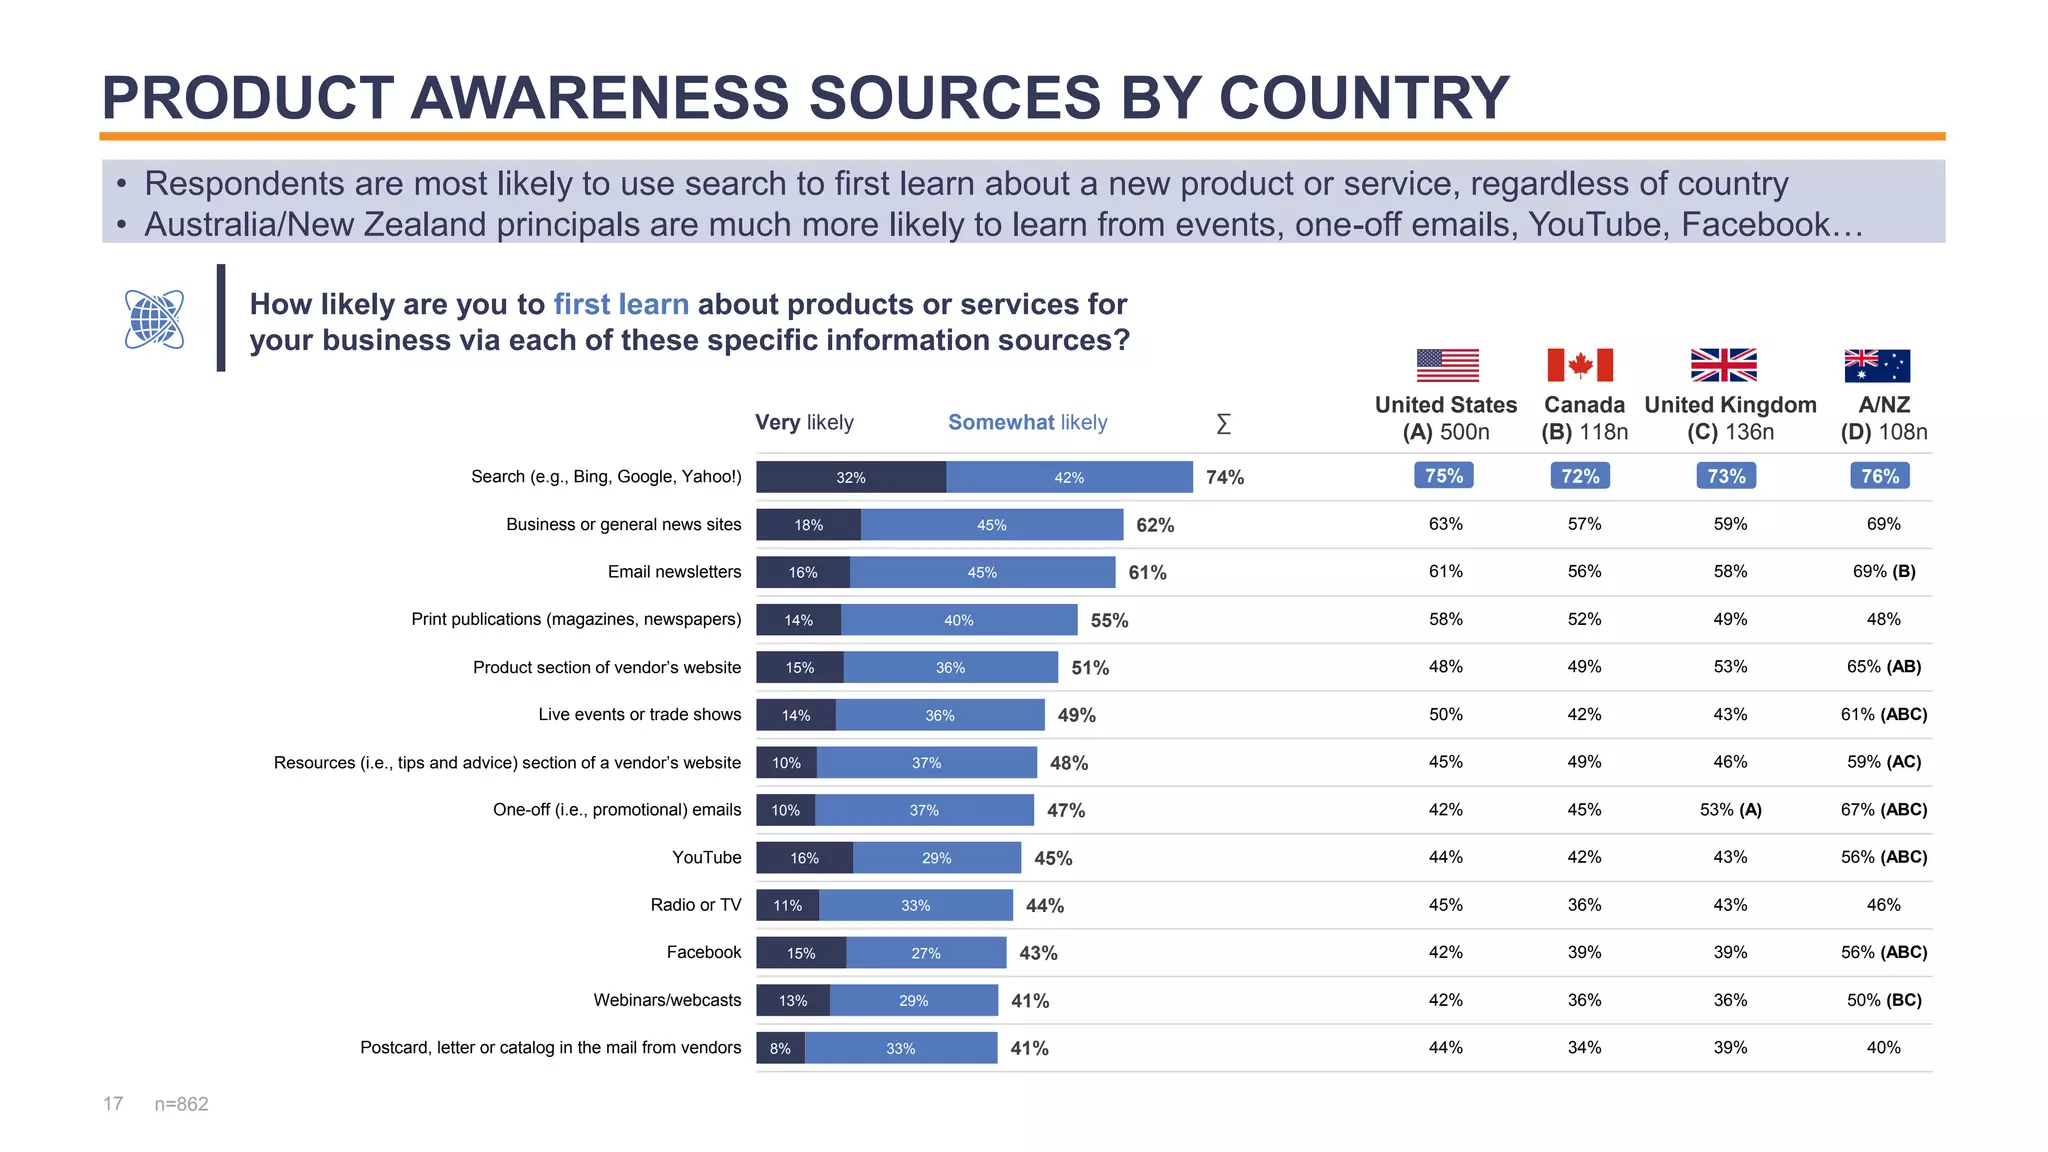


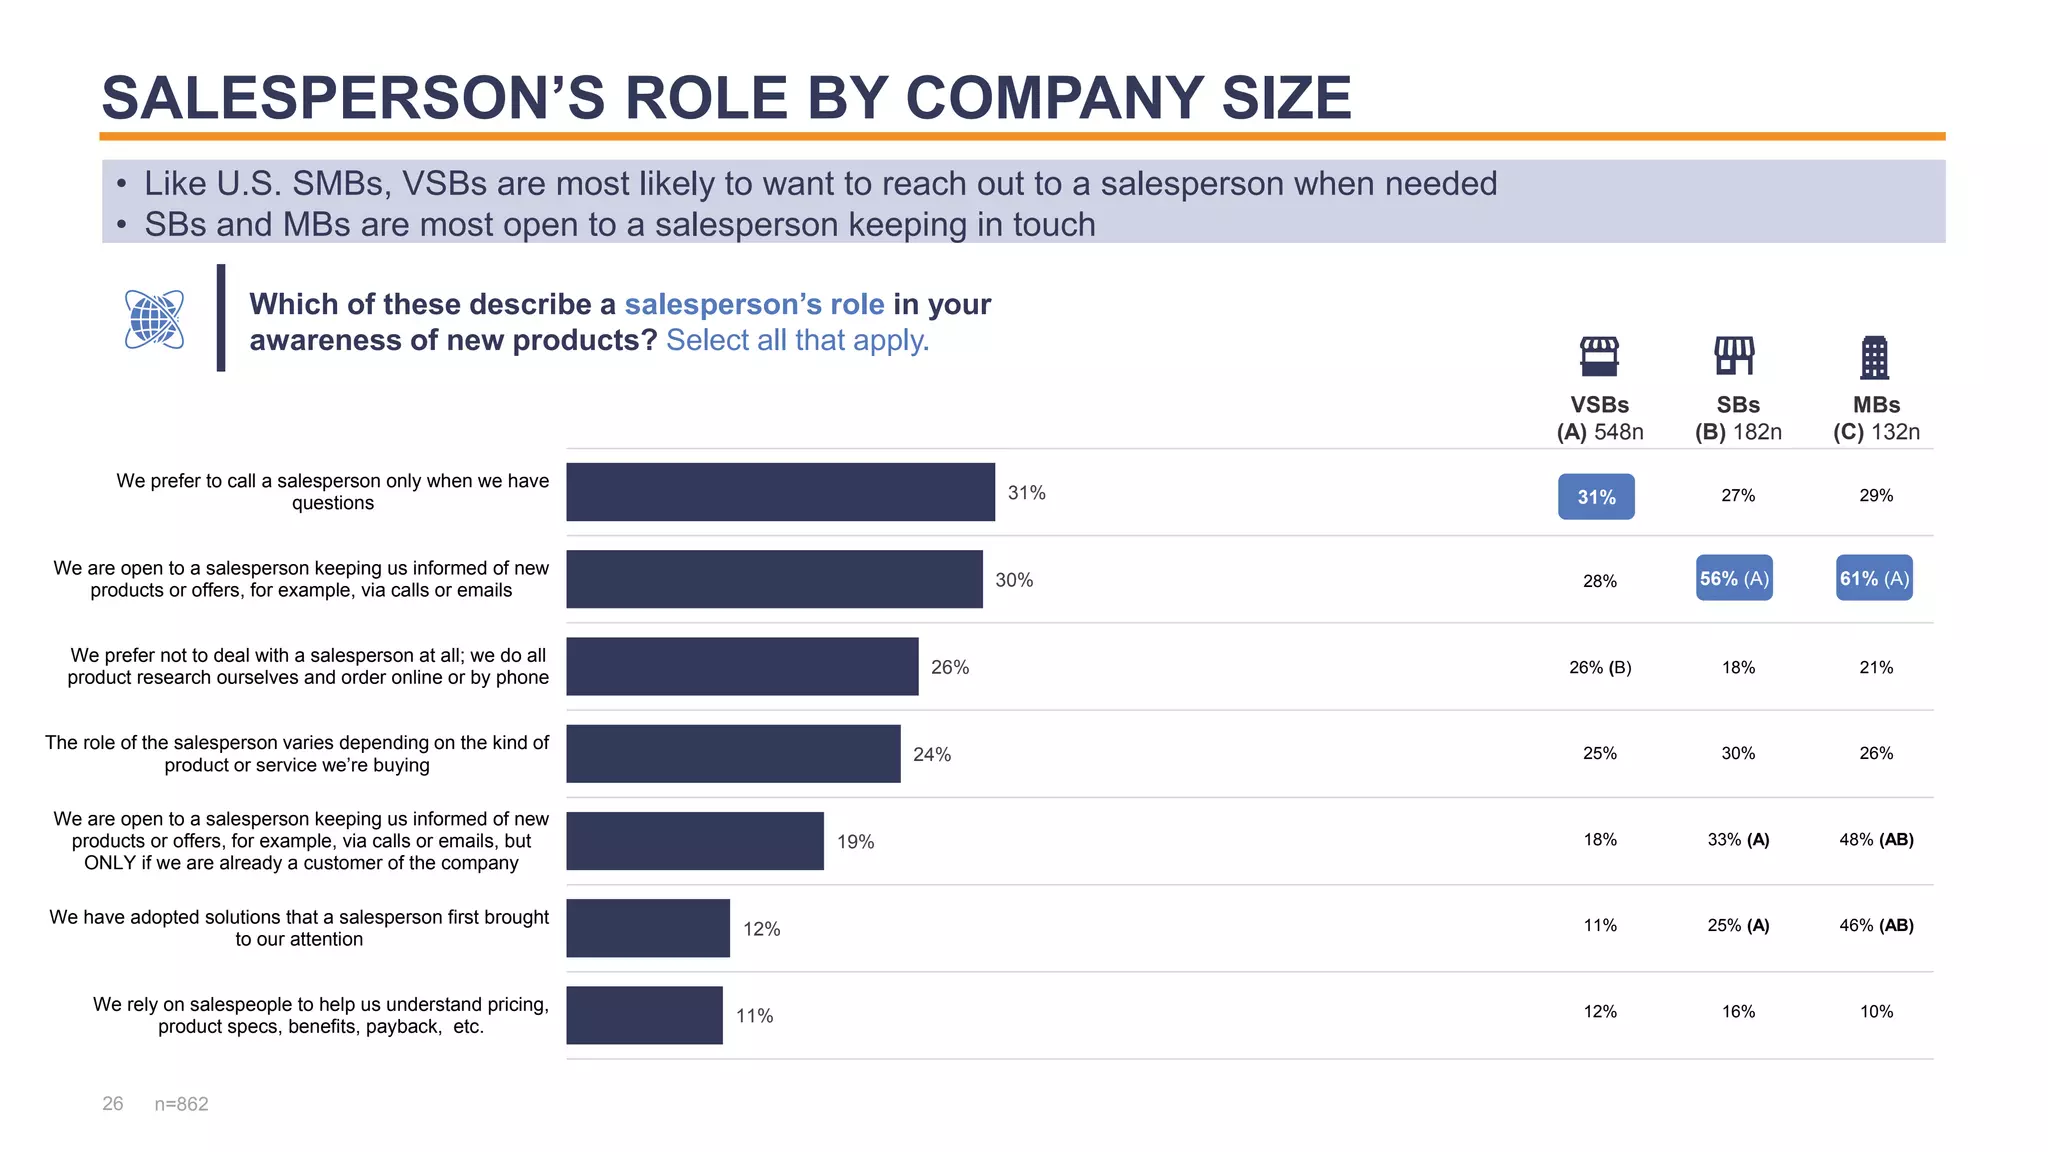


The document discusses research methods for gaining insights into small and medium-sized businesses (SMBs) to help increase sales to this segment. It outlines both qualitative and quantitative research approaches that can provide information on attitudes, usage, buyer identification, perceptions, segmentation, behaviors and preferences. The analytics output from this research can then inform content, social media, collateral and other marketing programs. Specific awareness initiator events, roles, and content formats that drive SMBs to investigate new products and services are also examined.