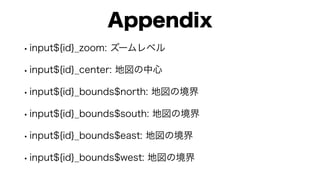
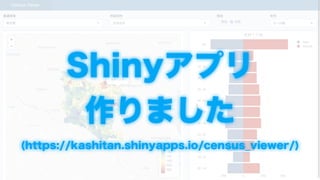
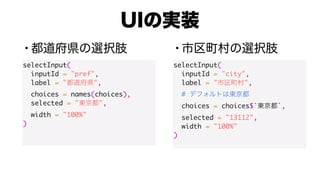
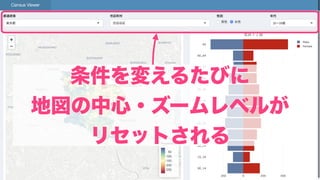
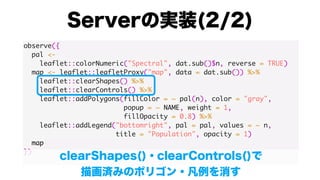
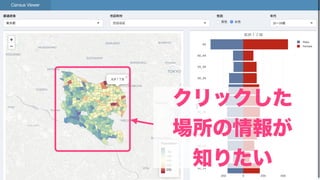
This document contains code for building interactive Shiny apps with Leaflet maps. It defines user input controls to select a geographic region and location. Map layers are added and updated based on the user selections. Code is also included to zoom the map to the selected location bounds and identify the clicked feature.
Koh Takeuchi, Ryo Nishida, Hisashi Kashima, Masaki Onishi. "Grab the Reins of Crowds: Estimating the Effects of Crowd Movement Guidance Using Causal Inference", AAMAS, 2021.
のスライド
JDD2015: Functional programing and Event Sourcing - a pair made in heaven - e...PROIDEA
Contact
FUNCTIONAL PROGRAMING AND EVENT SOURCING - A PAIR MADE IN HEAVEN - EXTENDED, 2 HOURS LONG BRAINWASH
TL;DR: This is talk is a solid introduction to two (supposedly) different topics: FP & ES. I will cover both the theory and the practice. We will emerage ES+FP application starting from ES+OO one.
While reading blogs or attending conferences, you might have heard about Event Sourcing. But didn't you get this feeling, that while there is a lot of theory out there, it is really hard to see a hands-on example? And even if you find some, those are always orbiting around Object Oriented concepts?
Greg Young once said "When we talk about Event Sourcing, current state is a left-fold of previous behaviours. Nothing new to Functional Programmers". If Functional Programming is such a natural concept for event sourced systems, shouldn't they fit together on a single codebase?
In this talk we will quickly introduce Event Sourcing (but without going into details), we will introduce some functional concepts as well (like State monad). Armoured with that knowledge we will try to transform sample ES application (OO-style, tightly coupled with framework) to frameworkless, FP-style solution).
Talk is targeted for beginner and intermediate audience. Examples will be in Scala but nothing fancy - normal syntax.
This talk is an extended version of a presentation "Event Sourcing & Functional Programming - a pair made in heaven". It is enriched with content of presentations: "Monads - asking the right question" and "It's all been done before - The Hitchhiker's Guide to Time Travel".
Implement the following sorting algorithms Bubble Sort Insertion S.pdfkesav24
Implement the following sorting algorithms: Bubble Sort Insertion Sort. Selection Sort.
Merge Sort. Heap Sort. Quick Sort. For each of the above algorithms, measure the execution
time based on input sizes n, n + 10(i), n + 20(i), n + 30(i), .. ., n + 100(i) for n = 50000 and i =
100. Let the array to be sorted be randomly initialized. Use the same machine to measure all the
algorithms. Plot a graph to compare the execution times you collected in part(2).
Solution
This code wil create a graph for each plots comparing time for different sorting methods and also
save those plots in the current directory.
from random import shuffle
from time import time
import numpy as np
import matplotlib.pyplot as plt
def bubblesort(arr):
for i in range(len(arr)):
for k in range(len(arr)-1, i, -1):
if (arr[k] < arr[k-1]):
tmp = arr[k]
arr[k] = arr[k-1]
arr[k-1] = tmp
return arr
def selectionsort(arr):
for fillslot in range(len(arr)-1,0,-1):
positionOfMax=0
for location in range(1,fillslot+1):
if arr[location]>arr[positionOfMax]:
positionOfMax = location
temp = arr[fillslot]
arr[fillslot] = arr[positionOfMax]
arr[positionOfMax] = temp
return arr
def insertionsort(arr):
for i in range( 1, len( arr ) ):
tmp = arr[i]
k = i
while k > 0 and tmp < arr[k - 1]:
arr[k] = arr[k-1]
k -= 1
arr[k] = tmp
return arr
# def mergesort(arr):
#
# if len(arr)>1:
# mid = len(arr)//2
# lefthalf = arr[:mid]
# righthalf = arr[mid:]
#
# mergesort(lefthalf)
# mergesort(righthalf)
#
# i=0
# j=0
# k=0
# while i < len(lefthalf) and j < len(righthalf):
# if lefthalf[i] < righthalf[j]:
# arr[k]=lefthalf[i]
# i=i+1
# else:
# arr[k]=righthalf[j]
# j=j+1
# k=k+1
#
# while i < len(lefthalf):
# arr[k]=lefthalf[i]
# i=i+1
# k=k+1
#
# while j < len(righthalf):
# arr[k]=righthalf[j]
# j=j+1
# k=k+1
#
# return arr
def mergesort(x):
result = []
if len(x) < 2:
return x
mid = int(len(x)/2)
y = mergesort(x[:mid])
z = mergesort(x[mid:])
i = 0
j = 0
while i < len(y) and j < len(z):
if y[i] > z[j]:
result.append(z[j])
j += 1
else:
result.append(y[i])
i += 1
result += y[i:]
result += z[j:]
return result
def quicksort(arr):
less = []
equal = []
greater = []
if len(arr) > 1:
pivot = arr[0]
for x in arr:
if x < pivot:
less.append(x)
if x == pivot:
equal.append(x)
if x > pivot:
greater.append(x)
return quicksort(less)+equal+quicksort(greater) # Just use the + operator to join lists
else:
return arr
#### Heap sort
def heapsort(arr): #convert arr to heap
length = len(arr) - 1
leastParent = length / 2
for i in range(leastParent, -1, -1):
moveDown(arr, i, length)
# flatten heap into sorted array
for i in range(length, 0, -1):
if arr[0] > arr[i]:
swap(arr, 0, i)
moveDown(arr, 0, i - 1)
def moveDown(arr, first, last):
largest = 2 * first + 1
while largest <= last: #right child exists and is larger than left child
if (largest < last) and(arr[largest] < arr[largest + 1]):
largest += 1
# right child is larger than parent
if arr[largest] > arr[first]:
swap(arr, largest, first)# move down to largest child
first = largest
lar.
Zippers are a design pattern in functional programming languages, such as Haskell, which provides a focus point and methods for navigating around in a functional data structure. It turns out that for any algebraic data type with one parameter, the derivative of the type is a zipper for it.
As Europe's leading economic powerhouse and the fourth-largest hashtag#economy globally, Germany stands at the forefront of innovation and industrial might. Renowned for its precision engineering and high-tech sectors, Germany's economic structure is heavily supported by a robust service industry, accounting for approximately 68% of its GDP. This economic clout and strategic geopolitical stance position Germany as a focal point in the global cyber threat landscape.
In the face of escalating global tensions, particularly those emanating from geopolitical disputes with nations like hashtag#Russia and hashtag#China, hashtag#Germany has witnessed a significant uptick in targeted cyber operations. Our analysis indicates a marked increase in hashtag#cyberattack sophistication aimed at critical infrastructure and key industrial sectors. These attacks range from ransomware campaigns to hashtag#AdvancedPersistentThreats (hashtag#APTs), threatening national security and business integrity.
🔑 Key findings include:
🔍 Increased frequency and complexity of cyber threats.
🔍 Escalation of state-sponsored and criminally motivated cyber operations.
🔍 Active dark web exchanges of malicious tools and tactics.
Our comprehensive report delves into these challenges, using a blend of open-source and proprietary data collection techniques. By monitoring activity on critical networks and analyzing attack patterns, our team provides a detailed overview of the threats facing German entities.
This report aims to equip stakeholders across public and private sectors with the knowledge to enhance their defensive strategies, reduce exposure to cyber risks, and reinforce Germany's resilience against cyber threats.
Chatty Kathy - UNC Bootcamp Final Project Presentation - Final Version - 5.23...John Andrews
SlideShare Description for "Chatty Kathy - UNC Bootcamp Final Project Presentation"
Title: Chatty Kathy: Enhancing Physical Activity Among Older Adults
Description:
Discover how Chatty Kathy, an innovative project developed at the UNC Bootcamp, aims to tackle the challenge of low physical activity among older adults. Our AI-driven solution uses peer interaction to boost and sustain exercise levels, significantly improving health outcomes. This presentation covers our problem statement, the rationale behind Chatty Kathy, synthetic data and persona creation, model performance metrics, a visual demonstration of the project, and potential future developments. Join us for an insightful Q&A session to explore the potential of this groundbreaking project.
Project Team: Jay Requarth, Jana Avery, John Andrews, Dr. Dick Davis II, Nee Buntoum, Nam Yeongjin & Mat Nicholas
Show drafts
volume_up
Empowering the Data Analytics Ecosystem: A Laser Focus on Value
The data analytics ecosystem thrives when every component functions at its peak, unlocking the true potential of data. Here's a laser focus on key areas for an empowered ecosystem:
1. Democratize Access, Not Data:
Granular Access Controls: Provide users with self-service tools tailored to their specific needs, preventing data overload and misuse.
Data Catalogs: Implement robust data catalogs for easy discovery and understanding of available data sources.
2. Foster Collaboration with Clear Roles:
Data Mesh Architecture: Break down data silos by creating a distributed data ownership model with clear ownership and responsibilities.
Collaborative Workspaces: Utilize interactive platforms where data scientists, analysts, and domain experts can work seamlessly together.
3. Leverage Advanced Analytics Strategically:
AI-powered Automation: Automate repetitive tasks like data cleaning and feature engineering, freeing up data talent for higher-level analysis.
Right-Tool Selection: Strategically choose the most effective advanced analytics techniques (e.g., AI, ML) based on specific business problems.
4. Prioritize Data Quality with Automation:
Automated Data Validation: Implement automated data quality checks to identify and rectify errors at the source, minimizing downstream issues.
Data Lineage Tracking: Track the flow of data throughout the ecosystem, ensuring transparency and facilitating root cause analysis for errors.
5. Cultivate a Data-Driven Mindset:
Metrics-Driven Performance Management: Align KPIs and performance metrics with data-driven insights to ensure actionable decision making.
Data Storytelling Workshops: Equip stakeholders with the skills to translate complex data findings into compelling narratives that drive action.
Benefits of a Precise Ecosystem:
Sharpened Focus: Precise access and clear roles ensure everyone works with the most relevant data, maximizing efficiency.
Actionable Insights: Strategic analytics and automated quality checks lead to more reliable and actionable data insights.
Continuous Improvement: Data-driven performance management fosters a culture of learning and continuous improvement.
Sustainable Growth: Empowered by data, organizations can make informed decisions to drive sustainable growth and innovation.
By focusing on these precise actions, organizations can create an empowered data analytics ecosystem that delivers real value by driving data-driven decisions and maximizing the return on their data investment.