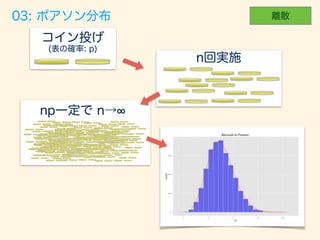
Download as PDF, PPTX


![#
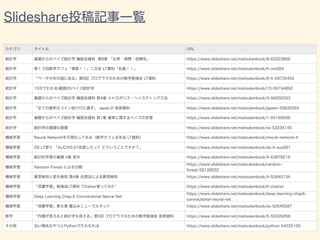
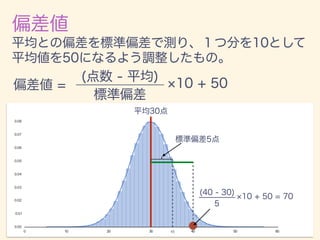
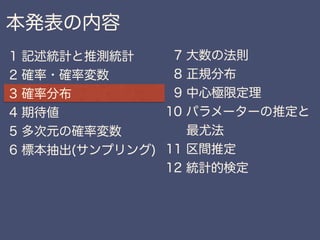
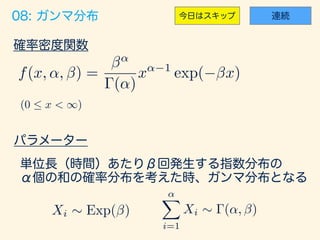
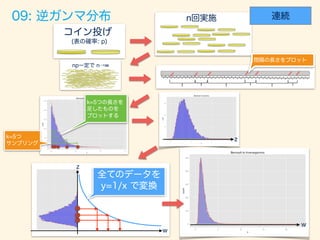
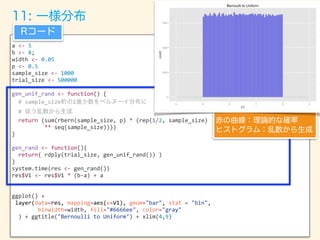
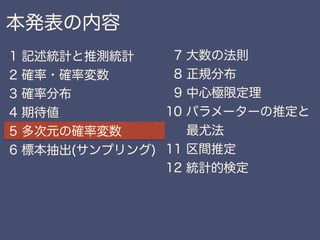
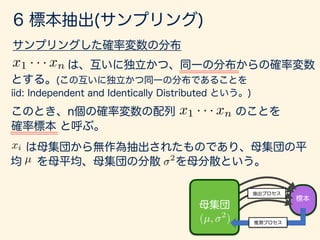
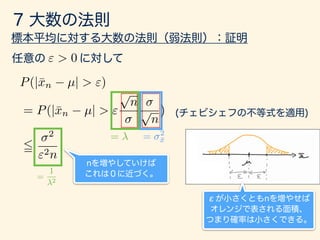
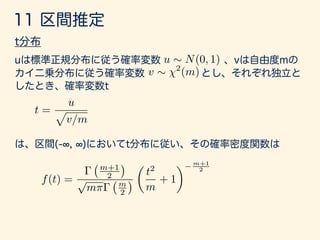
p <- 0.7; n <- 1000;
trial_size <- 100000; width <- 0.3;
df <- 3
# (3 )
gen_binom_var <- function() {
return(sum(rbern(n, p)))
}
gen_chisq_var <- function() {
result <- rdply(trial_size, gen_binom_var())
return(((result$V1 - mean(result$V1))/sd(result$V1))**2)
}
# df
result <- rlply(df, gen_chisq_var(),.progress = "text")
res <- data.frame(x=result[[1]] + result[[2]] + result[[3]])
# ( =3)
xx <- seq(0,20,0.1)
dens <- data.frame(y=dchisq(x=xx, df=df)*trial_size*width)
#
ggplot() + layer(data=data, mapping=aes(x=x), geom="bar", stat = "bin",
binwidth=width, fill="#6666ee", color="gray"
) + layer(data=dens, mapping=aes(x=xx, y=y),
geom="line", stat="identity", position="identity",
colour="blue" ) + ggtitle("Bernoulli to Chisquare")](https://image.slidesharecdn.com/rev012-170415120540/85/slide-75-320.jpg)
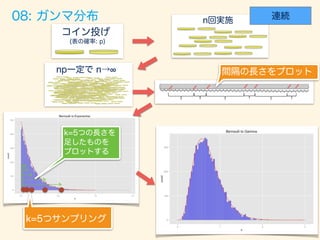
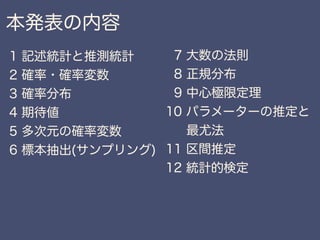
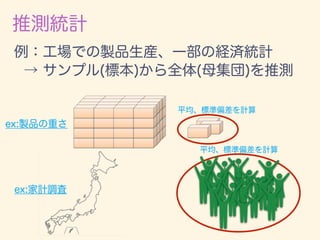
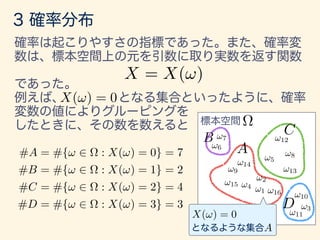
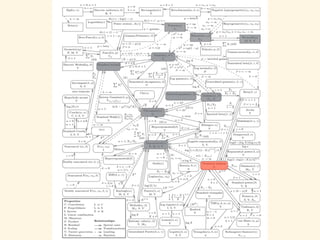
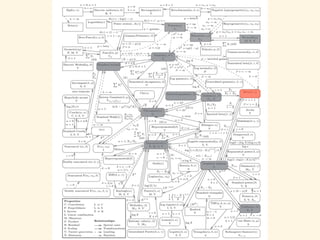
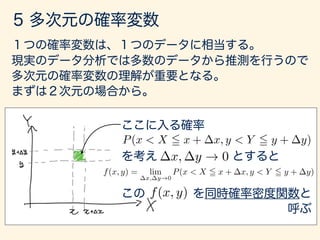
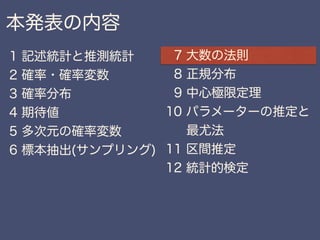
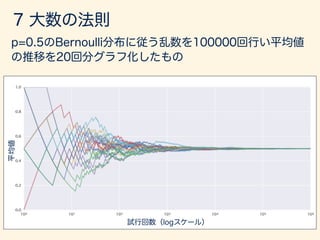
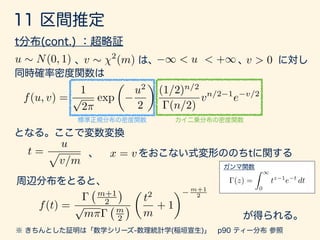
![trial_size = 7000; width <- .035;
#
p = 0.7; n = 10; np <- p*n;
# n!∞ p!0 np=
n = 10000; p <- np/n; alpha <- 5
#
get_interval <- function(){
cnt <- 0
while (TRUE) {
cnt <- cnt + 1
if (rbern(1, p)==1){ return(cnt) }
}
}
gen_exp_var <- function() {
data <- data.frame(x=rdply(trial_size, get_interval())/n)
names(data) <- c("n", "x")
return(data)
}
result <- rlply(alpha, gen_exp_var())
data <- data.frame(x=result[[1]]$x + result[[2]]$x + result[[3]]$x + result[[4]]$x +
result[[5]]$x)
#
dens <- data.frame(y=dgamma(seq(0, 3,.01), shape=alpha, rate=np)*trial_size*width)
ggplot() +
layer(data=data, mapping=aes(x=x), geom="bar", stat = "bin",
binwidth=width, fill="#6666ee", color="gray"
) + layer(data=dens, mapping=aes(x=seq(0,3,.01), y=y),
geom="line", stat="identity", position="identity", colour="red"
) + ggtitle("Bernoulli to Gamma")](https://image.slidesharecdn.com/rev012-170415120540/85/slide-84-320.jpg)
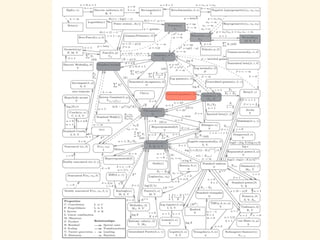
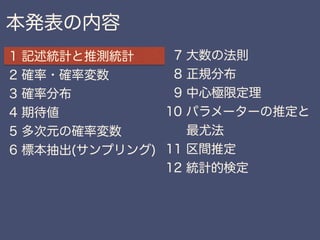
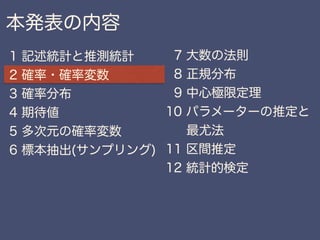
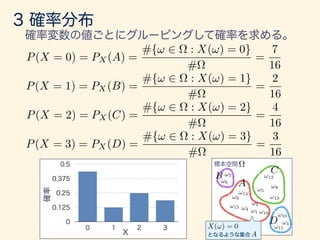
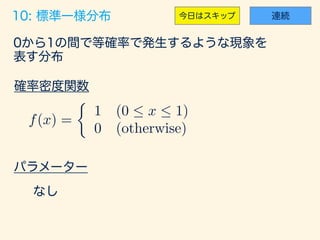
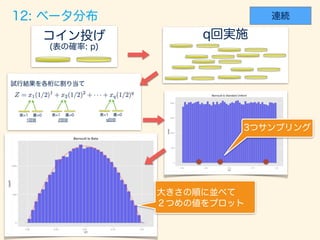
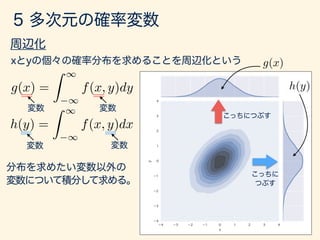
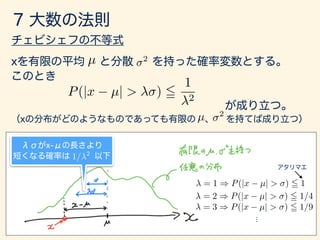
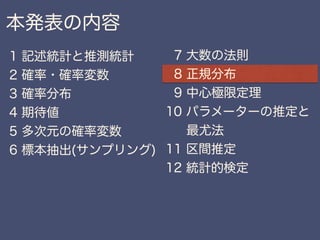
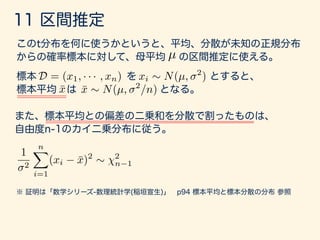
![trial_size = 7000; width <- .;
#
p = 0.7; n = 10; np <- p*n;
# n!∞ p!0 np=
n = 10000; p <- np/n; alpha <- 5
#
get_interval <- function(){
cnt <- 0
while (TRUE) {
cnt <- cnt + 1
if (rbern(1, p)==1){ return(cnt) }
}
}
gen_exp_var <- function() {
data <- data.frame(x=rdply(trial_size, get_interval())/n)
names(data) <- c("n", "x")
return(data)
}
result <- rlply(alpha, gen_exp_var())
data <- data.frame(x=1/(result[[1]]$x + result[[2]]$x + result[[3]]$x +
result[[4]]$x + result[[5]]$x))
#
dens <- data.frame(y=dinvgamma(seq(0, 23,.01), shape=5, rate=1/np)*trial_size*width)
ggplot() +
layer(data=data, mapping=aes(x=x), geom="bar", stat = "bin",
binwidth=width, fill="#6666ee", color="gray"
) + layer(data=dens, mapping=aes(x=seq(0,3,.01), y=y),
geom="line", stat="identity", position="identity", colour="red"
) + ggtitle("Bernoulli to Inversegamma")](https://image.slidesharecdn.com/rev012-170415120540/85/slide-88-320.jpg)
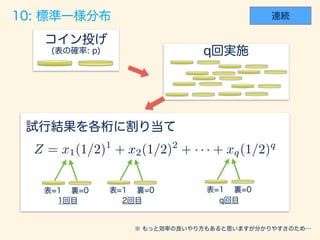
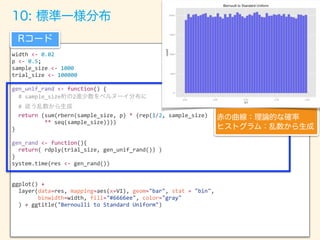

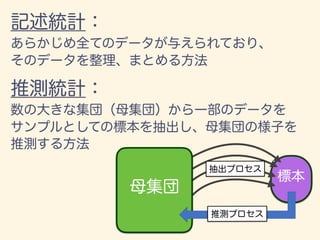
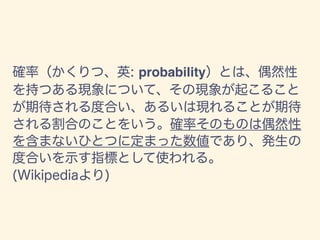
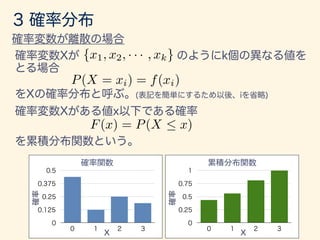
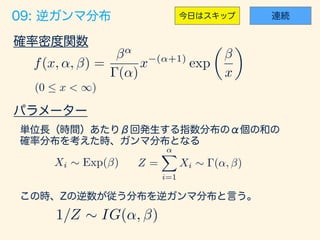
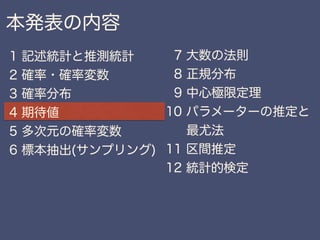
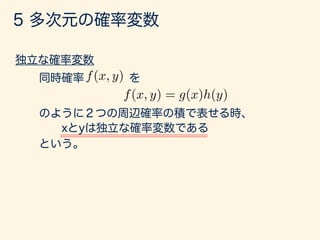
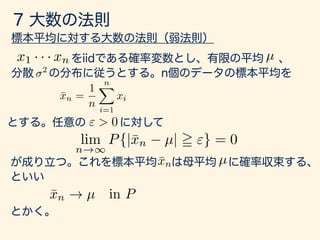
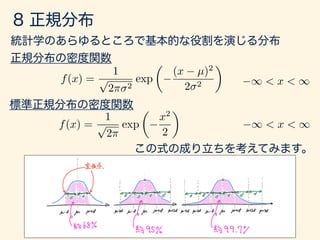
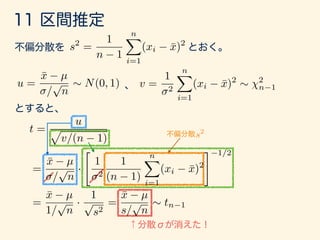
![width <- 0.03; p <- 0.5
digits_length <- 30; set_size <- 3
trial_size <- 30000
gen_unif_rand <- function() {
# digits_length 2
#
return (sum(rbern(digits_length, p) *
(rep(1/2, digits_length) **
seq(digits_length))))
}
gen_rand <- function(){
return( rdply(set_size, gen_unif_rand())$V1 )
}
unif_dataset <- rlply(trial_size, gen_rand, .progress='text')
p <- ceiling(set_size * 0.5); q <- set_size - p + 1
get_nth_data <- function(a){ return(a[order(a)][p]) }
disp_data <- data.frame(lapply(unif_dataset, get_nth_data))
names(disp_data) <- seq(length(disp_data)); disp_data <- data.frame(t(disp_data))
names(disp_data) <- "V1"
x_range <- seq(0, 1, 0.001)
dens <- data.frame(y=dbeta(x_range, p, q)*trial_size*width)
ggplot() +
layer(data=disp_data, mapping=aes(x=V1), geom="bar", stat = "bin",
binwidth=width, fill="#6666ee", color="gray"
) + layer(data=dens, mapping=aes(x=x_range, y=y),
geom="line", stat="identity", position="identity", colour="red"
) + ggtitle("Bernoulli to Beta")](https://image.slidesharecdn.com/rev012-170415120540/85/slide-100-320.jpg)
![E[X] = X( )P( ) + X( )P( )
= 0 ⇥ 0.8 + 1, 000, 000 ⇥ 0.2
= 200, 000
E[X] =
X
x
xp(x)
µ](https://image.slidesharecdn.com/rev012-170415120540/85/slide-102-320.jpg)
![✓
n
x
◆
=
n!
(n x)!x!
E[X] =
nX
x=0
xP(x) =
nX
x=0
x
✓
n
x
◆
px
(1 p)n x
=
nX
x=0
x
n!
(n x)!x!
px
(1 p)n x
=
nX
x=0
n
(n 1)!
(n x)!(x 1)!
px
(1 p)n x
= np
nX
x=0
✓
n 1
m 1
◆
p(x 1)
(1 p)(n 1) (x 1)
= np
= np
nX
x=1
✓
n 1
m 1
◆
p(x 1)
(1 p)(n 1) (x 1)
= np](https://image.slidesharecdn.com/rev012-170415120540/85/slide-103-320.jpg)
![Var[X] = E[(X E[X])2
]
=
X
x
(x E[x])2
P(x)
= 2
µ](https://image.slidesharecdn.com/rev012-170415120540/85/slide-104-320.jpg)
![Var[x] = E[(X E[X])2
]
=
Z 1
1
(x E[x])2
f(x)dx
= 2
E[X] =
Z 1
1
xf(x)dx
= µ](https://image.slidesharecdn.com/rev012-170415120540/85/slide-105-320.jpg)
![E[g(X)] =
Z 1
1
g(x)f(x)dx
g(X) = (X E[X])2
E[ · ] =
Z 1
1
· f(x)dx](https://image.slidesharecdn.com/rev012-170415120540/85/slide-106-320.jpg)
![g(x) = xk
E[g(X)] = E[Xk
] =
Z 1
1
xk
f(x)dx
µ0
k](https://image.slidesharecdn.com/rev012-170415120540/85/slide-107-320.jpg)
![g(x) = (x E[x])k
E[g(X)] = E[(X E[X]])k
] =
Z 1
1
(x E[x])k
f(x)dx
µk](https://image.slidesharecdn.com/rev012-170415120540/85/slide-108-320.jpg)
![E[cX] = cE[X]
* E[cX] =
Z 1
1
cxf(x)dx = c
Z 1
1
xf(x)dx
= cE[X]](https://image.slidesharecdn.com/rev012-170415120540/85/slide-109-320.jpg)
![Var[cX] = c2
Var[X]
* Var[cX] =
Z 1
1
(cx E[cx])2
f(x)dx
=
Z 1
1
(cx cµ)2
f(x)dx
=
Z 1
1
c2
(x µ)2
f(x)dx
= c2
Z 1
1
(x µ)2
f(x)dx
= c2
Var[X]](https://image.slidesharecdn.com/rev012-170415120540/85/slide-110-320.jpg)
![EX,Y [ g(X, Y )] =
Z 1
1
Z 1
1
g(x, y)f(x, y)dxdy
g(x, y) = x0.8
y0.8 (x, y) ⇠ N((4, 4), S) S =
1 0.5
0.4 1
EX,Y [ g(X, Y )] = 8.02](https://image.slidesharecdn.com/rev012-170415120540/85/slide-114-320.jpg)
![g(X, Y ) = (X µX)(Y µY )
Cov[X, Y ] = E[(X µX)(Y µY )]](https://image.slidesharecdn.com/rev012-170415120540/85/slide-115-320.jpg)
![g(X, Y ) = (X µX)(Y µY )
µX µX
µX µX
µY
µY
µY
µY
S1 = S2 =
S3 = S4 =
1 0.8
0.8 1
1 0.8
0.8 1
1 0
0 1
1 0.999
0.999 1
Cov[X, Y ] = E[(X µX)(Y µY )]
(x, y) ⇠ N((4, 4), S)](https://image.slidesharecdn.com/rev012-170415120540/85/slide-116-320.jpg)
![x1 · · · xn
g1(x1), · · · , gn(xn) x1 · · · xn
E[
nY
i=1
gi(xi)] =
nY
i=1
E[gi(xi)]
E[g1(x1)] E[gn(xn)]
E[
nY
i=1
gi(xi)] =
Z 1
1
· · ·
Z 1
1
g1(x1) · · · gn(xn)f(x1, · · · , xn)dx1 · · · dxn
=
Z 1
1
g1(x1)f(x1)dx1 · · ·
Z 1
1
gn(xn)f(xn)dxn
=
nY
i=1
E[gi(xi)]
f(x1) · · · f(xn)](https://image.slidesharecdn.com/rev012-170415120540/85/slide-120-320.jpg)
![E[c1x1 + · · · + cnxn]
=
Z 1
1
· · ·
Z 1
1
(c1x1 + · · · + cnxn)f(x1 · · · , xn)dx1 · · · dxn
= c1
Z 1
1
· · ·
Z 1
1
x1f(x1 · · · , xn)dx1 · · · dxn · · ·
cn
Z 1
1
· · ·
Z 1
1
xnf(x1 · · · , xn)dx1 · · · dxn
=c1
Z 1
1
x1dx1 · · · cn
Z 1
1
xndxn
=c1µ1 + · · · + cnµn
f(x1) · · · f(xn)
f(x1) · · · f(xn)
µ1 µn
=c1
Z 1
1
x1dx1 · · · cn
Z 1
1
xndxn
=c1µ1 + · · · + cnµn](https://image.slidesharecdn.com/rev012-170415120540/85/slide-122-320.jpg)
![Var[c1x1 + · · · + cnxn]
= E[{(c1x1 + · · · + cnxn) E[c1x1 + · · · + cnxn]}2
]
= E[{c1(x1 µ1) + · · · + c1(x1 µ1)}2
]
= E[
nX
i=1
c2
i (xi µi)2
+
X
i6=j
cicj(xi µj)(xi µj)]
=
nX
i=1
c2
i E[(xi µi)2
] +
X
i6=j
cicjE[(xi µj)(xi µj)]
= c2
1
2
1 + · · · + c2
n
2
n
c1µ1 + · · · + cnµn
= E[xi µi]E[xj µj] = 0= 2
i](https://image.slidesharecdn.com/rev012-170415120540/85/slide-123-320.jpg)
![x1 · · · xn
T = x1 + · · · + xn
E[T] = E[x1 + · · · + xn]
= E[x1] + · · · + E[xn]
= nµ
Var[T] = Var[x1 + · · · + xn]
= Var[x1] + · · · + Var[xn]
= n 2
2
1 = · · · = 2
n
c1 = · · · = cn = 1
Var[c1x1 + · · · + cnxn]
= c2
1
2
1 + · · · + c2
n
2
n](https://image.slidesharecdn.com/rev012-170415120540/85/slide-126-320.jpg)
![¯x =
1
n
nX
i=1
xi =
1
n
T
E[¯x] =
1
n
E[T] = n ·
1
n
µ = µ
Var[¯x] = Var[
1
n
T] =
1
n2
Var[T] =
2
n
µ
2](https://image.slidesharecdn.com/rev012-170415120540/85/slide-127-320.jpg)
![Var[¯x] =
2
n
=
0.0833
500
= 0.000166
E[¯x] = 0.5](https://image.slidesharecdn.com/rev012-170415120540/85/slide-128-320.jpg)
![Var[¯x]](https://image.slidesharecdn.com/rev012-170415120540/85/slide-129-320.jpg)
![2
=
Z 1
1
(x µ)2
f(x)dx
=
Z
I1
(x µ)2
f(x)dx +
Z
I2
(x µ)2
f(x)dx +
Z
I3
(x µ)2
f(x)dx
2
=
Z
I1
(x µ)2
f(x)dx +
Z
I3
(x µ)2
f(x)dx
=
Z
I1
2 2
f(x)dx +
Z
I3
2 2
f(x)dx
= 2 2
[P(x 2 I1) + P(x 2 I3)]
I1 = ( 1, µ ),
I2 = [µ , µ + ],
I3 = (µ + , 1)
= P(|x µ| > )
P(|x µ| > ) 5
1
2
)](https://image.slidesharecdn.com/rev012-170415120540/85/slide-132-320.jpg)

![g(x) = ext
E[ext
] =
Z 1
1
ext
f(x)dx
Mx(t) = E[ext
]
Mx(t)
My(t)
x
t = 0
y](https://image.slidesharecdn.com/rev012-170415120540/85/slide-147-320.jpg)
![g(x) = ext
ext
= 1 + xt +
t2
2!
x2
+ · · · +
tk
k!
xk
+ · · ·
Mx(t) = E[ext
]
= E[1 + xt +
t2
2!
x2
+ · · · +
tk
k!
xk
+ · · · ]
= 1 + tE[x] +
t2
2!
E[x2
] + · · · +
tk
k!
E[xk
] + · · ·
= 1 + xµ0
1 +
t2
2!
µ0
2 + · · · +
tk
k!
µ0
k + · · ·](https://image.slidesharecdn.com/rev012-170415120540/85/slide-148-320.jpg)
![Mx(t)
d
dtk
Mx(t) = E[xk
ext
]
t = 0
d
dtk
Mx(0) = E[xk
] = µ0
k](https://image.slidesharecdn.com/rev012-170415120540/85/slide-149-320.jpg)
![x ⇠ N(µ, )
Mx(t) = E[ext
] =
Z 1
1
ext 1
p
2⇡ 2
exp
✓
1
2
(x µ)2
2
◆
dx
z =
x µ
x = µ + z dx = dz](https://image.slidesharecdn.com/rev012-170415120540/85/slide-150-320.jpg)
![Mx(t) =
Z 1
1
e(µ+ z)t 1
p
2⇡ 2
exp
✓
1
2
z2
◆
dz
= eµt
Z 1
1
1
p
2⇡
exp
✓
tz
1
2
z2
◆
dz
= eµt
Z 1
1
1
p
2⇡
exp
✓
1
2
[z2
2 tz 2
t2
+ 2
t2
]
◆
dz
= eµt
Z 1
1
1
p
2⇡
e
2t2
2 exp
✓
1
2
(z t)2
◆
dz
= eµt
e
2t2
2
Z 1
1
1
p
2⇡
exp
✓
1
2
(z t)2
◆
dz
z t = w dz = dw
Mx(t) = eµt
e
2t2
2
Z 1
1
1
p
2⇡
exp
✓
w2
2
◆
dw = eµt+
2t2
2](https://image.slidesharecdn.com/rev012-170415120540/85/slide-151-320.jpg)
![Var[x] = E[x2
] (E[x])2
= (µ2
+ 2
) (µ)2
= 2
Var[x] = E[(x E[x])2
]
= E[x2
2E[x]x + E[x]2
)
= E[x2
] 2E[x]2
+ E[x]2
= E[x2
] E[x]2
t = 0
E[x] = M0
x(0) = (µ + 2
· 0)eµ·0+
2·02
2 = µ
E[x2
] = M00
x (0) =
⇣
eµ·0+
2·02
2
⌘
{(µ + 2
· 0)2
+ 2
} = µ2
+ 2](https://image.slidesharecdn.com/rev012-170415120540/85/slide-153-320.jpg)
![xi µ
p
n
xi µ
p
n
Mxi µ
p
n
(t) = E[e
xi µ
p
n
t
]
= 1 + 2 t2
2!n
+ µ3
t3
3!n3/2
+ · · · + µk
tk
k!nk/2
+ · · ·
= 1 +
2
t2
2n
+
n
2n
=
1
2n
n n ! 0 n ! 0
= 1 +
2
t2
+ n
2n](https://image.slidesharecdn.com/rev012-170415120540/85/slide-157-320.jpg)
![T0
=
x1 µ
p
n
+
x2 nµ
p
n
+ · · · +
xn µ
p
n
=
nX
i=1
xi µ
p
n
MT 0 (t) = MPn
i=1
⇣
xi µ
p
n
⌘(t) = E[e
Pn
i=1
⇣
xi µ
p
n
⌘
t
]
=
nY
i=0
E[e
⇣
xi µ
p
n
⌘
t
] =
✓
1 +
1
n
2
t2
+ n
2
◆n
er
⌘ lim
n!1
⇣
1 +
r
n
⌘n
r
r
= lim
n!1
⇣
1 +
r
n
⌘n](https://image.slidesharecdn.com/rev012-170415120540/85/slide-158-320.jpg)
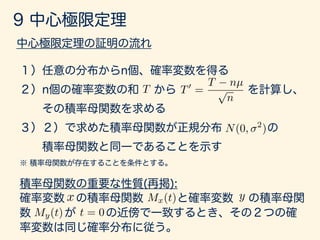
![n = 100000
sample_size = 1000
rvs_list = []
m_list = []
for i in range(n):
unif_rvs = st.uniform.rvs(4.5, size=sample_size) # 5
beta_rvs = st.beta.rvs(a=3, b=3, size=sample_size) # 0.5 β
gamma_rvs = st.gamma.rvs(a=3, size=sample_size) # 3
chi2_rvs = st.chi2.rvs(df=5, size=sample_size) #
exp_rvs = st.expon.rvs(loc=0, size=sample_size) # 1
rvs = np.array([unif_rvs, beta_rvs, gamma_rvs, chi2_rvs, exp_rvs]).flatten()
m_list.append(np.mean(rvs))
rvs_list.append(rvs)](https://image.slidesharecdn.com/rev012-170415120540/85/slide-160-320.jpg)
![#
n = 10000
sample_size = 1000
rvs_list = []
m_list = []
m_unif = st.uniform.rvs(4, 2, size=sample_size)
m_beta_a = st.uniform.rvs(4, 2, size=sample_size)
m_beta_b = st.uniform.rvs(4, 2, size=sample_size)
m_gamma = rd.randint(2,5,size=sample_size)
m_chi2_df = rd.randint(3,6,size=sample_size)
m_exp = st.uniform.rvs(4, 2, size=sample_size)
def gen_random_state():
return int(dt.now().timestamp() * 10**6) - 1492914610000000 + rd.randint(0, 1000000)
def create_rvs(n):
#rd.seed = int(dt.now().timestamp() * 10**6) - 1492914610000000 + rd.randint(0, 1000000)
print("[START]")
for _ in range(n):
unif_rvs = [st.uniform.rvs(m, size=1, random_state=gen_random_state()) for m in
m_unif] # 5
beta_rvs = [st.beta.rvs(a=a, b=b, size=1, random_state=gen_random_state()) for a, b
in zip(m_beta_a, m_beta_b)]# 0.5 β
gamma_rvs = [st.gamma.rvs(a=a, size=1, random_state=gen_random_state()) for a in
m_gamma] # 3
chi2_rvs = [st.chi2.rvs(df=d, size=1, random_state=gen_random_state()) for d in
m_chi2_df] #
exp_rvs = [st.expon.rvs(loc=l, size=1, random_state=gen_random_state()) for l in
m_exp] # 1
rvs = np.array([unif_rvs, beta_rvs, gamma_rvs, chi2_rvs, exp_rvs]).flatten()
l_mean.append(np.mean(rvs))
l_rvs.append(rvs)
print("[END]")](https://image.slidesharecdn.com/rev012-170415120540/85/slide-161-320.jpg)
![n_jobs = 20
n_each = int(n/n_jobs)
jobs = [Process(target=create_rvs, args=(n_each,)) for _ in range(n_jobs)]
manager = Manager()
l_rvs = manager.list(range(len(jobs)))
l_mean = manager.list(range(len(jobs)))
start_time = time.time()
for j in jobs:
j.start()
time.sleep(0.2)
for j in jobs:
j.join()
finish_time = time.time()
print(finish_time - start_time)
m_list = l_mean[n_jobs:]
rvs_list = np.array(l_rvs[n_jobs:])
print(rvs_list.shape)](https://image.slidesharecdn.com/rev012-170415120540/85/slide-162-320.jpg)
![E[(ˆ✓(X) ✓)2
]](https://image.slidesharecdn.com/rev012-170415120540/85/slide-167-320.jpg)
![E[(ˆ✓(X) ✓)2
]
= E[{(E[ˆ✓(X)] ✓) + (ˆ✓(X) E[ˆ✓(X)])}2
]
= E[(E[ˆ✓(X)] ✓)2
+ 2(E[ˆ✓(X)] ✓)(ˆ✓(X) E[ˆ✓(X)]) + (ˆ✓(X) E[ˆ✓(X)])2
]
= (E[ˆ✓(X)] ✓)2
+ Var[ˆ✓(X)]
E[ˆ✓(X)] ✓
E[(ˆ✓(X) ✓)2
] = Var[ˆ✓(X)]](https://image.slidesharecdn.com/rev012-170415120540/85/slide-168-320.jpg)
![E[¯x] =
1
n
E[T] = n ·
1
n
µ = µ
¯x
s2
=
1
n 1
nX
i=1
(xi ¯x)2](https://image.slidesharecdn.com/rev012-170415120540/85/slide-169-320.jpg)
![Var[ˆ✓(X)]
ˆ✓(X)](https://image.slidesharecdn.com/rev012-170415120540/85/slide-172-320.jpg)
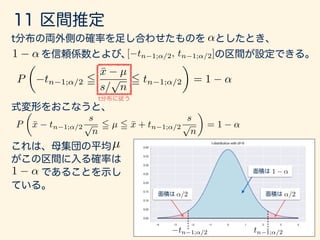
![P
✓
tn 1;↵/2 5
¯x µ
s/
p
n
5 tn 1;↵/2
◆
= 1 ↵
tn 1;↵/2 tn 1;↵/2
↵/2 ↵/2
1 ↵
1 ↵
1 ↵
P
✓
¯x tn 1;↵/2
s
p
n
5 µ 5 ¯x + tn 1;↵/2
s
p
n
◆
= 1 ↵
[ tn 1;↵/2, tn 1;↵/2]
µ
1 ↵](https://image.slidesharecdn.com/rev012-170415120540/85/slide-189-320.jpg)
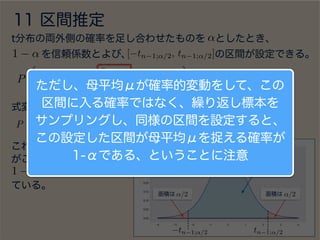
![P
✓
tn 1;↵/2 5
¯x µ
s/
p
n
5 tn 1;↵/2
◆
= 1 ↵
tn 1;↵/2 tn 1;↵/2
↵/2 ↵/2
1 ↵
1 ↵
1 ↵
P
✓
¯x tn 1;↵/2
s
p
n
5 µ 5 ¯x + tn 1;↵/2
s
p
n
◆
= 1 ↵
[ tn 1;↵/2, tn 1;↵/2]
µ
1 ↵](https://image.slidesharecdn.com/rev012-170415120540/85/slide-190-320.jpg)
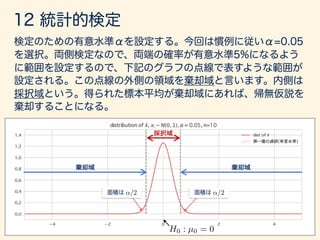
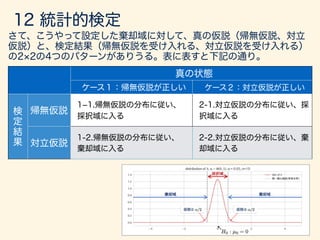
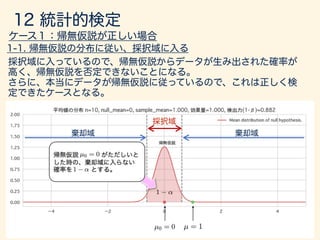
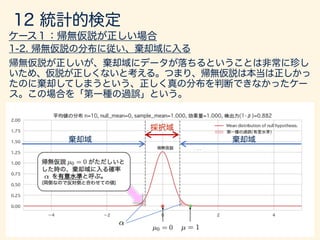

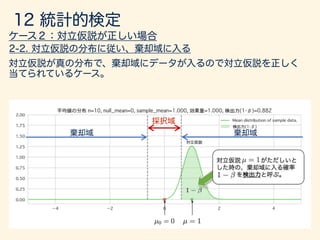
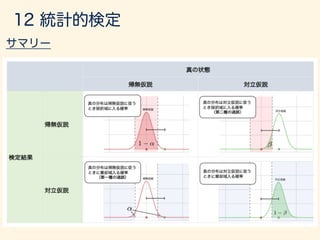
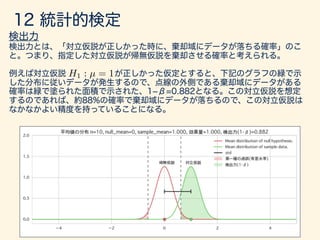
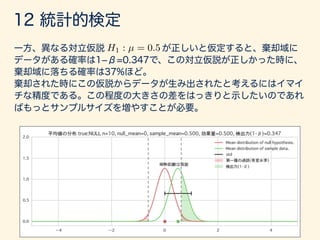


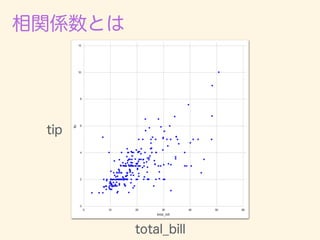
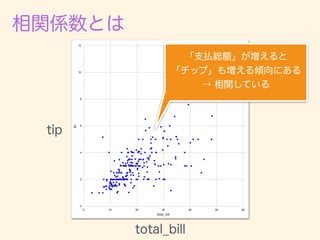
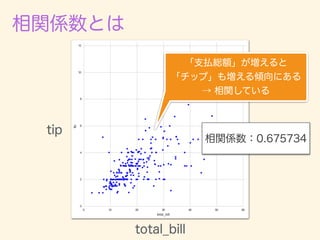
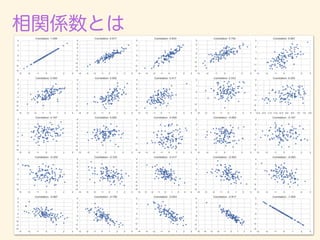


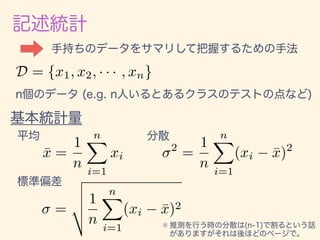
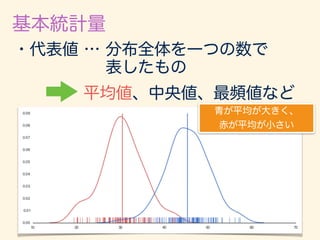
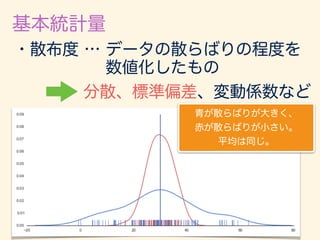
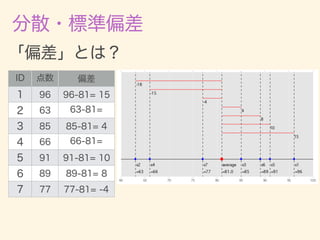
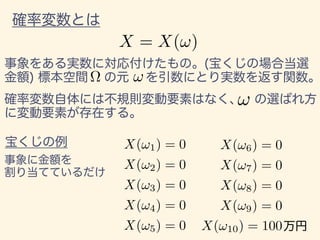
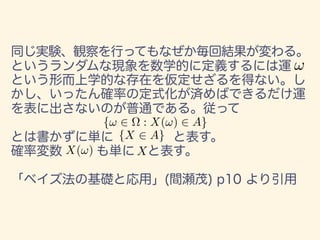
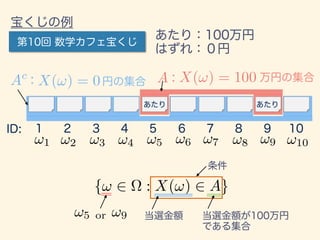
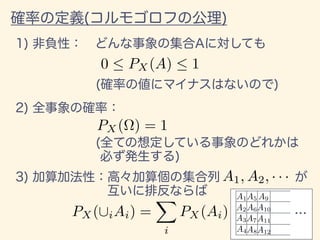
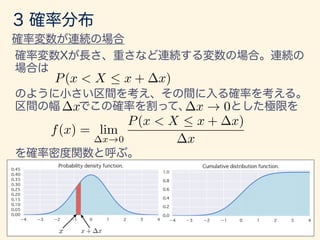
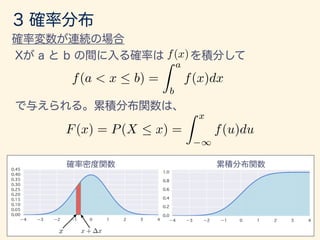
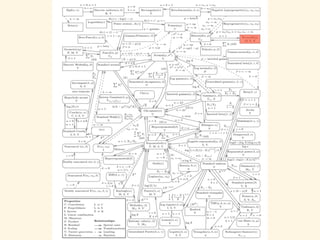
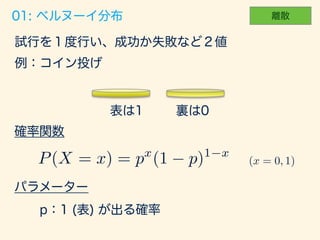
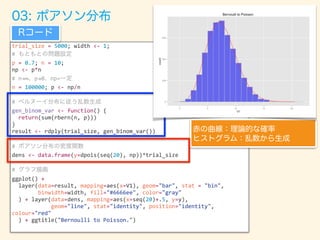
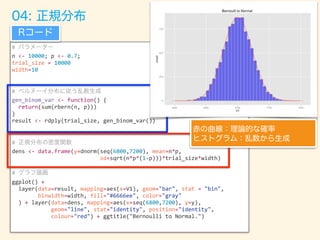
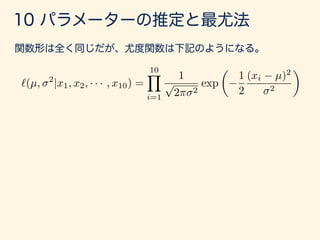
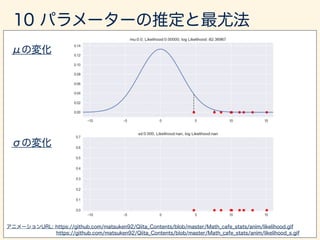
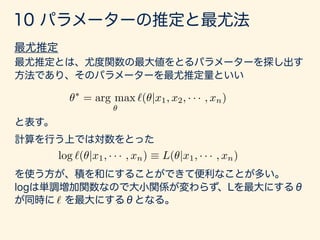
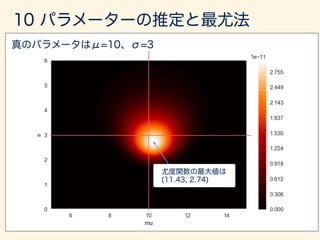
The document describes various probability distributions that can arise from combining Bernoulli random variables. It shows how a binomial distribution emerges from summing Bernoulli random variables, and how Poisson, normal, chi-squared, exponential, gamma, and inverse gamma distributions can approximate the binomial as the number of Bernoulli trials increases. Code examples in R are provided to simulate sampling from these distributions and compare the simulated distributions to their theoretical probability density functions.


![[DL輪読会]Set Transformer: A Framework for Attention-based Permutation-Invariant...](https://cdn.slidesharecdn.com/ss_thumbnails/20200221settransformer-200221020423-thumbnail.jpg?width=640&height=640&fit=bounds)