Download to read offline
![[Price for scheduled purchasing]
Arbitrarily made
Algorithm stocks Trading Strategies (Separate) 002700 Date
Period
Gap
(Indication /
stock)
Color
2021-07-19
3 months
Current stock price Evaluation
Stock price rise
probability score
Investment opinion Prospective purchase amount
2,660 W Mid 35.7 Normal 4,000,000 W
Suggested Purchase
Amount 1,611,722 W
Number of stocks
purchased 606
Indication price Range Buying / Selling Buying / Selling [Stocks]
High price 3,884 W 3,884 W~ ~ 3,397 W 46 % -741,395 W -191
High mid 3,397 W 3,397 W ~ 2,910 W 28 % -446,392 W -131
Mid 2,910 W 2,910 W ~ 2,423 W 9 % -151,389 W -52
Low mid 2,423 W 2,423 W ~ 1,936 W -9 % 143,613 W 59
low price 1,936 W 1,936 W ~ 0 W -27 % 438,616 W 227
2021.02.23 2021.03.24 2021.04.21 2021.05.21 2021.06.18 2021.07.16
35.0 42.9 32.0
Stock price rise
probability score
A Sector 50.0 48.1 51.8 47.6 49.6 41.5
35.7
B Sector 32.1 49.2 47.6 47.6 36.3 22.5
Total average 41.0 48.6 33.8
18 % -34 %
2021.03.24 2021.04.21 2021.05.21 2021.06.18 2021.07.16
Total of
increase rate
Total score
A Sector -4 % 7 % -9 % 4 % -19 %
-8 % 41.0
B Sector 35 % -211 % 67 % -31 % -61 %
Total average 16 % -44 % 3 %
-4% 7%
-9% 4%
-19%
35%
-211%
67%
-31%
-61%
16%
-44%
3%
18%
-34%
-250%
-200%
-150%
-100%
-50%
0%
50%
100%
2021.03.24 2021.04.21 2021.05.21 2021.06.18 2021.07.16
Increase rate of stock price rise
A sector
B sector
Total average
shinil
50 48
52
48 50
41
32
49
16
48
36
23
41
49
34 35
43
32
0
10
20
30
40
50
60
2021.02.23 2021.03.24 2021.04.21 2021.05.21 2021.06.18 2021.07.16
Stock price rise probability score
A sector
B sector
Total average](https://image.slidesharecdn.com/shinil002700algorithminvestmentreport-210719013304/75/shinil-002700-Algorithm-Investment-Report-2-2048.jpg)

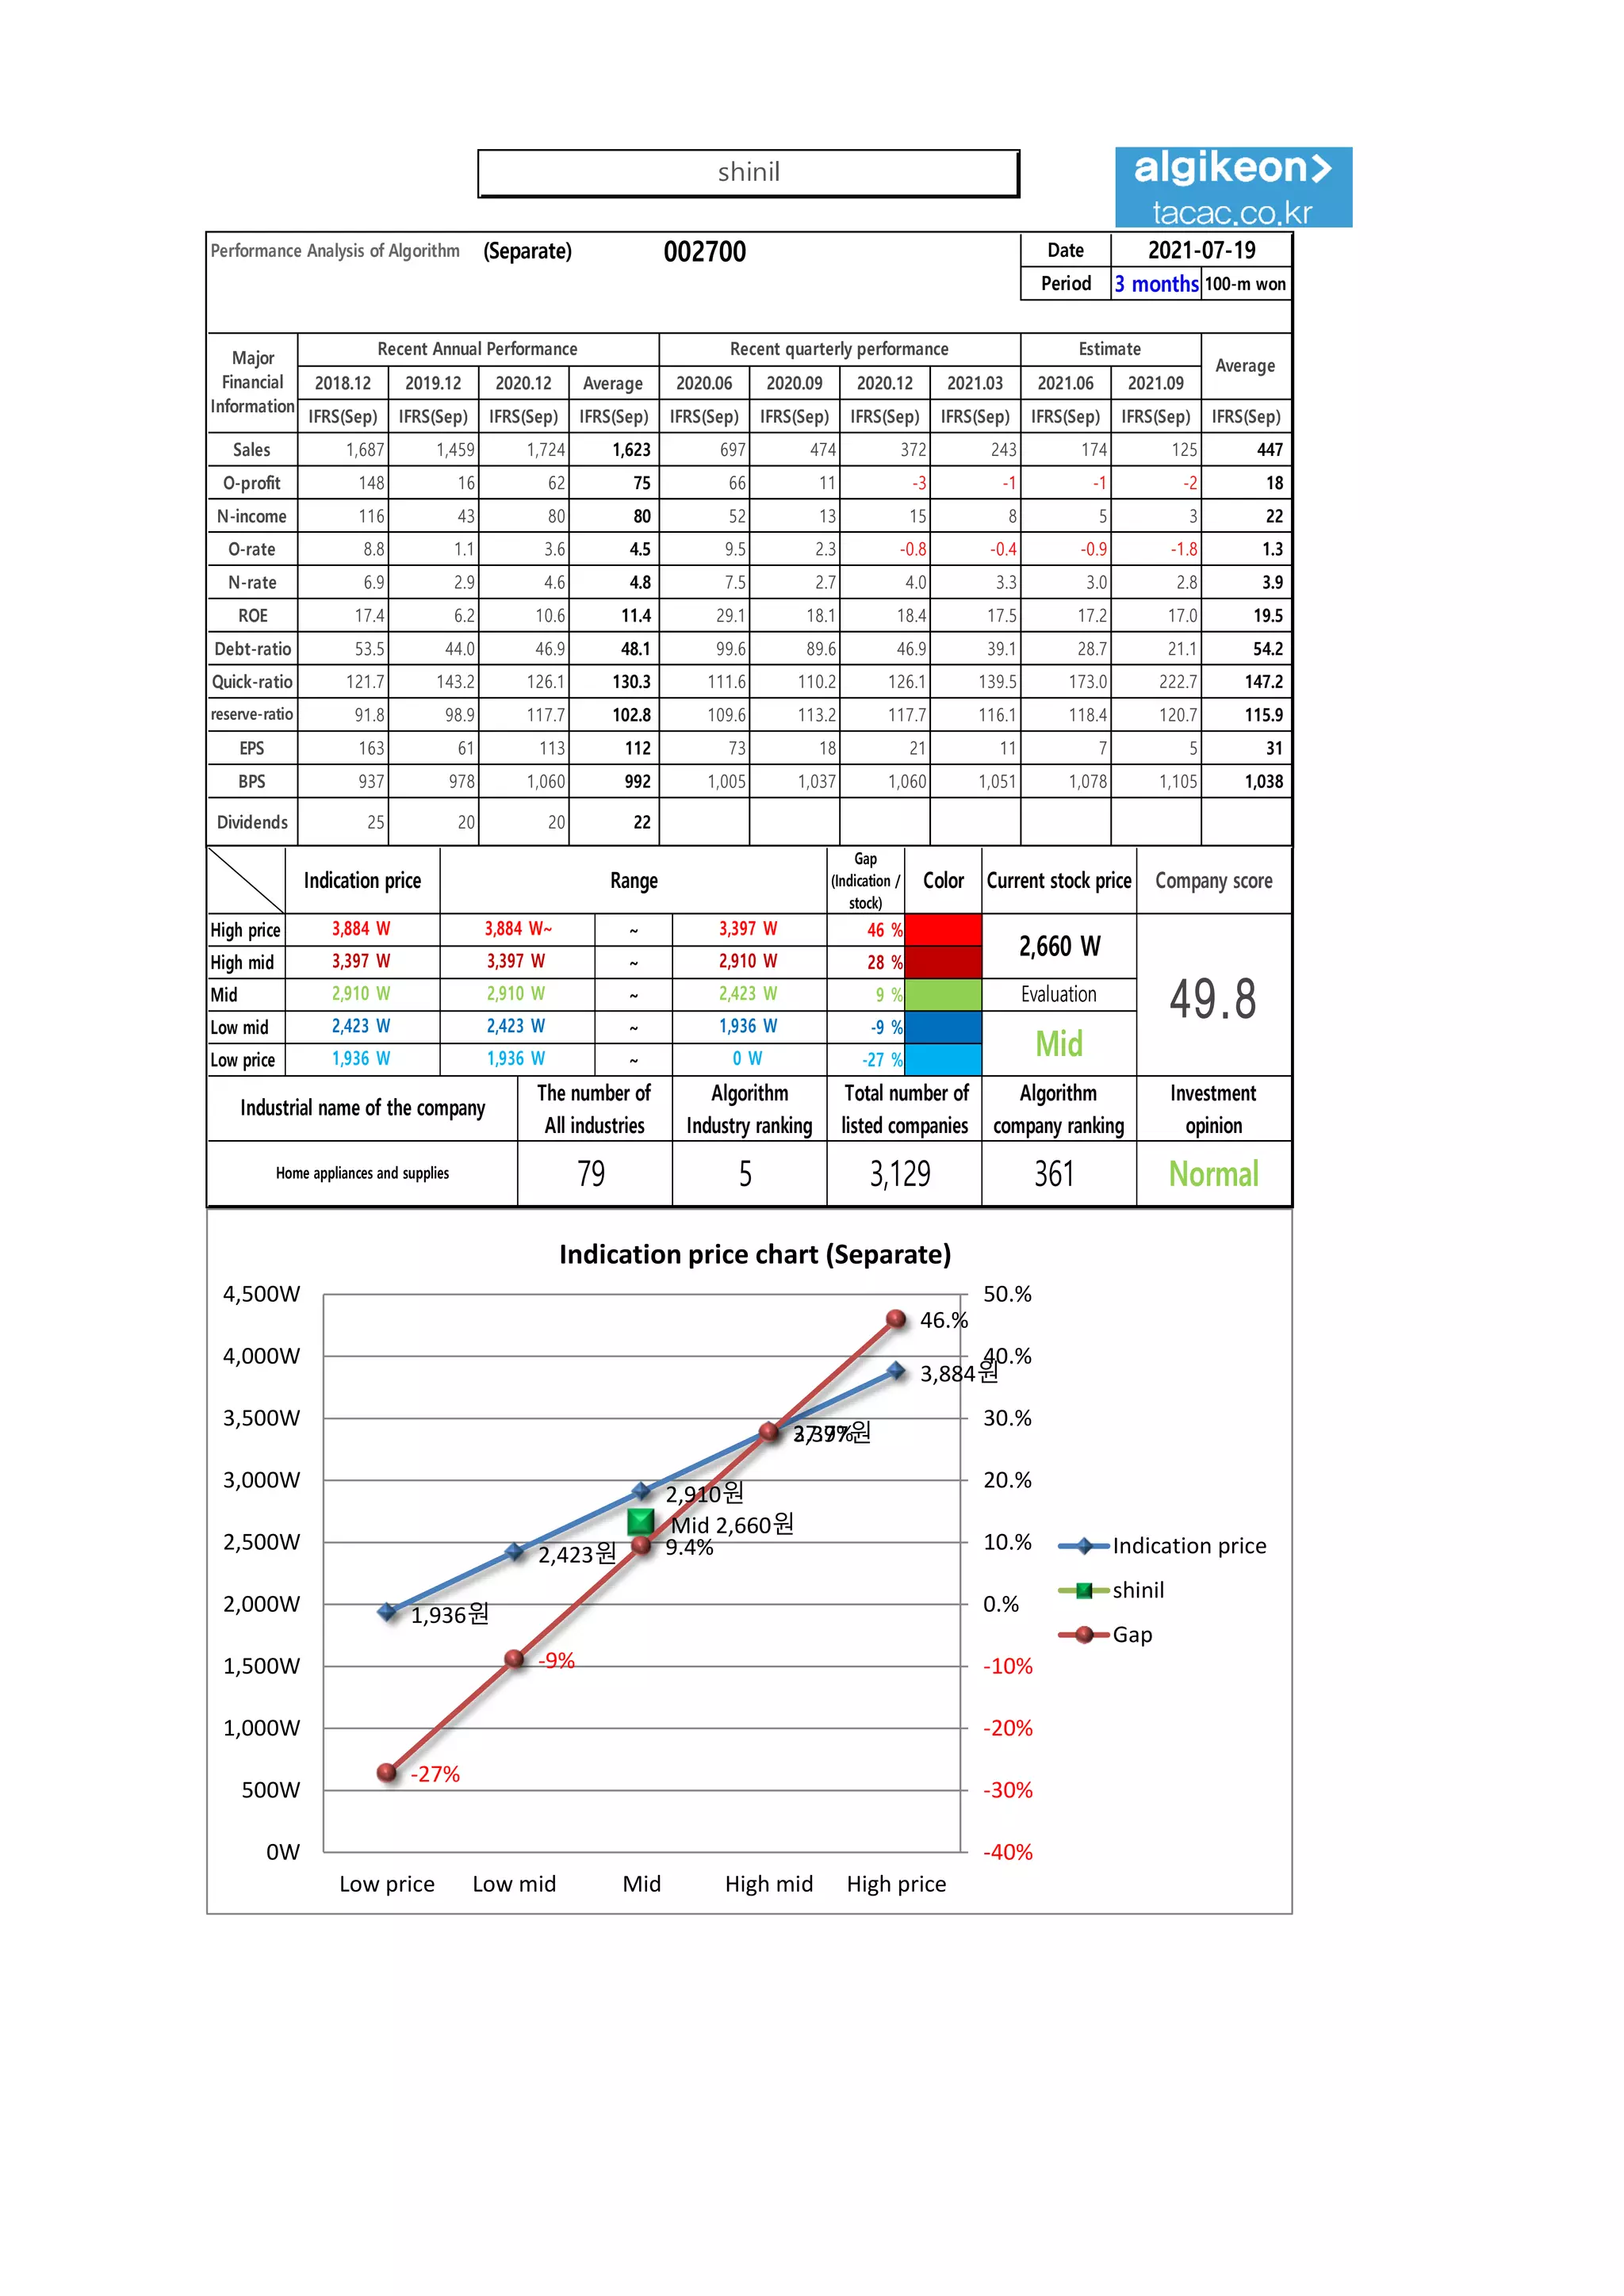
This document provides a performance analysis of an algorithm company over a 3 month period from 2018-2021. It includes sales, operating profit, net income, profitability ratios, debt ratios, liquidity ratios, earnings per share and book value per share on a quarterly and annual basis. It also shows the company's current stock price, indication price range, and analysis of the company's stock price rise probability score and investment opinion going forward.


![[쿠콘]coocon 294570 Algorithm Investment Report](https://cdn.slidesharecdn.com/ss_thumbnails/coocon294570algorithminvestmentreport-250926162409-bd6c1593-thumbnail.jpg?width=640&height=640&fit=bounds)


![[롯데웰푸드]lottewell food 280360 Algorithm Investment Report](https://cdn.slidesharecdn.com/ss_thumbnails/lottewellfood280360algorithminvestmentreport-251010014427-e0439c3a-thumbnail.jpg?width=640&height=640&fit=bounds)
![[동원산업]dongwon industries 006040 Algorithm Investment Report](https://cdn.slidesharecdn.com/ss_thumbnails/dongwonindustries006040algorithminvestmentreport-251003020532-5dd00f8a-thumbnail.jpg?width=640&height=640&fit=bounds)
![[동서]dongsuh 026960 Algorithm Investment Report](https://cdn.slidesharecdn.com/ss_thumbnails/dongsuh026960algorithminvestmentreport-251001020056-e986a251-thumbnail.jpg?width=640&height=640&fit=bounds)


![[웹케시]webcash 053580 Algorithm Investment Report](https://cdn.slidesharecdn.com/ss_thumbnails/webcash053580algorithminvestmentreport-250925003052-f31dd73c-thumbnail.jpg?width=640&height=640&fit=bounds)
![[휴림로봇]hyulimrobot 090710 Algorithm Investment Report](https://cdn.slidesharecdn.com/ss_thumbnails/hyulimrobot090710algorithminvestmentreport-250923234005-7edfe548-thumbnail.jpg?width=640&height=640&fit=bounds)


![[더즌]dozn 462860 Algorithm Investment Report](https://cdn.slidesharecdn.com/ss_thumbnails/dozn462860algorithminvestmentreport-250920161038-b31c0a65-thumbnail.jpg?width=640&height=640&fit=bounds)

![[헥토파이낸셜]hectofinancial 234340 Algorithm Investment Report](https://cdn.slidesharecdn.com/ss_thumbnails/hectofinancial234340algorithminvestmentreport-250917010057-0603ecf0-thumbnail.jpg?width=640&height=640&fit=bounds)
![[한국공항]Korea Airport Service 005430 Algorithm Investment Report](https://cdn.slidesharecdn.com/ss_thumbnails/koreaairportservice005430algorithminvestmentreport-250915064019-e6873549-thumbnail.jpg?width=640&height=640&fit=bounds)
![[대상]Daesang 001680 Algorithm Investment Report](https://cdn.slidesharecdn.com/ss_thumbnails/daesang001680algorithminvestmentreport-250915063303-81c41298-thumbnail.jpg?width=640&height=640&fit=bounds)
![[삼성중공업] Samsung Heavy Industries 010140 Algorithm Investment Report](https://cdn.slidesharecdn.com/ss_thumbnails/samsungheavyindustries010140algorithminvestmentreport-250904015122-fe022f35-thumbnail.jpg?width=640&height=640&fit=bounds)
![대상 001680 알고리즘 기업분석 보고서 [알고리즘 기업분석 컨설팅-알기컨]](https://cdn.slidesharecdn.com/ss_thumbnails/001680-250303132112-443c504a-thumbnail.jpg?width=640&height=640&fit=bounds)
![[삼성전자]samsung electronics 005930 Algorithm Investment Report](https://cdn.slidesharecdn.com/ss_thumbnails/samsungelectronics005930algorithminvestmentreport-250227014600-4fa86dc7-thumbnail.jpg?width=640&height=640&fit=bounds)
![[동서]dongsuh 026960 Algorithm Investment Report](https://cdn.slidesharecdn.com/ss_thumbnails/dongsuh026960algorithminvestmentreport-250226011658-61b0afaa-thumbnail.jpg?width=640&height=640&fit=bounds)
![동원fnb 049770 알고리즘 기업분석 보고서 [알고리즘 기업분석 컨설팅-알기컨]](https://cdn.slidesharecdn.com/ss_thumbnails/fnb049770-250224032312-db728faf-thumbnail.jpg?width=640&height=640&fit=bounds)
![[SFA반도체]SFA semicon 036540 Algorithm Investment Report](https://cdn.slidesharecdn.com/ss_thumbnails/sfasemicon036540algorithminvestmentreport-250219022804-aa8f2510-thumbnail.jpg?width=640&height=640&fit=bounds)