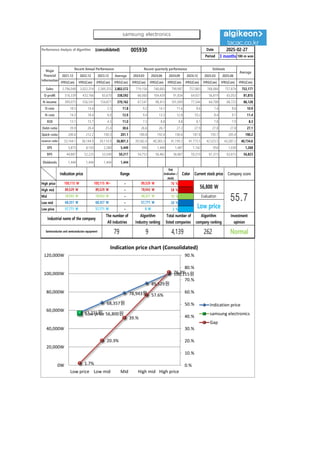
Performance Analysis ofAlgorithm (consolidated) 005930 Date
Period 3 months 100-m won
2021.12 2022.12 2023.12 Average 2024.03 2024.06 2024.09 2024.12 2025.03 2025.06
IFRS(Con) IFRS(Con) IFRS(Con) IFRS(Con) IFRS(Con) IFRS(Con) IFRS(Con) IFRS(Con) IFRS(Con) IFRS(Con) IFRS(Con)
Sales 2,796,048 3,022,314 2,589,355 2,802,572 719,156 740,683 790,987 757,883 768,066 757,874 752,177
O-profit 516,339 433,766 65,670 338,592 66,060 104,439 91,834 64,927 56,819 65,053 81,815
N-income 399,075 556,541 154,871 370,162 67,547 98,413 101,009 77,544 64,708 68,723 86,128
O-rate 18.5 14.4 2.5 11.8 9.2 14.1 11.6 8.6 7.4 8.6 10.9
N-rate 14.3 18.4 6.0 12.9 9.4 13.3 12.8 10.2 8.4 9.1 11.4
ROE 13.1 15.7 4.3 11.0 7.3 8.8 8.8 8.1 7.8 7.9 8.3
Debt-ratio 39.9 26.4 25.4 30.6 26.6 26.7 27.2 27.9 27.8 27.8 27.1
Quick-ratio 200.6 212.2 190.3 201.1 189.8 192.4 190.6 187.8 195.7 205.4 190.2
reserve-ratio 33,144.1 38,144.9 39,114.9 36,801.3 39,582.4 40,383.3 41,199.3 41,773.5 42,523.5 43,287.2 40,734.6
EPS 5,875 8,193 2,280 5,449 994 1,449 1,487 1,142 954 1,030 1,268
BPS 44,887 52,225 53,540 50,217 54,753 56,462 56,867 59,210 61,373 63,615 56,823
Dividends 1,444 1,444 1,444 1,444
2025-02-27
Major
Financial
Information
Recent Annual Performance Recent quarterly performance Estimate
Average
Gap
(Indication /
stock)
Color
High price ~ 76 %
High mid ~ 58 %
Mid ~ 39 %
Low mid ~ 20 %
Low price ~ 2 %
Indication price Range Current stock price Company score
89,529 W 89,529 W 78,943 W
78,943 W 78,943 W 68,357 W Evaluation
100,115 W 100,115 W~ 89,529 W
56,800 W
55.7
68,357 W 68,357 W 57,771 W
Low price
Normal
57,771 W 57,771 W 0 W
Industrial name of the company
The number of
All industries
Algorithm
Industry ranking
Total number of
listed companies
Algorithm
company ranking
Investment
opinion
Semiconductor and semiconductor equipment 79 9 4,139 262
57,771원
68,357원
78,943원
89,529원
100,115원
Low price 56,800원
1.7%
20.3%
39.%
57.6%
76.3%
0.%
10.%
20.%
30.%
40.%
50.%
60.%
70.%
80.%
90.%
0W
20,000W
40,000W
60,000W
80,000W
100,000W
120,000W
Low price Low mid Mid High mid High price
Indication price chart (Consolidated)
Indication price
samsung electronics
Gap
samsung electronics
2.
[Price for scheduledpurchasing]
Arbitrarily made
Algorithm stocks Trading Strategies (consolidated) 005930 Date
Period
Gap
(Indication /
stock)
Color
2025-02-27
3 months
Current stock price Evaluation
Stock price rise
probability score
Investment opinion Prospective purchase amount
56,800 W Low price 56.1 Normal 10,000,000 W
Suggested Purchase
Amount 5,273,419 W
Number of stocks
purchased 93
Indication price Range Buying / Selling Buying / Selling [Stocks]
High price 100,115 W 100,115 W~ ~ 89,529 W 76 % -4,021,411 W -40
High mid 89,529 W 89,529 W ~ 78,943 W 58 % -3,038,587 W -34
Mid 78,943 W 78,943 W ~ 68,357 W 39 % -2,055,762 W -26
Low mid 68,357 W 68,357 W ~ 57,771 W 20 % -1,072,938 W -16
low price 57,771 W 57,771 W ~ 0 W 2 % -90,114 W -2
Stock price rise
probability score
A Sector 45.2 44.6 48.8 46.1 46.9 51.7
56.1
B Sector 47.9 44.6 49.6 46.1 17.9 35.0
Total average
2024.09.25 2024.10.28 2024.11.25 2024.12.23 2025.01.23 2025.02.26
46.5 44.6 49.2 41.7 32.4 43.3
-29 % 25 %
2024.10.28 2024.11.25 2024.12.23 2025.01.23 2025.02.26
Total of
increase rate
Total score
A Sector -1 % 8 % -6 % 2 % 9 %
-3 % 46.3
B Sector -7 % 10 % -7 % -158 % 49 %
Total average -4 % 9 % -18 %
45 45
49 46 47
52
48
45
50
46
18
35
47 45
49
42
32
43
0
10
20
30
40
50
60
2024.09.25 2024.10.28 2024.11.25 2024.12.23 2025.01.23 2025.02.26
Stock price rise probability score
A sector
B sector
Total average
-1% 8%
-6% 2% 9%
-7%
10%
-7%
-158%
49%
-4%
9%
-18% -29%
25%
-200%
-150%
-100%
-50%
0%
50%
100%
2024.10.28 2024.11.25 2024.12.23 2025.01.23 2025.02.26
Increase rate of stock price rise
A sector
B sector
Total average
samsung electronics
3.
정보와
완전
정보
결
투자판단
있습니
위배
무단으
숙지하
Compliance notice
① Theinformation provided by The Algorithm Company Analysis
Consulting is obtained through reliable data and information and
The Algorithm Company Analysis Program (TACAP), but its
accuracy or completeness are not guaranteed. Furthermore, it may
change over time.Therefore, we are not legally responsible for the
results of the data provided by The Algorithm Company Analysis
Consulting because of information errors or omissions.
② The Algorithm Company Analysis Consulting and all the
information provided on it site are reference materials for
investment decisions and the final responsibility of investment is
up to users utilizing this information.
③ The Algorithm Company Analysis Consulting and its site do not
do anything that violates the related laws such as discretionary
transaction.
④ Users can not reallocate and recycle the information provided by
The Algorithm Company Analysis Consulting firm let alone the
information provided by its Site.
⑤ Be sure to know about application period of this algorithm
analysis report in order to improve its accuracy.
Tel : 070 - 4667 - 5009 Email : tacac@tacac.co.kr
Homepage : tacac.co.kr blog.naver.com/tacac
SERVICES
M&A, IPO, RECOVER, CORPORATE RESTRUCTURING, MANAGEMENT OF
TECHNOLOGY, BUSINESS STRATEGY, FAMILY BUSINESS
Request : http://tacac.co.kr/?page_id=1374
①
Consulting is o
The Algorithm
accuracy or com
change over tim
results of the d
Consulting bec
②
information pr
investment dec
up
③
do anything th
transaction.
④
The Algorithm
information pr
⑤
analysis report
![[Price for scheduled purchasing]
Arbitrarily made
Algorithm stocks Trading Strategies (consolidated) 005930 Date
Period
Gap
(Indication /
stock)
Color
2025-02-27
3 months
Current stock price Evaluation
Stock price rise
probability score
Investment opinion Prospective purchase amount
56,800 W Low price 56.1 Normal 10,000,000 W
Suggested Purchase
Amount 5,273,419 W
Number of stocks
purchased 93
Indication price Range Buying / Selling Buying / Selling [Stocks]
High price 100,115 W 100,115 W~ ~ 89,529 W 76 % -4,021,411 W -40
High mid 89,529 W 89,529 W ~ 78,943 W 58 % -3,038,587 W -34
Mid 78,943 W 78,943 W ~ 68,357 W 39 % -2,055,762 W -26
Low mid 68,357 W 68,357 W ~ 57,771 W 20 % -1,072,938 W -16
low price 57,771 W 57,771 W ~ 0 W 2 % -90,114 W -2
Stock price rise
probability score
A Sector 45.2 44.6 48.8 46.1 46.9 51.7
56.1
B Sector 47.9 44.6 49.6 46.1 17.9 35.0
Total average
2024.09.25 2024.10.28 2024.11.25 2024.12.23 2025.01.23 2025.02.26
46.5 44.6 49.2 41.7 32.4 43.3
-29 % 25 %
2024.10.28 2024.11.25 2024.12.23 2025.01.23 2025.02.26
Total of
increase rate
Total score
A Sector -1 % 8 % -6 % 2 % 9 %
-3 % 46.3
B Sector -7 % 10 % -7 % -158 % 49 %
Total average -4 % 9 % -18 %
45 45
49 46 47
52
48
45
50
46
18
35
47 45
49
42
32
43
0
10
20
30
40
50
60
2024.09.25 2024.10.28 2024.11.25 2024.12.23 2025.01.23 2025.02.26
Stock price rise probability score
A sector
B sector
Total average
-1% 8%
-6% 2% 9%
-7%
10%
-7%
-158%
49%
-4%
9%
-18% -29%
25%
-200%
-150%
-100%
-50%
0%
50%
100%
2024.10.28 2024.11.25 2024.12.23 2025.01.23 2025.02.26
Increase rate of stock price rise
A sector
B sector
Total average
samsung electronics](https://image.slidesharecdn.com/samsungelectronics005930algorithminvestmentreport-250227014600-4fa86dc7/85/samsung-electronics-005930-Algorithm-Investment-Report-2-320.jpg)


![[삼성중공업] Samsung Heavy Industries 010140 Algorithm Investment Report](https://cdn.slidesharecdn.com/ss_thumbnails/samsungheavyindustries010140algorithminvestmentreport-250904015122-fe022f35-thumbnail.jpg?width=640&height=640&fit=bounds)


![[SFA반도체]SFA semicon 036540 Algorithm Investment Report](https://cdn.slidesharecdn.com/ss_thumbnails/sfasemicon036540algorithminvestmentreport-250219022804-aa8f2510-thumbnail.jpg?width=640&height=640&fit=bounds)

![[ls머트리얼즈]LS Materials 417200 Algorithm Investment Report](https://cdn.slidesharecdn.com/ss_thumbnails/lsmaterials417200algorithminvestmentreport-260202182715-66072c7b-thumbnail.jpg?width=640&height=640&fit=bounds)


![[롯데웰푸드]lottewell food 280360 Algorithm Investment Report](https://cdn.slidesharecdn.com/ss_thumbnails/lottewellfood280360algorithminvestmentreport-251010014427-e0439c3a-thumbnail.jpg?width=640&height=640&fit=bounds)
![[동원산업]dongwon industries 006040 Algorithm Investment Report](https://cdn.slidesharecdn.com/ss_thumbnails/dongwonindustries006040algorithminvestmentreport-251003020532-5dd00f8a-thumbnail.jpg?width=640&height=640&fit=bounds)
![[동서]dongsuh 026960 Algorithm Investment Report](https://cdn.slidesharecdn.com/ss_thumbnails/dongsuh026960algorithminvestmentreport-251001020056-e986a251-thumbnail.jpg?width=640&height=640&fit=bounds)


![[쿠콘]coocon 294570 Algorithm Investment Report](https://cdn.slidesharecdn.com/ss_thumbnails/coocon294570algorithminvestmentreport-250926162409-bd6c1593-thumbnail.jpg?width=640&height=640&fit=bounds)
![[웹케시]webcash 053580 Algorithm Investment Report](https://cdn.slidesharecdn.com/ss_thumbnails/webcash053580algorithminvestmentreport-250925003052-f31dd73c-thumbnail.jpg?width=640&height=640&fit=bounds)
![[휴림로봇]hyulimrobot 090710 Algorithm Investment Report](https://cdn.slidesharecdn.com/ss_thumbnails/hyulimrobot090710algorithminvestmentreport-250923234005-7edfe548-thumbnail.jpg?width=640&height=640&fit=bounds)


![[더즌]dozn 462860 Algorithm Investment Report](https://cdn.slidesharecdn.com/ss_thumbnails/dozn462860algorithminvestmentreport-250920161038-b31c0a65-thumbnail.jpg?width=640&height=640&fit=bounds)

![[헥토파이낸셜]hectofinancial 234340 Algorithm Investment Report](https://cdn.slidesharecdn.com/ss_thumbnails/hectofinancial234340algorithminvestmentreport-250917010057-0603ecf0-thumbnail.jpg?width=640&height=640&fit=bounds)
![[한국공항]Korea Airport Service 005430 Algorithm Investment Report](https://cdn.slidesharecdn.com/ss_thumbnails/koreaairportservice005430algorithminvestmentreport-250915064019-e6873549-thumbnail.jpg?width=640&height=640&fit=bounds)
![[대상]Daesang 001680 Algorithm Investment Report](https://cdn.slidesharecdn.com/ss_thumbnails/daesang001680algorithminvestmentreport-250915063303-81c41298-thumbnail.jpg?width=640&height=640&fit=bounds)
![대상 001680 알고리즘 기업분석 보고서 [알고리즘 기업분석 컨설팅-알기컨]](https://cdn.slidesharecdn.com/ss_thumbnails/001680-250303132112-443c504a-thumbnail.jpg?width=640&height=640&fit=bounds)
![[동서]dongsuh 026960 Algorithm Investment Report](https://cdn.slidesharecdn.com/ss_thumbnails/dongsuh026960algorithminvestmentreport-250226011658-61b0afaa-thumbnail.jpg?width=640&height=640&fit=bounds)
![동원fnb 049770 알고리즘 기업분석 보고서 [알고리즘 기업분석 컨설팅-알기컨]](https://cdn.slidesharecdn.com/ss_thumbnails/fnb049770-250224032312-db728faf-thumbnail.jpg?width=640&height=640&fit=bounds)

