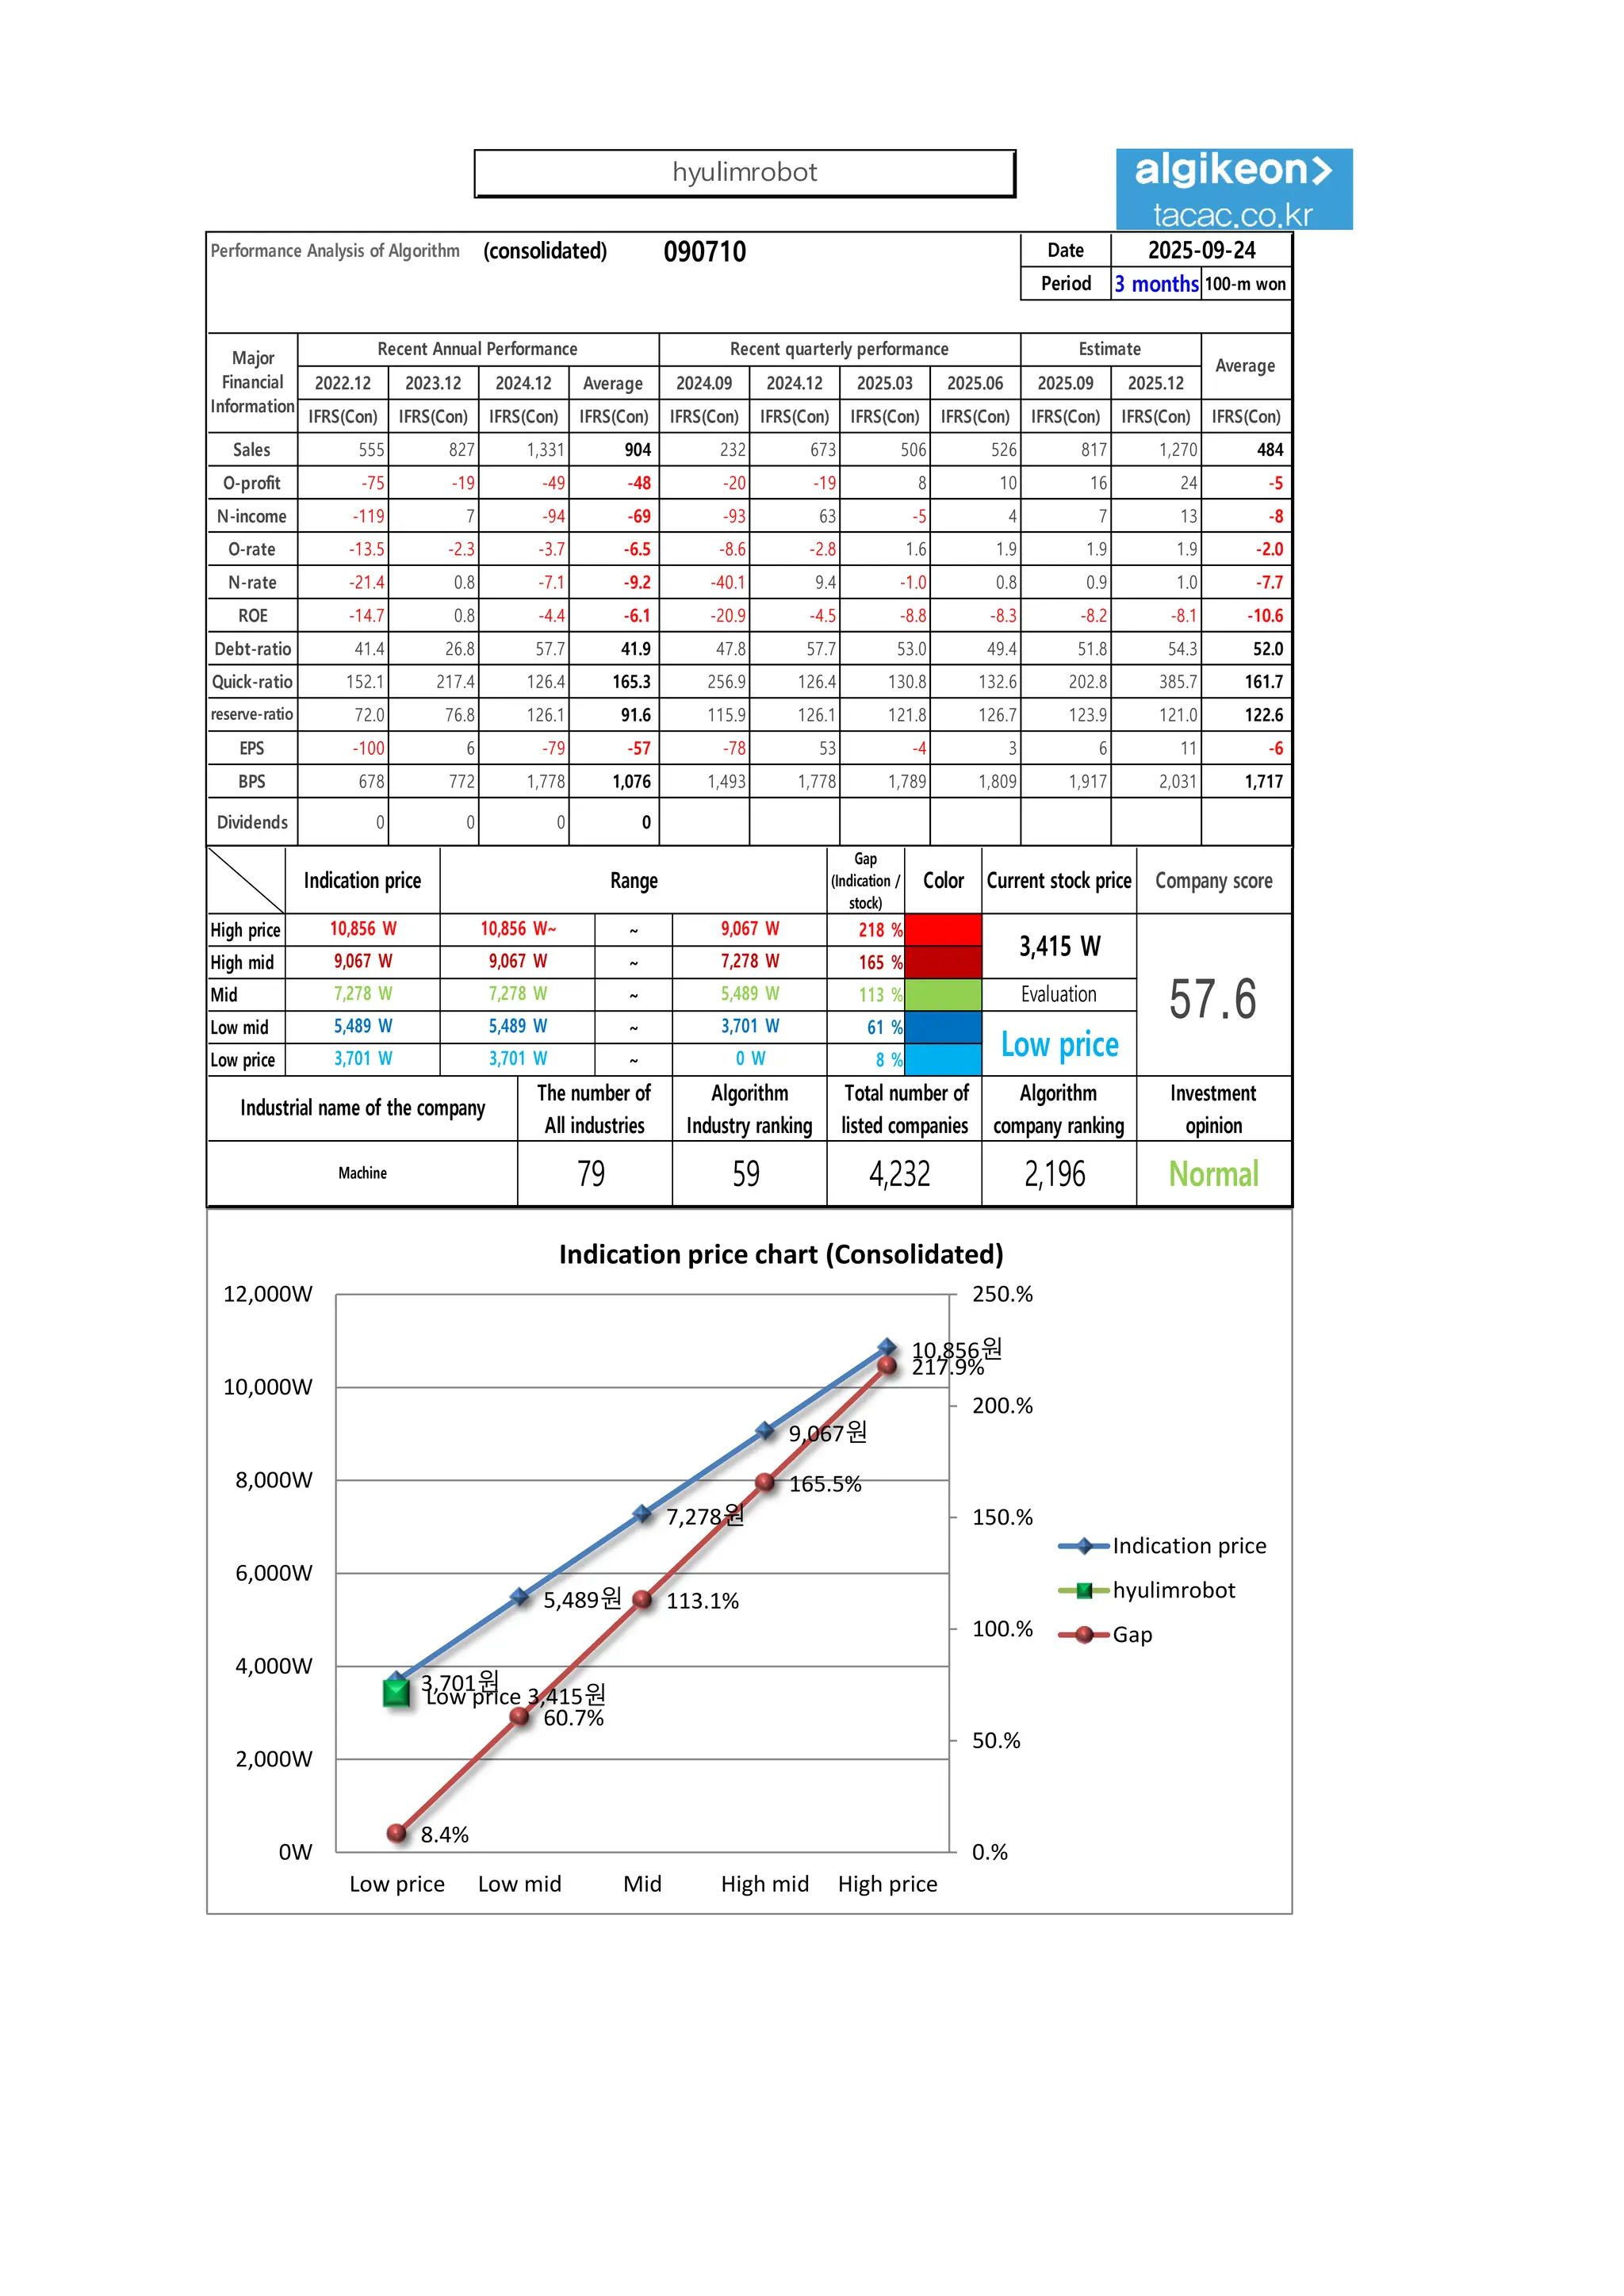
Performance Analysis ofAlgorithm (consolidated) 090710 Date
Period 3 months 100-m won
2022.12 2023.12 2024.12 Average 2024.09 2024.12 2025.03 2025.06 2025.09 2025.12
IFRS(Con) IFRS(Con) IFRS(Con) IFRS(Con) IFRS(Con) IFRS(Con) IFRS(Con) IFRS(Con) IFRS(Con) IFRS(Con) IFRS(Con)
Sales 555 827 1,331 904 232 673 506 526 817 1,270 484
O-profit -75 -19 -49 -48 -20 -19 8 10 16 24 -5
N-income -119 7 -94 -69 -93 63 -5 4 7 13 -8
O-rate -13.5 -2.3 -3.7 -6.5 -8.6 -2.8 1.6 1.9 1.9 1.9 -2.0
N-rate -21.4 0.8 -7.1 -9.2 -40.1 9.4 -1.0 0.8 0.9 1.0 -7.7
ROE -14.7 0.8 -4.4 -6.1 -20.9 -4.5 -8.8 -8.3 -8.2 -8.1 -10.6
Debt-ratio 41.4 26.8 57.7 41.9 47.8 57.7 53.0 49.4 51.8 54.3 52.0
Quick-ratio 152.1 217.4 126.4 165.3 256.9 126.4 130.8 132.6 202.8 385.7 161.7
reserve-ratio 72.0 76.8 126.1 91.6 115.9 126.1 121.8 126.7 123.9 121.0 122.6
EPS -100 6 -79 -57 -78 53 -4 3 6 11 -6
BPS 678 772 1,778 1,076 1,493 1,778 1,789 1,809 1,917 2,031 1,717
Dividends 0 0 0 0
2025-09-24
Major
Financial
Information
Recent Annual Performance Recent quarterly performance Estimate
Average
Gap
(Indication /
stock)
Color
High price ~ 218 %
High mid ~ 165 %
Mid ~ 113 %
Low mid ~ 61 %
Low price ~ 8 %
Indication price Range Current stock price Company score
9,067 W 9,067 W 7,278 W
7,278 W 7,278 W 5,489 W Evaluation
10,856 W 10,856 W~ 9,067 W
3,415 W
57.6
5,489 W 5,489 W 3,701 W
Low price
Normal
3,701 W 3,701 W 0 W
Industrial name of the company
The number of
All industries
Algorithm
Industry ranking
Total number of
listed companies
Algorithm
company ranking
Investment
opinion
Machine 79 59 4,232 2,196
3,701원
5,489원
7,278원
9,067원
10,856원
Low price 3,415원
8.4%
60.7%
113.1%
165.5%
217.9%
0.%
50.%
100.%
150.%
200.%
250.%
0W
2,000W
4,000W
6,000W
8,000W
10,000W
12,000W
Low price Low mid Mid High mid High price
Indication price chart (Consolidated)
Indication price
hyulimrobot
Gap
hyulimrobot
2.
[Price for scheduledpurchasing]
Arbitrarily made
Algorithm stocks Trading Strategies (consolidated) 090710 Date
Period
Gap
(Indication /
stock)
Color
2025-09-24
3 months
Current stock price Evaluation
Stock price rise
probability score
Investment opinion Prospective purchase amount
3,415 W Low price 38.1 Normal 10,000,000 W
Suggested Purchase
Amount 3,722,213 W
Number of stocks
purchased 1,090
Indication price Range Buying / Selling Buying / Selling [Stocks]
High price 10,856 W 10,856 W~ ~ 9,067 W 218 % -8,109,951 W All selling
High mid 9,067 W 9,067 W ~ 7,278 W 165 % -6,160,259 W All selling
Mid 7,278 W 7,278 W ~ 5,489 W 113 % -4,210,567 W All selling
Low mid 5,489 W 5,489 W ~ 3,701 W 61 % -2,260,875 W -412
low price 3,701 W 3,701 W ~ 0 W 8 % -311,184 W -84
Stock price rise
probability score
A Sector 49.6 54.3 55.4 46.0 49.3 48.0
38.1
B Sector 21.7 40.4 40.8 46.0 23.8 12.5
Total average
2025.04.28 2025.05.29 2025.06.30 2025.07.28 2025.08.26 2025.09.23
35.6 47.4 48.1 35.0 36.5 30.2
4 % -21 %
2025.05.29 2025.06.30 2025.07.28 2025.08.26 2025.09.23
Total of
increase rate
Total score
A Sector 9 % 2 % -21 % 7 % -3 %
-6 % 43.0
B Sector 46 % 1 % 11 % -94 % -90 %
Total average 25 % 2 % -38 %
50
54 55
46
49 48
22
40 41
46
24
13
36
47 48
35 37
30
0
10
20
30
40
50
60
2025.04.28 2025.05.29 2025.06.30 2025.07.28 2025.08.26 2025.09.23
Stock price rise probability score
A sector
B sector
Total average
9% 2%
-21%
7%
-3%
46%
1%
11%
-94% -90%
25%
2%
-38%
4%
-21%
-120%
-100%
-80%
-60%
-40%
-20%
0%
20%
40%
60%
2025.05.29 2025.06.30 2025.07.28 2025.08.26 2025.09.23
Increase rate of stock price rise
A sector
B sector
Total average
hyulimrobot
3.
정보와
완전
정보
결
투자판단
있습니
위배
무단으
숙지하
Compliance notice
① Theinformation provided by The Algorithm Company Analysis
Consulting is obtained through reliable data and information and
The Algorithm Company Analysis Program (TACAP), but its
accuracy or completeness are not guaranteed. Furthermore, it may
change over time.Therefore, we are not legally responsible for the
results of the data provided by The Algorithm Company Analysis
Consulting because of information errors or omissions.
② The Algorithm Company Analysis Consulting and all the
information provided on it site are reference materials for
investment decisions and the final responsibility of investment is
up to users utilizing this information.
③ The Algorithm Company Analysis Consulting and its site do not
do anything that violates the related laws such as discretionary
transaction.
④ Users can not reallocate and recycle the information provided by
The Algorithm Company Analysis Consulting firm let alone the
information provided by its Site.
⑤ Be sure to know about application period of this algorithm
analysis report in order to improve its accuracy.
Tel : 070 - 4667 - 5009 Email : tacac@tacac.co.kr
Homepage : tacac.co.kr blog.naver.com/tacac
SERVICES
M&A, IPO, RECOVER, CORPORATE RESTRUCTURING, MANAGEMENT OF
TECHNOLOGY, BUSINESS STRATEGY, FAMILY BUSINESS
Request : http://tacac.co.kr/?page_id=1374
①
Consulting is o
The Algorithm
accuracy or com
change over tim
results of the d
Consulting bec
②
information pr
investment dec
up
③
do anything th
transaction.
④
The Algorithm
information pr
⑤
analysis report

![[Price for scheduled purchasing]
Arbitrarily made
Algorithm stocks Trading Strategies (consolidated) 090710 Date
Period
Gap
(Indication /
stock)
Color
2025-09-24
3 months
Current stock price Evaluation
Stock price rise
probability score
Investment opinion Prospective purchase amount
3,415 W Low price 38.1 Normal 10,000,000 W
Suggested Purchase
Amount 3,722,213 W
Number of stocks
purchased 1,090
Indication price Range Buying / Selling Buying / Selling [Stocks]
High price 10,856 W 10,856 W~ ~ 9,067 W 218 % -8,109,951 W All selling
High mid 9,067 W 9,067 W ~ 7,278 W 165 % -6,160,259 W All selling
Mid 7,278 W 7,278 W ~ 5,489 W 113 % -4,210,567 W All selling
Low mid 5,489 W 5,489 W ~ 3,701 W 61 % -2,260,875 W -412
low price 3,701 W 3,701 W ~ 0 W 8 % -311,184 W -84
Stock price rise
probability score
A Sector 49.6 54.3 55.4 46.0 49.3 48.0
38.1
B Sector 21.7 40.4 40.8 46.0 23.8 12.5
Total average
2025.04.28 2025.05.29 2025.06.30 2025.07.28 2025.08.26 2025.09.23
35.6 47.4 48.1 35.0 36.5 30.2
4 % -21 %
2025.05.29 2025.06.30 2025.07.28 2025.08.26 2025.09.23
Total of
increase rate
Total score
A Sector 9 % 2 % -21 % 7 % -3 %
-6 % 43.0
B Sector 46 % 1 % 11 % -94 % -90 %
Total average 25 % 2 % -38 %
50
54 55
46
49 48
22
40 41
46
24
13
36
47 48
35 37
30
0
10
20
30
40
50
60
2025.04.28 2025.05.29 2025.06.30 2025.07.28 2025.08.26 2025.09.23
Stock price rise probability score
A sector
B sector
Total average
9% 2%
-21%
7%
-3%
46%
1%
11%
-94% -90%
25%
2%
-38%
4%
-21%
-120%
-100%
-80%
-60%
-40%
-20%
0%
20%
40%
60%
2025.05.29 2025.06.30 2025.07.28 2025.08.26 2025.09.23
Increase rate of stock price rise
A sector
B sector
Total average
hyulimrobot](https://image.slidesharecdn.com/hyulimrobot090710algorithminvestmentreport-250923234005-7edfe548/85/hyulimrobot-090710-Algorithm-Investment-Report-2-320.jpg)


![[동서]dongsuh 026960 Algorithm Investment Report](https://cdn.slidesharecdn.com/ss_thumbnails/dongsuh026960algorithminvestmentreport-251001020056-e986a251-thumbnail.jpg?width=640&height=640&fit=bounds)


![[헥토파이낸셜]hectofinancial 234340 Algorithm Investment Report](https://cdn.slidesharecdn.com/ss_thumbnails/hectofinancial234340algorithminvestmentreport-250917010057-0603ecf0-thumbnail.jpg?width=640&height=640&fit=bounds)
![[더즌]dozn 462860 Algorithm Investment Report](https://cdn.slidesharecdn.com/ss_thumbnails/dozn462860algorithminvestmentreport-250920161038-b31c0a65-thumbnail.jpg?width=640&height=640&fit=bounds)


![[SFA반도체]SFA semicon 036540 Algorithm Investment Report](https://cdn.slidesharecdn.com/ss_thumbnails/sfasemicon036540algorithminvestmentreport-250219022804-aa8f2510-thumbnail.jpg?width=640&height=640&fit=bounds)


![[유일로보틱스]yuilrobotics 388720 Algorithm Investment Report](https://cdn.slidesharecdn.com/ss_thumbnails/yuilrobotics388720algorithminvestmentreport-250206125914-6cb090bf-thumbnail.jpg?width=640&height=640&fit=bounds)


![[ls머트리얼즈]LS Materials 417200 Algorithm Investment Report](https://cdn.slidesharecdn.com/ss_thumbnails/lsmaterials417200algorithminvestmentreport-260202182715-66072c7b-thumbnail.jpg?width=640&height=640&fit=bounds)
![[롯데웰푸드]lottewell food 280360 Algorithm Investment Report](https://cdn.slidesharecdn.com/ss_thumbnails/lottewellfood280360algorithminvestmentreport-251010014427-e0439c3a-thumbnail.jpg?width=640&height=640&fit=bounds)
![[동원산업]dongwon industries 006040 Algorithm Investment Report](https://cdn.slidesharecdn.com/ss_thumbnails/dongwonindustries006040algorithminvestmentreport-251003020532-5dd00f8a-thumbnail.jpg?width=640&height=640&fit=bounds)

![[쿠콘]coocon 294570 Algorithm Investment Report](https://cdn.slidesharecdn.com/ss_thumbnails/coocon294570algorithminvestmentreport-250926162409-bd6c1593-thumbnail.jpg?width=640&height=640&fit=bounds)
![[웹케시]webcash 053580 Algorithm Investment Report](https://cdn.slidesharecdn.com/ss_thumbnails/webcash053580algorithminvestmentreport-250925003052-f31dd73c-thumbnail.jpg?width=640&height=640&fit=bounds)


![[한국공항]Korea Airport Service 005430 Algorithm Investment Report](https://cdn.slidesharecdn.com/ss_thumbnails/koreaairportservice005430algorithminvestmentreport-250915064019-e6873549-thumbnail.jpg?width=640&height=640&fit=bounds)
![[대상]Daesang 001680 Algorithm Investment Report](https://cdn.slidesharecdn.com/ss_thumbnails/daesang001680algorithminvestmentreport-250915063303-81c41298-thumbnail.jpg?width=640&height=640&fit=bounds)
![[삼성중공업] Samsung Heavy Industries 010140 Algorithm Investment Report](https://cdn.slidesharecdn.com/ss_thumbnails/samsungheavyindustries010140algorithminvestmentreport-250904015122-fe022f35-thumbnail.jpg?width=640&height=640&fit=bounds)
![대상 001680 알고리즘 기업분석 보고서 [알고리즘 기업분석 컨설팅-알기컨]](https://cdn.slidesharecdn.com/ss_thumbnails/001680-250303132112-443c504a-thumbnail.jpg?width=640&height=640&fit=bounds)
![[삼성전자]samsung electronics 005930 Algorithm Investment Report](https://cdn.slidesharecdn.com/ss_thumbnails/samsungelectronics005930algorithminvestmentreport-250227014600-4fa86dc7-thumbnail.jpg?width=640&height=640&fit=bounds)
![[동서]dongsuh 026960 Algorithm Investment Report](https://cdn.slidesharecdn.com/ss_thumbnails/dongsuh026960algorithminvestmentreport-250226011658-61b0afaa-thumbnail.jpg?width=640&height=640&fit=bounds)
![동원fnb 049770 알고리즘 기업분석 보고서 [알고리즘 기업분석 컨설팅-알기컨]](https://cdn.slidesharecdn.com/ss_thumbnails/fnb049770-250224032312-db728faf-thumbnail.jpg?width=640&height=640&fit=bounds)

![한국공항 005430 알고리즘 기업분석 보고서 [알고리즘 기업분석 컨설팅-알기컨]](https://cdn.slidesharecdn.com/ss_thumbnails/005430-250209061002-777e1746-thumbnail.jpg?width=640&height=640&fit=bounds)
![GRT 900290 알고리즘 기업분석 보고서 [알고리즘 기업분석 컨설팅-알기컨]](https://cdn.slidesharecdn.com/ss_thumbnails/grt900290-250203034703-9c3a9996-thumbnail.jpg?width=640&height=640&fit=bounds)
![[하나마이크론] HANA Micron 067310 Algorithm Investment Report](https://cdn.slidesharecdn.com/ss_thumbnails/hanamicron067310algorithminvestmentreport-250125031013-9231c76f-thumbnail.jpg?width=640&height=640&fit=bounds)
![버진(virgin)을 삼킨 알기컨[미완성폐기작].pdf-알고리즘기업분석컨설팅](https://cdn.slidesharecdn.com/ss_thumbnails/virgin-250119160621-2ff91f82-thumbnail.jpg?width=640&height=640&fit=bounds)


