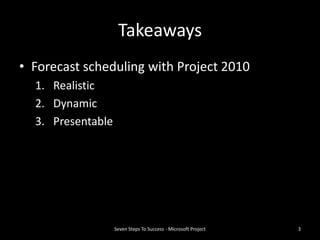
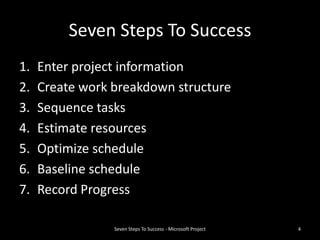
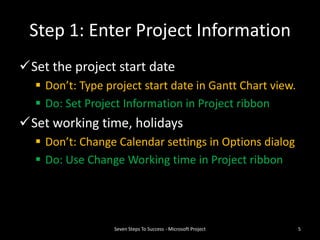
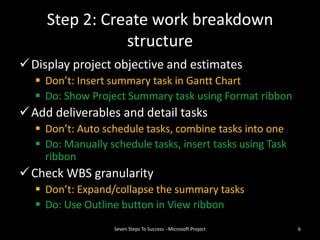
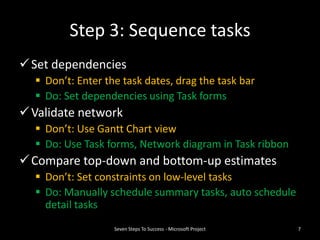
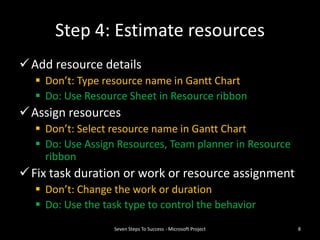
Project 2013 - 4 Simple & Practical Steps to Mastering Reporting Basics in un...DeltaBahn
Discover the efficient reporting possibilities of Project 2013 and explore the inner workings of tables and views in this last part of our Project 2013 basics series.
The whole blog post:
http://deltabahn.com/project-2013-microsoft-project-for-professionals-4-simple-practical-steps-to-mastering-reporting-basics-in-under-20-minutes/
Microsoft Project for Professionals - 5 Simple & Practical Steps to Mastering...DeltaBahn
This series of posts is a guide master Microsoft Project 2013 and increase productivity for overall Project Management.
The slides contain only the steps to follow allow and getting started with task management.
View the whole blog post with explanations:
http://deltabahn.com/project-2013-microsoft-project-for-professionals-5-simple-and-practical-steps-to-mastering-task-basics-in-under-30-minutes/
Project 2013: 3 Simple & Practical Steps to Resource Basics in under 20 MinutesDeltaBahn
Get resource assignments in Project 2013 right from the start. Study and work through this guide to learn about work resources, calendars and task types.
Microsoft Project for Professionals - 5 Simple & Practical Steps to Mastering...DeltaBahn
Learn how to use summary, milestones and recurring tasks, how to apply lag, lead and elapsed time in tasks and determine the critical path in this second part of our practical guide to Project 2013.
View the whole blog post with explanations:
http://deltabahn.com/project-2013-microsoft-project-for-professionals-5-simple-practical-steps-to-mastering-task-context-in-under-30-minutes/
These slides attempt to explain a rather complicated part of MS Project: setting up calendars, understanding how 'schedule options' influence duration, how to set up non-working days other than weekends using the Exceptions tab, etc.
I HAVE ATTACHED A PPT CONSIST OF VARIOUS COMMANDS OF MICROSOFT PROJECT.
I HAVE INCLUDED INTRODUCTION TO MACROS, WHICH ARE BEING USED IN NORMAL CONSTRUCTION INDUSTRY.
I HOPE YOU LIKE IT. REVIEWS & SUGGESTIONS ARE MOST WELCOME.
Microsoft Project (MSP, MSOP or WinProj) is a project management software program, developed and sold by Microsoft, which is designed to assist a project manager in developing a plan, assigning resources to tasks, tracking progress, managing the budget, and analyzing workloads.
Learn more about:
» Task navigation Tips and Tricks
» Building the Project Calendar
» Understanding the 4 types of Relationships in Project
» Master Projects and Sub Projects
Microsoft project provides Project management tools to manage projects. MS Project training allows a Project Manager to follow the different phases, activities and tasks in a project.
MPUG Webinar - Creating a Portfolio KPI Report in Project OnlineRaphael Santos
Being able to report accurate data, providing real-time information about the health of the entire portfolio of projects, is one of the most wanted features Executives and PMO members are looking for when they consider acquiring a PPM tool such as Microsoft Project Online.
It is key for any organization that deeply depends on projects to run their business to understand and evaluate the performance of their portfolio in an easy and quickly way, so they can take strategic decisions based on live data.
In this webinar presentation, Raphael Santos will demonstrate all the steps required to build a KPI report with data coming from Project Online, so you can rock your next project status meeting.
Homework 8.docx
Homework 8 (50 Points)
Assignment:
Write your answers to the following questions in Chart & Diagram Format. See the book’s examples on page 237-238, 239, and 240.Complete the following numbered problem from our textbook, “Strategies for Creative Problem Solving”: 9.7 (on page 247). You will need to prepare a Gantt chart, a Deployment chart, & a Critical Path diagram using Word or Excel.
Formatting:
- Use black text only.
- Text size needs to be 12 point size.
- Margins on the document should be 1’’ on all sides.
- The following name block should appear in the upper right of your document:
Your Name
TECH 331 –Technology Problem Analysis II
November 24, 2013
- Title of your document is “Homework 8.”
- Please spell check and proofread your work.
- Please add page numbers to your document.
Content:
Stating the Question before Answering It: While some assignments require that you state the question before your answer, inthis class it is not required to do this.
TECH 331 - HW8.pdf
PLANNING
solution. We can use a variety of techniques-the Gantt and deployment charts and
strategies for budgeting both personnel and money-to arrive at an efficient and
effective allocation. For individuals, proper time allocation and scheduling are
important for success. High-functioning executives and students alike use detailed
planners and calendars to keep track of important appointments and commitments.
Gantt Charts
One of the most popular ways to allocate specific blocks of time to the various tasks
in a project is a Gantt chart. A Gantt chart is a bar graph that indicates when a
specific task is to begin and how long it will take to complete that task.
As an example, suppose we have a time constraint of one year to solve the
problem and we need to allocate time to each of the five building blocks of
the problem-solving process. January, February, and March will be spent working
on problem definition; April and May will be devoted to generating solutions. We
suggest that time be allocated to evaluate our progress at four points along the way
to check that all criteria have been fulfilled: (1) after completion of the definition of
the problem, (2) after deciding the course of action, (3) during the implementation,
and (4) at the end of the project.
A Gantt Chart
In the Gantt chart, note that at least 25 % of the time has been devoted to the
problem definition process, which includes the four steps of gathering information
discussed in Chapter 4. Many-if not most--of the unfortunate consequences of
the incorrectly defined problems discussed in Chapters 1 and 5 would not have
occurred if more time had been spent on defining the problem rather than hurrying
to implement a solution. Most experts agree that the project is halfway complete
once the real problem is defined, written down, and communicated.
Below is an example of the use of a Gantt chart for the development of a W.
No matter how hard we try, planning is not perfect, and sometimes .docxhenrymartin15260
No matter how hard we try, planning is not perfect, and sometimes plans fail. Typical reasons
include:
● Corporate goals are not understood at the lower organizational levels.
● Plans encompass too much in too little time.
● Financial estimates are poor.
● Plans are based on insufficient data.
● No attempt is being made to systematize the planning process.
● Planning is performed by a planning group.
● No one knows the ultimate objective.
● No one knows the staffing requirements.
● No one knows the major milestone dates, including written reports.
● Project estimates are best guesses, and are not based on standards or history.
● Not enough time has been given for proper estimating.
● No one has bothered to see if there will be personnel available with the necessary skills.
● People are not working toward the same specifications.
● People are consistently shuffled in and out of the project with little regard for
schedule.
Stopping Projects 549
Why do these situations occur? If corporate goals are not understood, it is because corporate
executives have been negligent in providing the necessary strategic information and
feedback. If a plan fails because of extreme optimism, then the responsibility lies with both
the project and line managers for not assessing risk. Project managers should ask the line
managers if the estimates are optimistic or pessimistic, and expect an honest answer.
Erroneous financial estimates are the responsibility of the line manager. If the project fails
because of a poor definition of the requirements, then the project manager is totally at fault.
Sometimes project plans fail because simple details are forgotten or overlooked.
Examples of this might be:
● Neglecting to tell a line manager early enough that the prototype is not ready and
that rescheduling is necessary.
● Neglecting to see if the line manager can still provide additional employees for the
next two weeks because it was possible to do so six months ago.
Sometimes plans fail because the project manager “bites off more than he can chew,”
and then something happens, such as his becoming ill. Many projects have failed because
the project manager was the only one who knew what was going on and then got sick.
11.20 STOPPING PROJECTS
There are always situations in which projects have to be stopped. Nine
reasons for stopping are:
● Final achievement of the objectives
● Poor initial planning and market prognosis
● A better alternative is found
● A change in the company interest and strategy
● Allocated time is exceeded
● Budgeted costs are exceeded
● Key people leave the organization
● Personal whims of management
● Problem too complex for the resources available
Today most of the reasons why projects are not completed on time and within cost are
behavioral rather than quantitative. They include:
● Poor morale
● Poor human relations
● Poor labor productivity
● No commitment by those involved in the project
The last item appears to be the cause of the first three ite.
Quick and Easy Guide to Planning & Scheduling with Microsoft ProjectDeepak Alse
These are 8 slides that I’ve repeatedly used to train consultants, clients or consulting teams when I want to quickly get them onboard the idea of using Microsoft Project.
The slides do not make you an expert but if you know how to get through these 8 steps, you’ll feel comfortable with using Microsoft project for basic project planning and scheduling.
Presenting this set of slides with name - Initial Project Meeting Agenda Powerpoint Presentation Slides. Keep your audience glued to their seats with professionally designed PPT slides. This deck comprises of total of twenty seven slides. It has PPT templates with creative visuals and well researched content. Not just this, our PowerPoint professionals have crafted this deck with appropriate diagrams, layouts, icons, graphs, charts and more. This content ready presentation deck is fully editable. Just click the DOWNLOAD button below. Change the colour, text and font size. You can also modify the content as per your need. Get access to this well crafted complete deck presentation and leave your audience stunned.
Review the project case. Determine the scope of the District 4 Production Warehouse Move project from the information provided in the case. Using the Project Scope Checklist, prepare a scope document for review and approval by the project sponsor prior to starting the project.
Project Scope Checklist
1. Project objective
2. Deliverables
3. Milestones
4. Technical requirements
TaskYou are required to prepare for this Assessment Item by.docxerlindaw
Task
You are required to prepare for this Assessment Item by:
READING the
Subject outline,
COMPLETING
Topic 2 Project Planning
BUILDING your PLAN up from the
Project
Title and Abstract
in Assessment Task 1
WHAT TO DO:
Follow the Study Schedule and work with the Topics in Interact as they provide a "scaffold" for your learning in this subject.
Develop a detailed Capstone
Project Proposal and Plan
using project management software (as listed in the Study Schedule) and the skills you have acquired from IT Project Management to develop a project plan with a
Work Breakdown Structure
(WBS), milestones and
Gantt chart
. These tools may help.
MicrosoftProject Pro (
http://office.microsoft.com/en-au/project/
);
Open source tools like GanttProject (
http://www.ganttproject.biz/
);
OpenProj(
http://sourceforge.net/projects/openproj/
)
OpenProject (
https://www.openproject.org/about)
.
ProjectLibre (
http://www.projectlibre.org/
)
Begin using the '
project blog
' as a tool beyond the
weekly progress reports
for your chosen emerging technology topic:
The blog helps you to "think by writing" and also store your notes, project files and links in a cloud-based service.
Consider sharing the site with your peers as a way to tell a story and harness each other’s knowledge.
The blog is ideally
updated each week
with 3 or 4 entries for documenting your project notes and as the foundation for editing and writing the Capstone Project Report. An ideal blog entry will have around 50-150 words (150-600 words a week).
Presentation
Project Plan Sample Format
(subject to change or modified to include systems development projects)
Title
: Emerging Technology and Innovation Topic
Project Blog ( Web address provided)
Weekly Progress Reports Plan (In class, Discussion Board or Project Blog entries)
Rationale
Problem domain
Purpose and justification
Supervisor Approval
Research Questions
Conceptual or Theoretical Framework
Methodology
Analysis of sources of information (EndNote, APA Referencing Style)
Research method(s)
Data collection or systems design methods
Ethical Issues
Compliance Requirements (Workplace, Industry or Government regulations)
Project Plan
Deliverables (
Annotated Bibliography, Journal Paper, Report, Seminar
)
Work breakdown structure (WBS)
Risk Analysis
Duration
Gantt chart
References
Appendix
(if required)
.
This slideshow was produced to provide people with a primer on 'how to use the one page project manager'. It does not replace, but supplements, Clark Addison Campbell's excellent book The One-Page Project Manager.
...Geoff
(www.performancepeople.com.au)
Using the-one-page-project-manager-1233449659402110-1Nguyen Huy Toan
It might seem everything there is to know about project management already exists. But The One-Page Project Manager is something different. It is about communicating with those who are not part of the project, both inside and outside the organization. This constituency includes: the board of directors, senior management, suppliers, customers, superiors and subordinates indirectly involved with the project or its outcome, and others.
DevOps and Testing slides at DASA ConnectKari Kakkonen
My and Rik Marselis slides at 30.5.2024 DASA Connect conference. We discuss about what is testing, then what is agile testing and finally what is Testing in DevOps. Finally we had lovely workshop with the participants trying to find out different ways to think about quality and testing in different parts of the DevOps infinity loop.
Elevating Tactical DDD Patterns Through Object CalisthenicsDorra BARTAGUIZ
After immersing yourself in the blue book and its red counterpart, attending DDD-focused conferences, and applying tactical patterns, you're left with a crucial question: How do I ensure my design is effective? Tactical patterns within Domain-Driven Design (DDD) serve as guiding principles for creating clear and manageable domain models. However, achieving success with these patterns requires additional guidance. Interestingly, we've observed that a set of constraints initially designed for training purposes remarkably aligns with effective pattern implementation, offering a more ‘mechanical’ approach. Let's explore together how Object Calisthenics can elevate the design of your tactical DDD patterns, offering concrete help for those venturing into DDD for the first time!
Epistemic Interaction - tuning interfaces to provide information for AI supportAlan Dix
Paper presented at SYNERGY workshop at AVI 2024, Genoa, Italy. 3rd June 2024
https://alandix.com/academic/papers/synergy2024-epistemic/
As machine learning integrates deeper into human-computer interactions, the concept of epistemic interaction emerges, aiming to refine these interactions to enhance system adaptability. This approach encourages minor, intentional adjustments in user behaviour to enrich the data available for system learning. This paper introduces epistemic interaction within the context of human-system communication, illustrating how deliberate interaction design can improve system understanding and adaptation. Through concrete examples, we demonstrate the potential of epistemic interaction to significantly advance human-computer interaction by leveraging intuitive human communication strategies to inform system design and functionality, offering a novel pathway for enriching user-system engagements.
Smart TV Buyer Insights Survey 2024 by 91mobiles.pdf91mobiles
91mobiles recently conducted a Smart TV Buyer Insights Survey in which we asked over 3,000 respondents about the TV they own, aspects they look at on a new TV, and their TV buying preferences.
Dev Dives: Train smarter, not harder – active learning and UiPath LLMs for do...UiPathCommunity
💥 Speed, accuracy, and scaling – discover the superpowers of GenAI in action with UiPath Document Understanding and Communications Mining™:
See how to accelerate model training and optimize model performance with active learning
Learn about the latest enhancements to out-of-the-box document processing – with little to no training required
Get an exclusive demo of the new family of UiPath LLMs – GenAI models specialized for processing different types of documents and messages
This is a hands-on session specifically designed for automation developers and AI enthusiasts seeking to enhance their knowledge in leveraging the latest intelligent document processing capabilities offered by UiPath.
Speakers:
👨🏫 Andras Palfi, Senior Product Manager, UiPath
👩🏫 Lenka Dulovicova, Product Program Manager, UiPath
Welocme to ViralQR, your best QR code generator.ViralQR
Welcome to ViralQR, your best QR code generator available on the market!
At ViralQR, we design static and dynamic QR codes. Our mission is to make business operations easier and customer engagement more powerful through the use of QR technology. Be it a small-scale business or a huge enterprise, our easy-to-use platform provides multiple choices that can be tailored according to your company's branding and marketing strategies.
Our Vision
We are here to make the process of creating QR codes easy and smooth, thus enhancing customer interaction and making business more fluid. We very strongly believe in the ability of QR codes to change the world for businesses in their interaction with customers and are set on making that technology accessible and usable far and wide.
Our Achievements
Ever since its inception, we have successfully served many clients by offering QR codes in their marketing, service delivery, and collection of feedback across various industries. Our platform has been recognized for its ease of use and amazing features, which helped a business to make QR codes.
Our Services
At ViralQR, here is a comprehensive suite of services that caters to your very needs:
Static QR Codes: Create free static QR codes. These QR codes are able to store significant information such as URLs, vCards, plain text, emails and SMS, Wi-Fi credentials, and Bitcoin addresses.
Dynamic QR codes: These also have all the advanced features but are subscription-based. They can directly link to PDF files, images, micro-landing pages, social accounts, review forms, business pages, and applications. In addition, they can be branded with CTAs, frames, patterns, colors, and logos to enhance your branding.
Pricing and Packages
Additionally, there is a 14-day free offer to ViralQR, which is an exceptional opportunity for new users to take a feel of this platform. One can easily subscribe from there and experience the full dynamic of using QR codes. The subscription plans are not only meant for business; they are priced very flexibly so that literally every business could afford to benefit from our service.
Why choose us?
ViralQR will provide services for marketing, advertising, catering, retail, and the like. The QR codes can be posted on fliers, packaging, merchandise, and banners, as well as to substitute for cash and cards in a restaurant or coffee shop. With QR codes integrated into your business, improve customer engagement and streamline operations.
Comprehensive Analytics
Subscribers of ViralQR receive detailed analytics and tracking tools in light of having a view of the core values of QR code performance. Our analytics dashboard shows aggregate views and unique views, as well as detailed information about each impression, including time, device, browser, and estimated location by city and country.
So, thank you for choosing ViralQR; we have an offer of nothing but the best in terms of QR code services to meet business diversity!
LF Energy Webinar: Electrical Grid Modelling and Simulation Through PowSyBl -...DanBrown980551
Do you want to learn how to model and simulate an electrical network from scratch in under an hour?
Then welcome to this PowSyBl workshop, hosted by Rte, the French Transmission System Operator (TSO)!
During the webinar, you will discover the PowSyBl ecosystem as well as handle and study an electrical network through an interactive Python notebook.
PowSyBl is an open source project hosted by LF Energy, which offers a comprehensive set of features for electrical grid modelling and simulation. Among other advanced features, PowSyBl provides:
- A fully editable and extendable library for grid component modelling;
- Visualization tools to display your network;
- Grid simulation tools, such as power flows, security analyses (with or without remedial actions) and sensitivity analyses;
The framework is mostly written in Java, with a Python binding so that Python developers can access PowSyBl functionalities as well.
What you will learn during the webinar:
- For beginners: discover PowSyBl's functionalities through a quick general presentation and the notebook, without needing any expert coding skills;
- For advanced developers: master the skills to efficiently apply PowSyBl functionalities to your real-world scenarios.
Assuring Contact Center Experiences for Your Customers With ThousandEyes
Seven Basic Steps to Build Realistic Schedule in Project 2010
1. Seven Basic Steps to
Build Realistic Schedule
in Project 2010
B Sai Prasad
PMP, PMI-SP, MCTS Project 2007,
MCTS Project 2010
www.sainivas.com
2. “Microsoft Project is the enhanced
version of Microsoft Excel”
Anonymous
Seven Steps To Success - Microsoft Project 2
3. Takeaways
• Forecast scheduling with Project 2010
1. Realistic
2. Dynamic
3. Presentable
Seven Steps To Success - Microsoft Project 3
4. Seven Steps To Success
1. Enter project information
2. Create work breakdown structure
3. Sequence tasks
4. Estimate resources
5. Optimize schedule
6. Baseline schedule
7. Record Progress
Seven Steps To Success - Microsoft Project 4
5. Step 1: Enter Project Information
Set the project start date
Don’t: Type project start date in Gantt Chart view.
Do: Set Project Information in Project ribbon
Set working time, holidays
Don’t: Change Calendar settings in Options dialog
Do: Use Change Working time in Project ribbon
Seven Steps To Success - Microsoft Project 5
6. Step 2: Create work breakdown
structure
Display project objective and estimates
Don’t: Insert summary task in Gantt Chart
Do: Show Project Summary task using Format ribbon
Add deliverables and detail tasks
Don’t: Auto schedule tasks, combine tasks into one
Do: Manually schedule tasks, insert tasks using Task
ribbon
Check WBS granularity
Don’t: Expand/collapse the summary tasks
Do: Use Outline button in View ribbon
Seven Steps To Success - Microsoft Project 6
7. Step 3: Sequence tasks
Set dependencies
Don’t: Enter the task dates, drag the task bar
Do: Set dependencies using Task forms
Validate network
Don’t: Use Gantt Chart view
Do: Use Task forms, Network diagram in Task ribbon
Compare top-down and bottom-up estimates
Don’t: Set constraints on low-level tasks
Do: Manually schedule summary tasks, auto schedule
detail tasks
Seven Steps To Success - Microsoft Project 7
8. Step 4: Estimate resources
Add resource details
Don’t: Type resource name in Gantt Chart
Do: Use Resource Sheet in Resource ribbon
Assign resources
Don’t: Select resource name in Gantt Chart
Do: Use Assign Resources, Team planner in Resource
ribbon
Fix task duration or work or resource assignment
Don’t: Change the work or duration
Do: Use the task type to control the behavior
Seven Steps To Success - Microsoft Project 8
9. Step 5: Optimize schedule
Identify critical path
Don’t: Have broken critical path
Do: Check slack, critical path using Format ribbon
Level resources
Don’t: Use Gantt chart view
Do: Use Resource Usage, Team planner in
Resource ribbon
Seven Steps To Success - Microsoft Project 9
10. Step 6: Baseline schedule
Set baseline
Don’t: Copy the file (or) fields to custom fields
Do: Set Baseline using Project ribbon
View baseline
Don’t: Insert columns in view
Do: Use Baseline table, Show baseline bar using
Format ribbon
Seven Steps To Success - Microsoft Project 10
11. Step 7: Record progress
Record actual
Don’t: Use the Entry table for recording actual
Do: Use the Tracking table with % complete in Task
ribbon
Slippage
Don’t: Write formula to calculate variance
Do: Use Slippage of Format ribbon, Variance table
Report progress
Don’t: Use the standard reports, copy picture
Do: Print views, copy timeline view
Seven Steps To Success - Microsoft Project 11
12. Seven Steps To Success
1. Enter Project Information
2. Create Work breakdown structure
3. Sequence tasks
4. Estimate resources
5. Optimize schedule
6. Baseline schedule
7. Record Progress
Seven Steps To Success - Microsoft Project 12