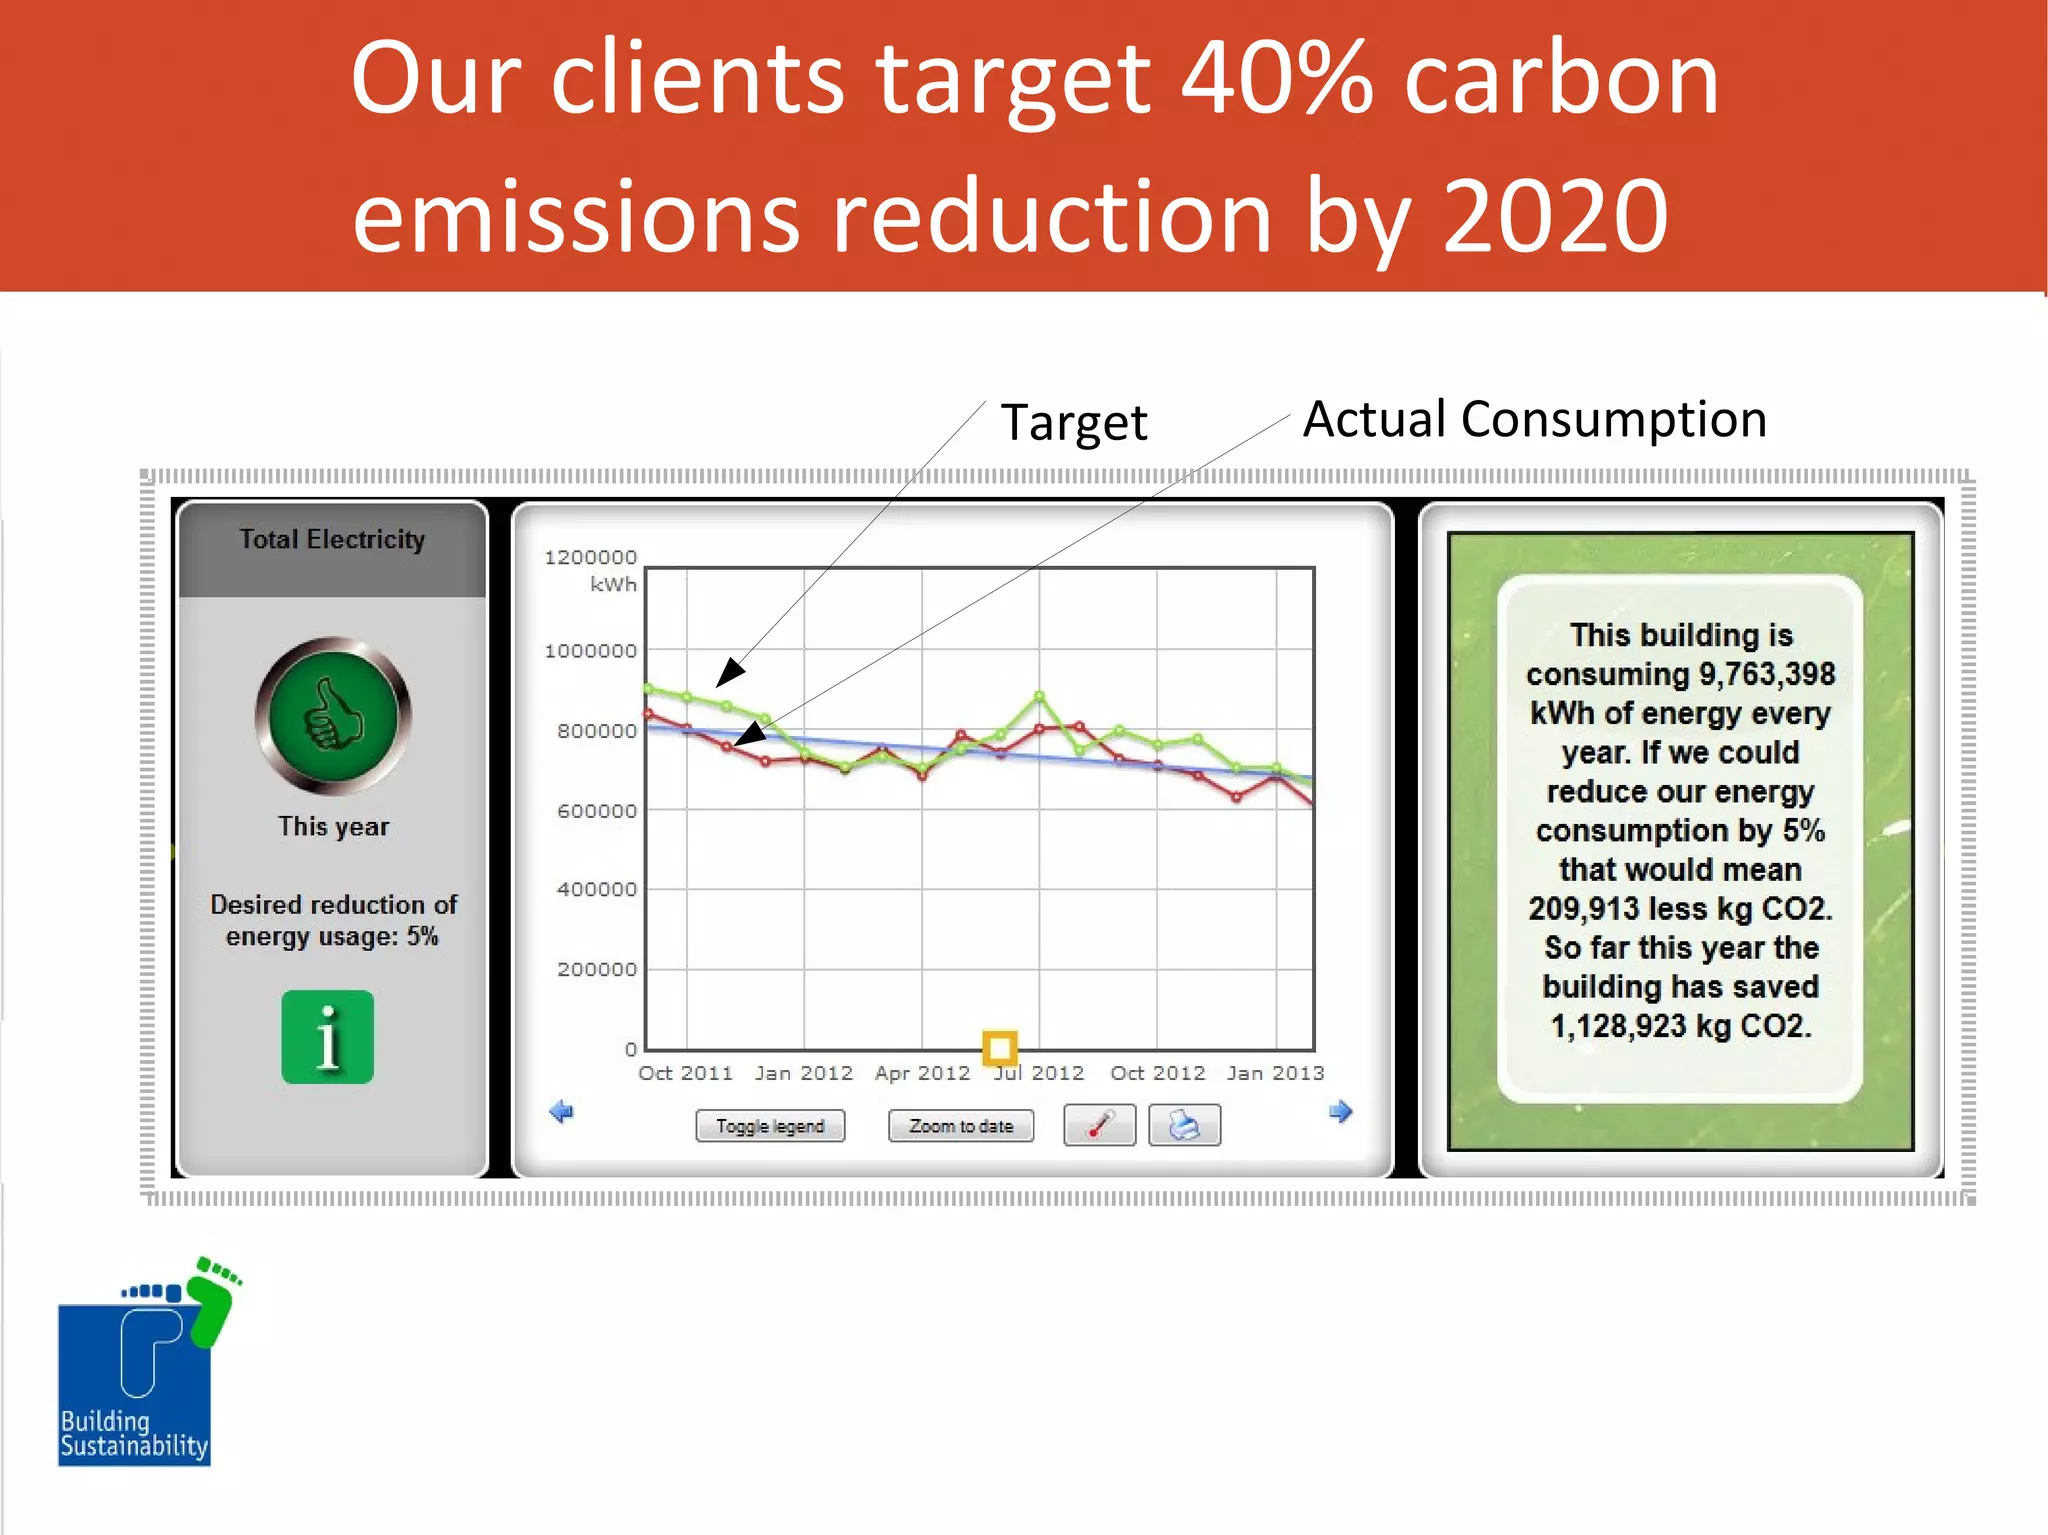
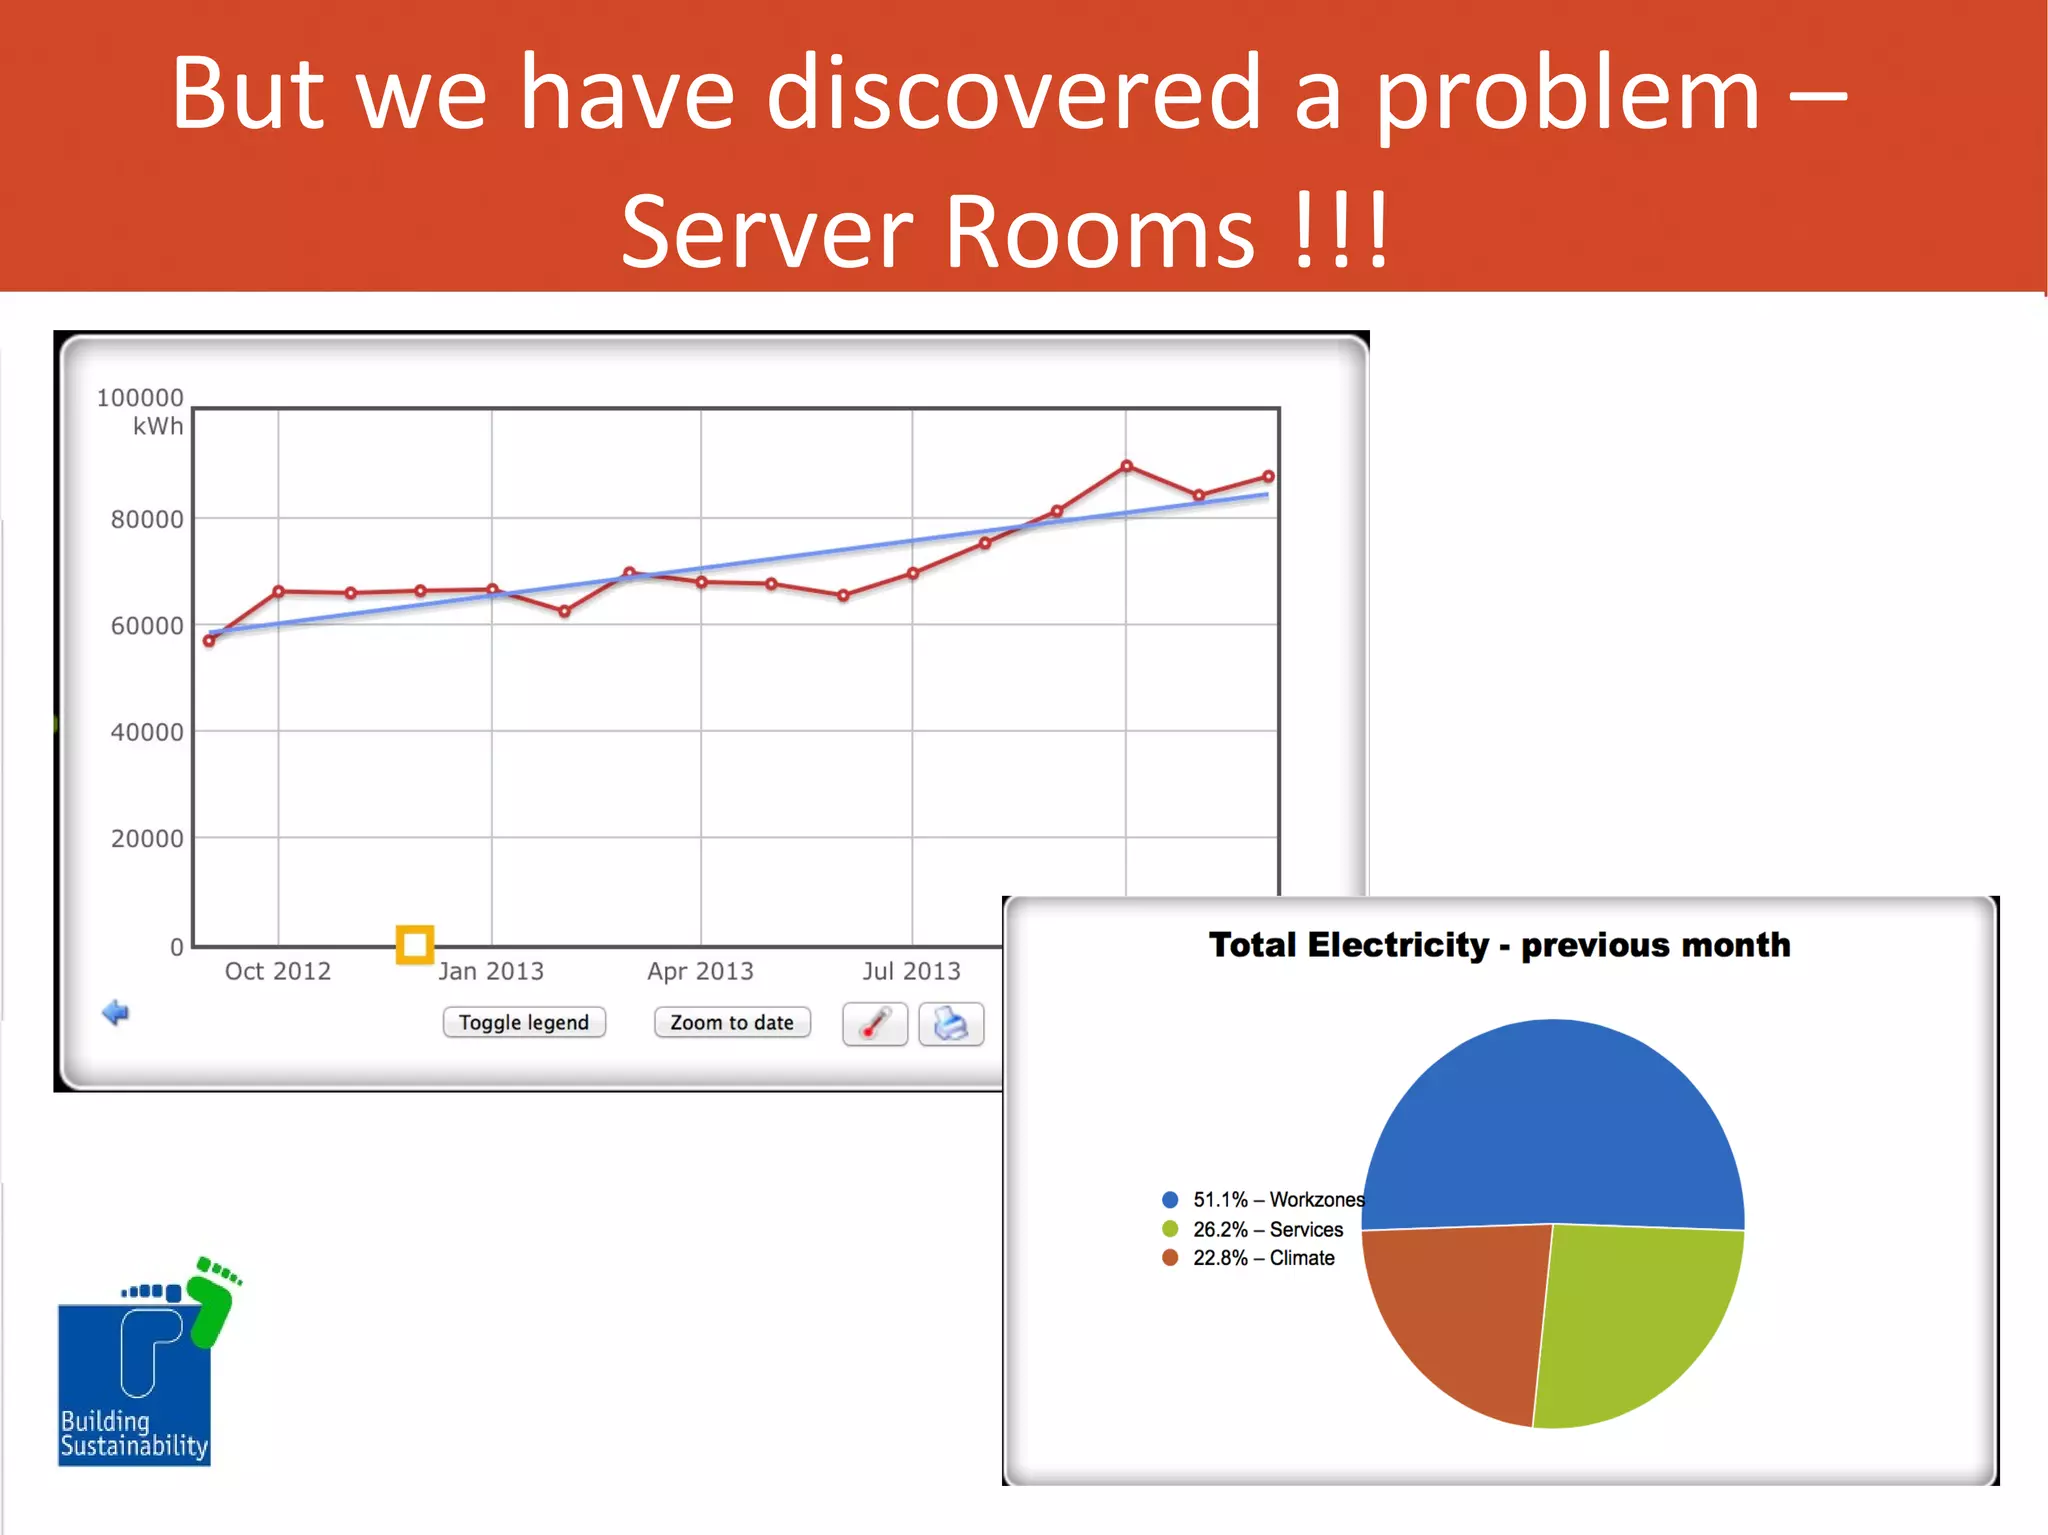
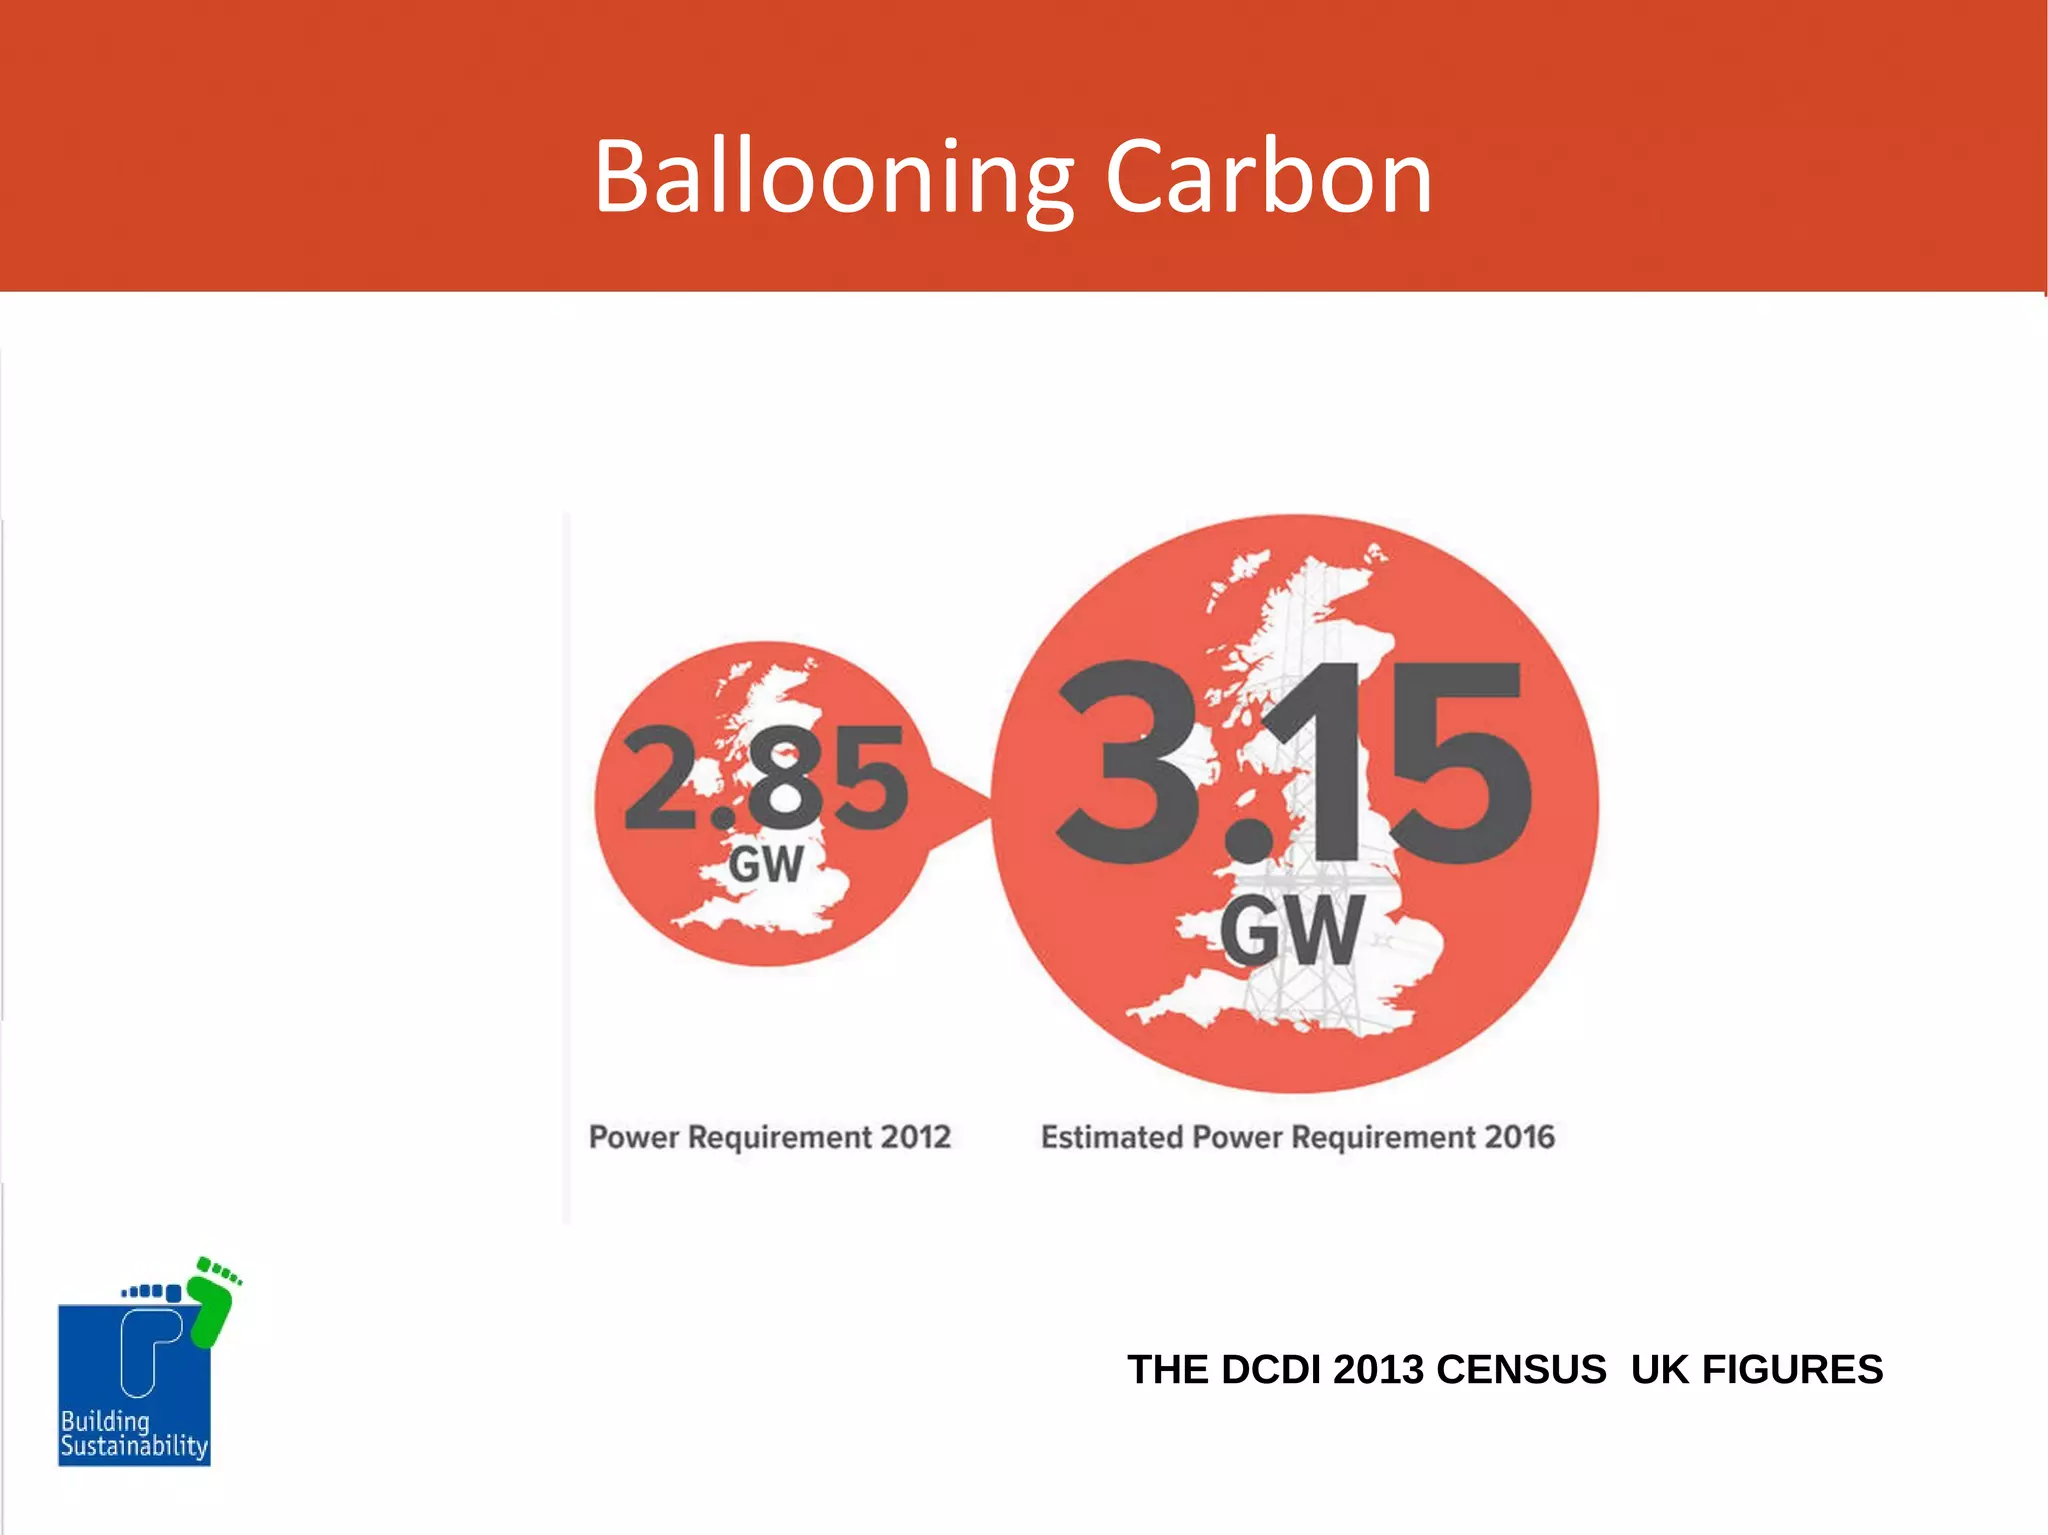
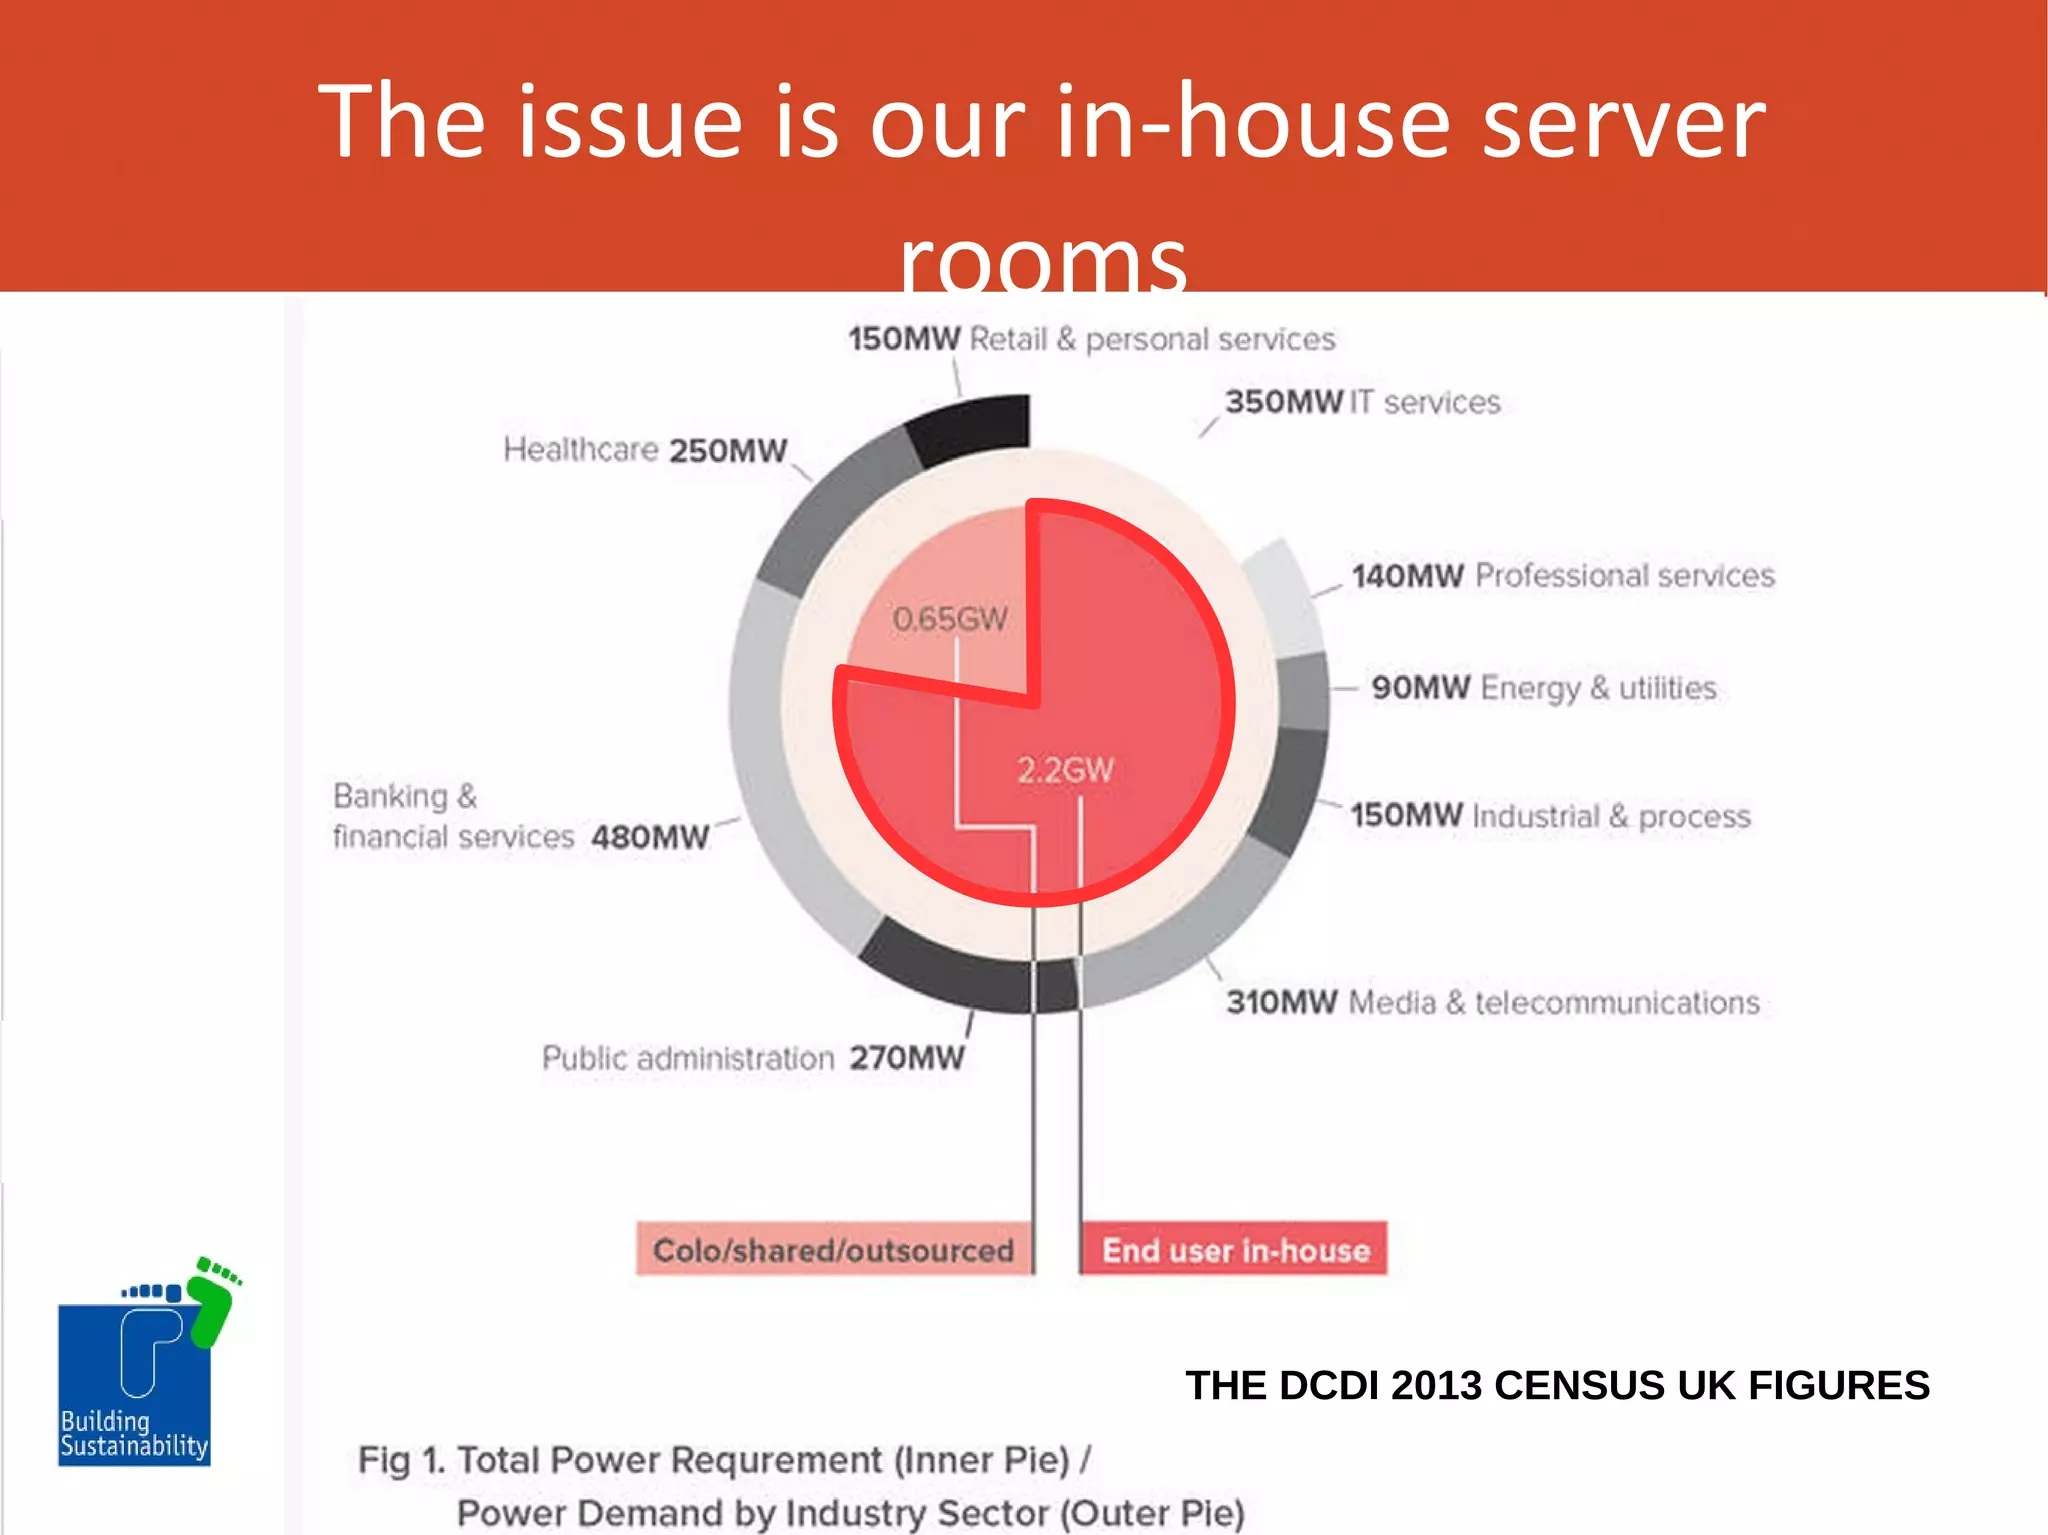
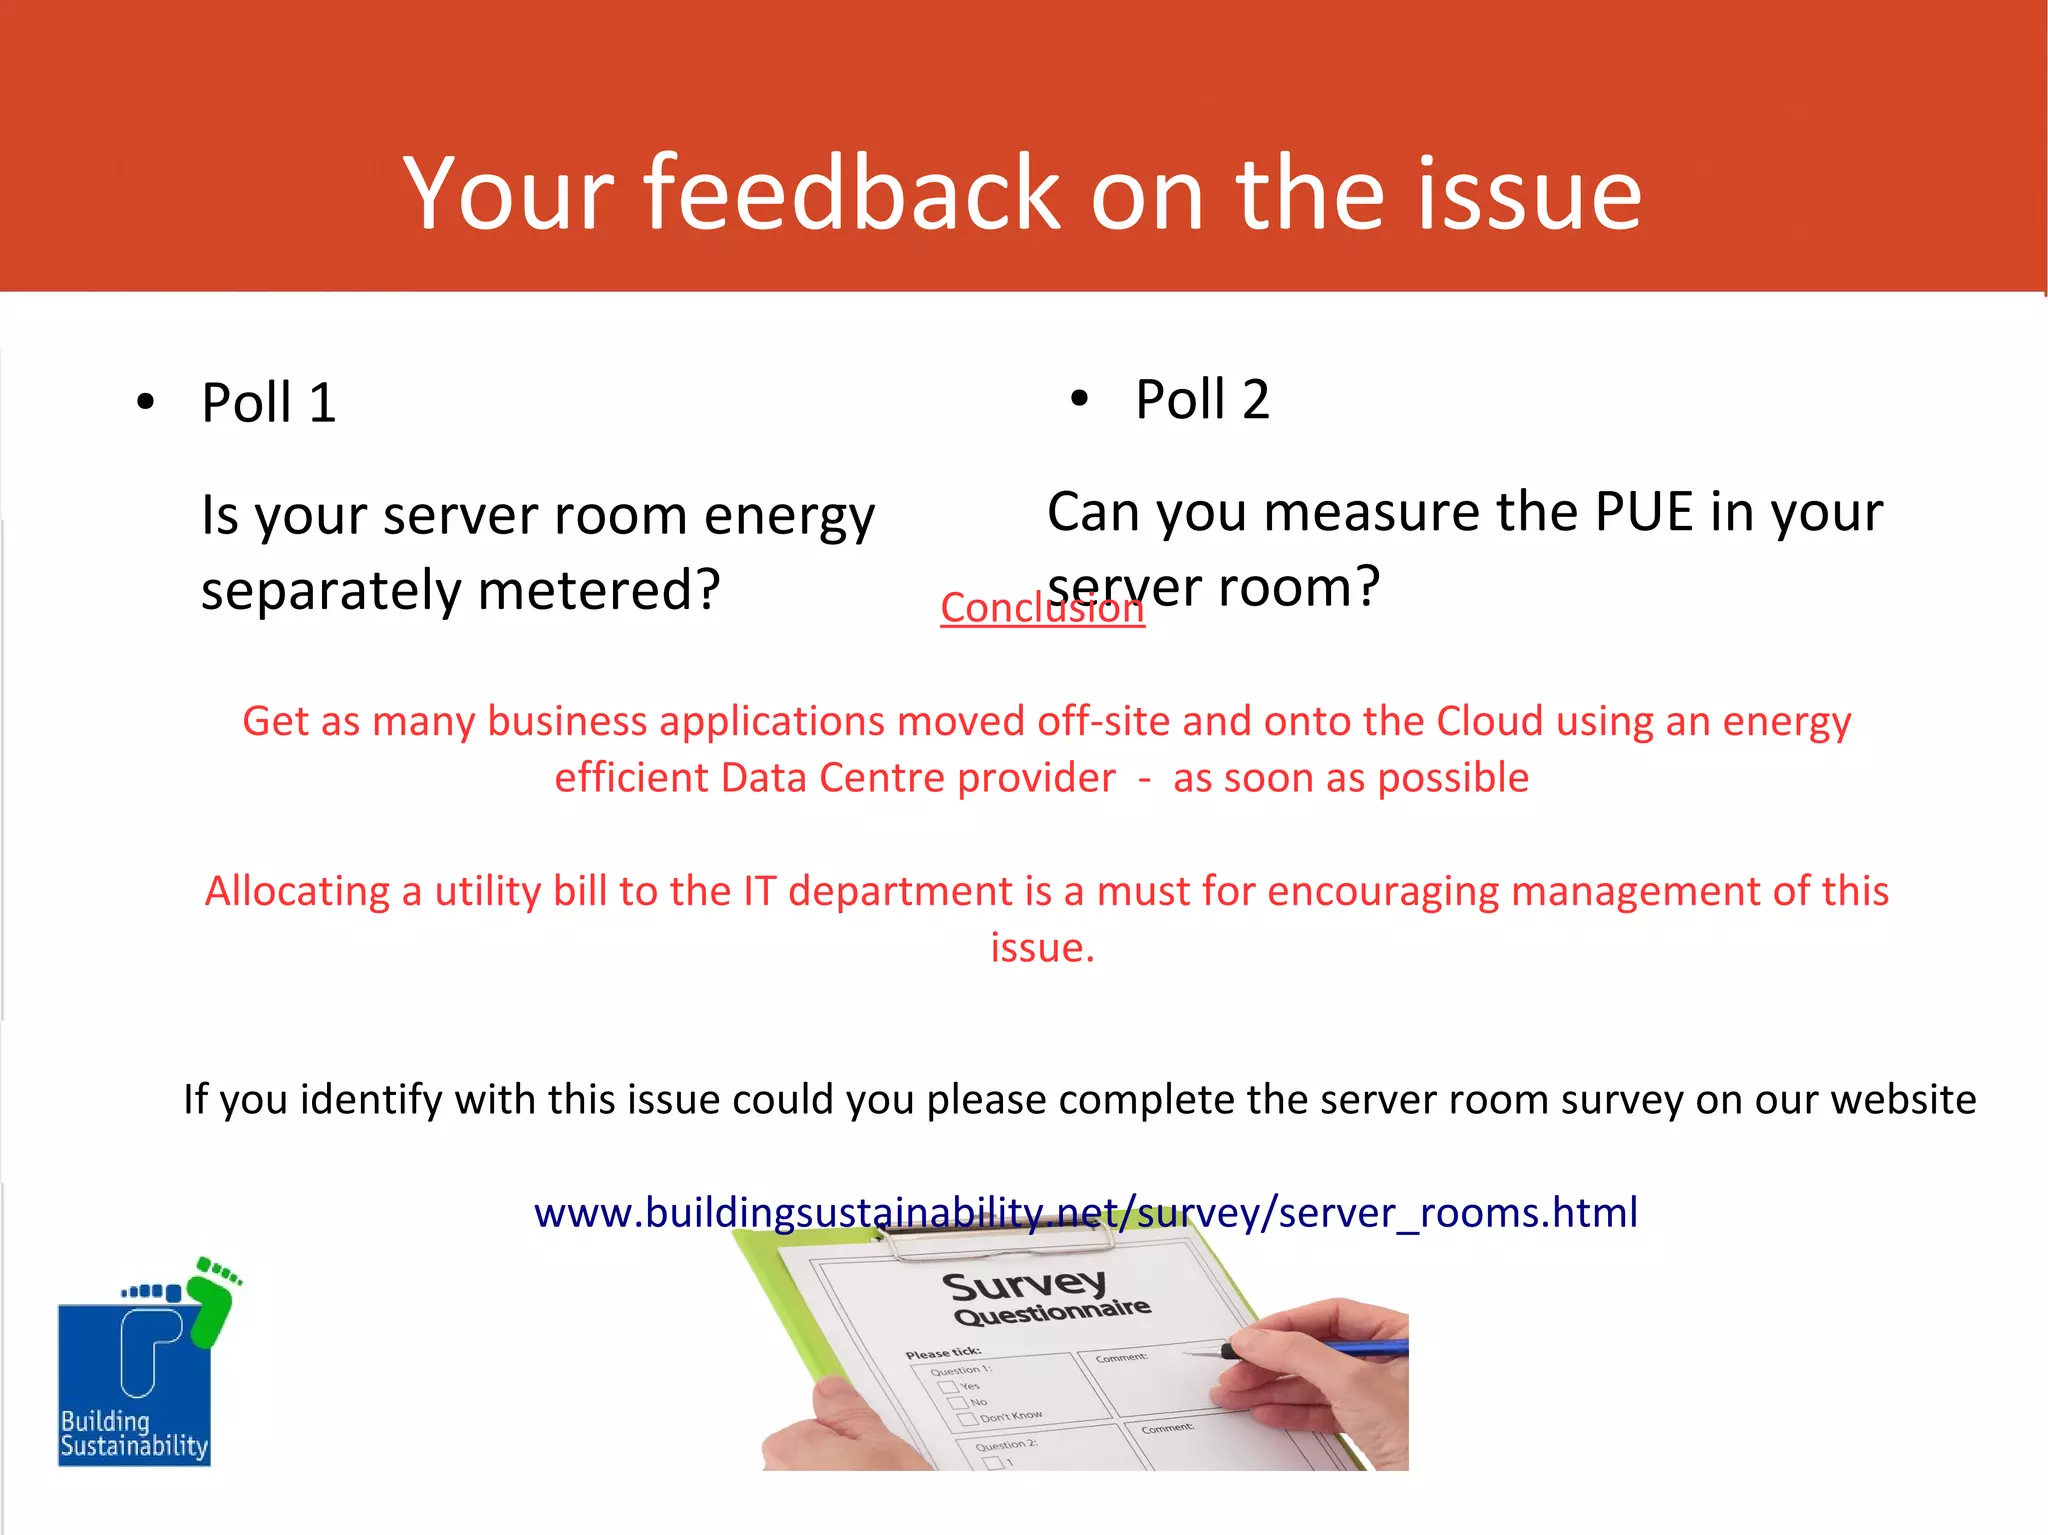
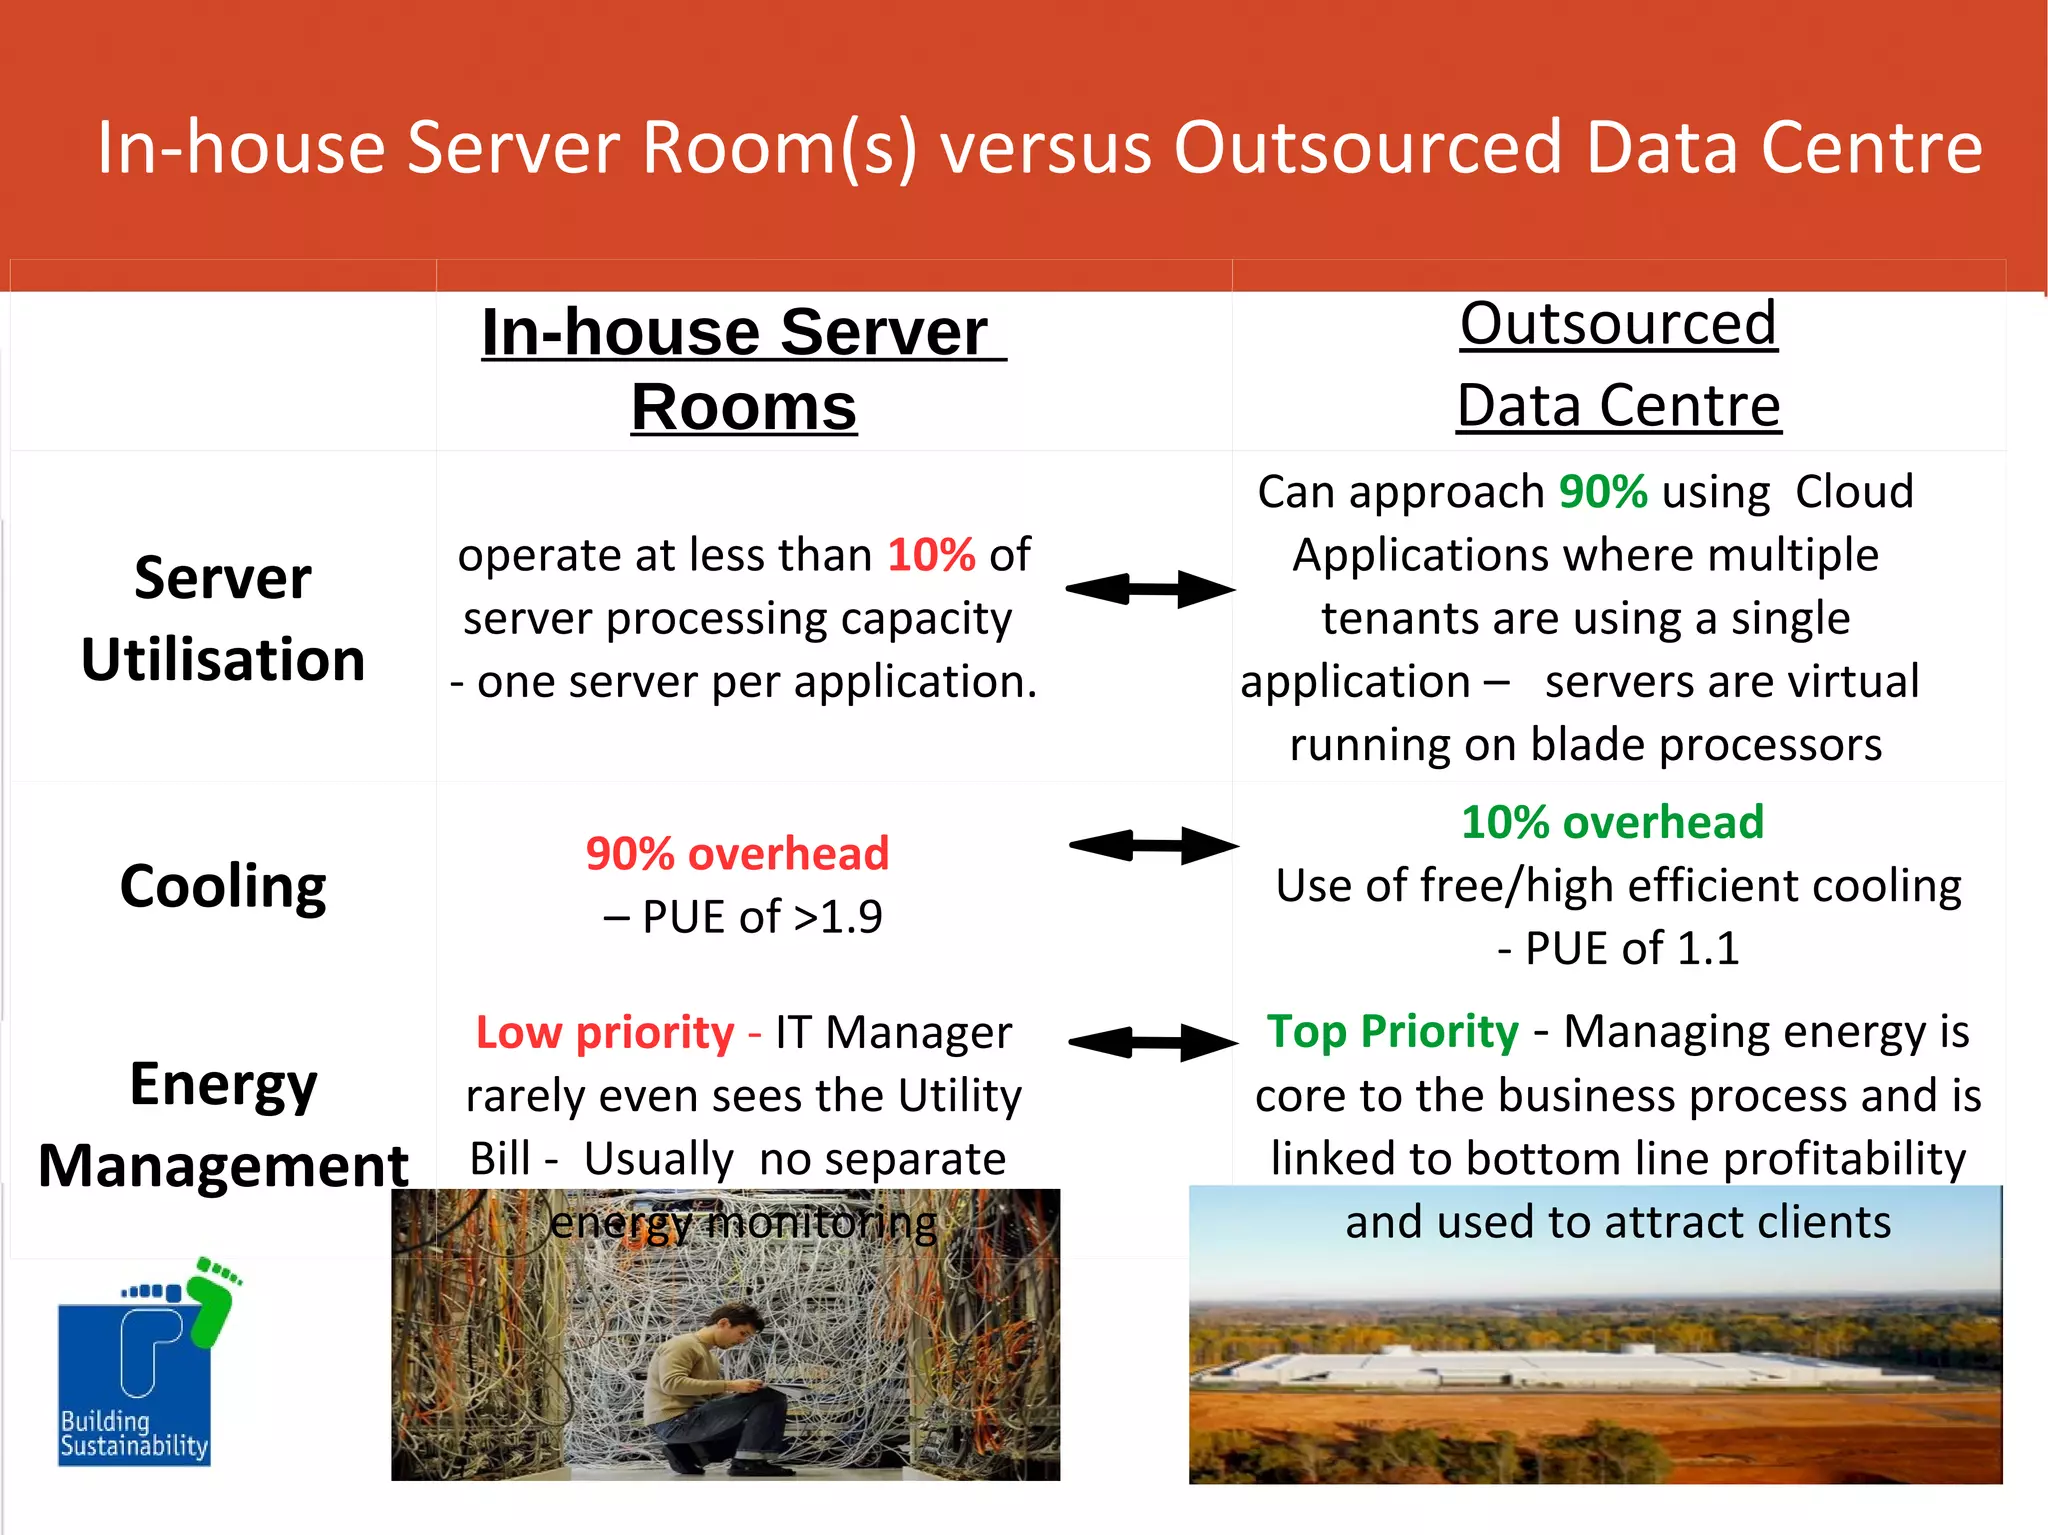
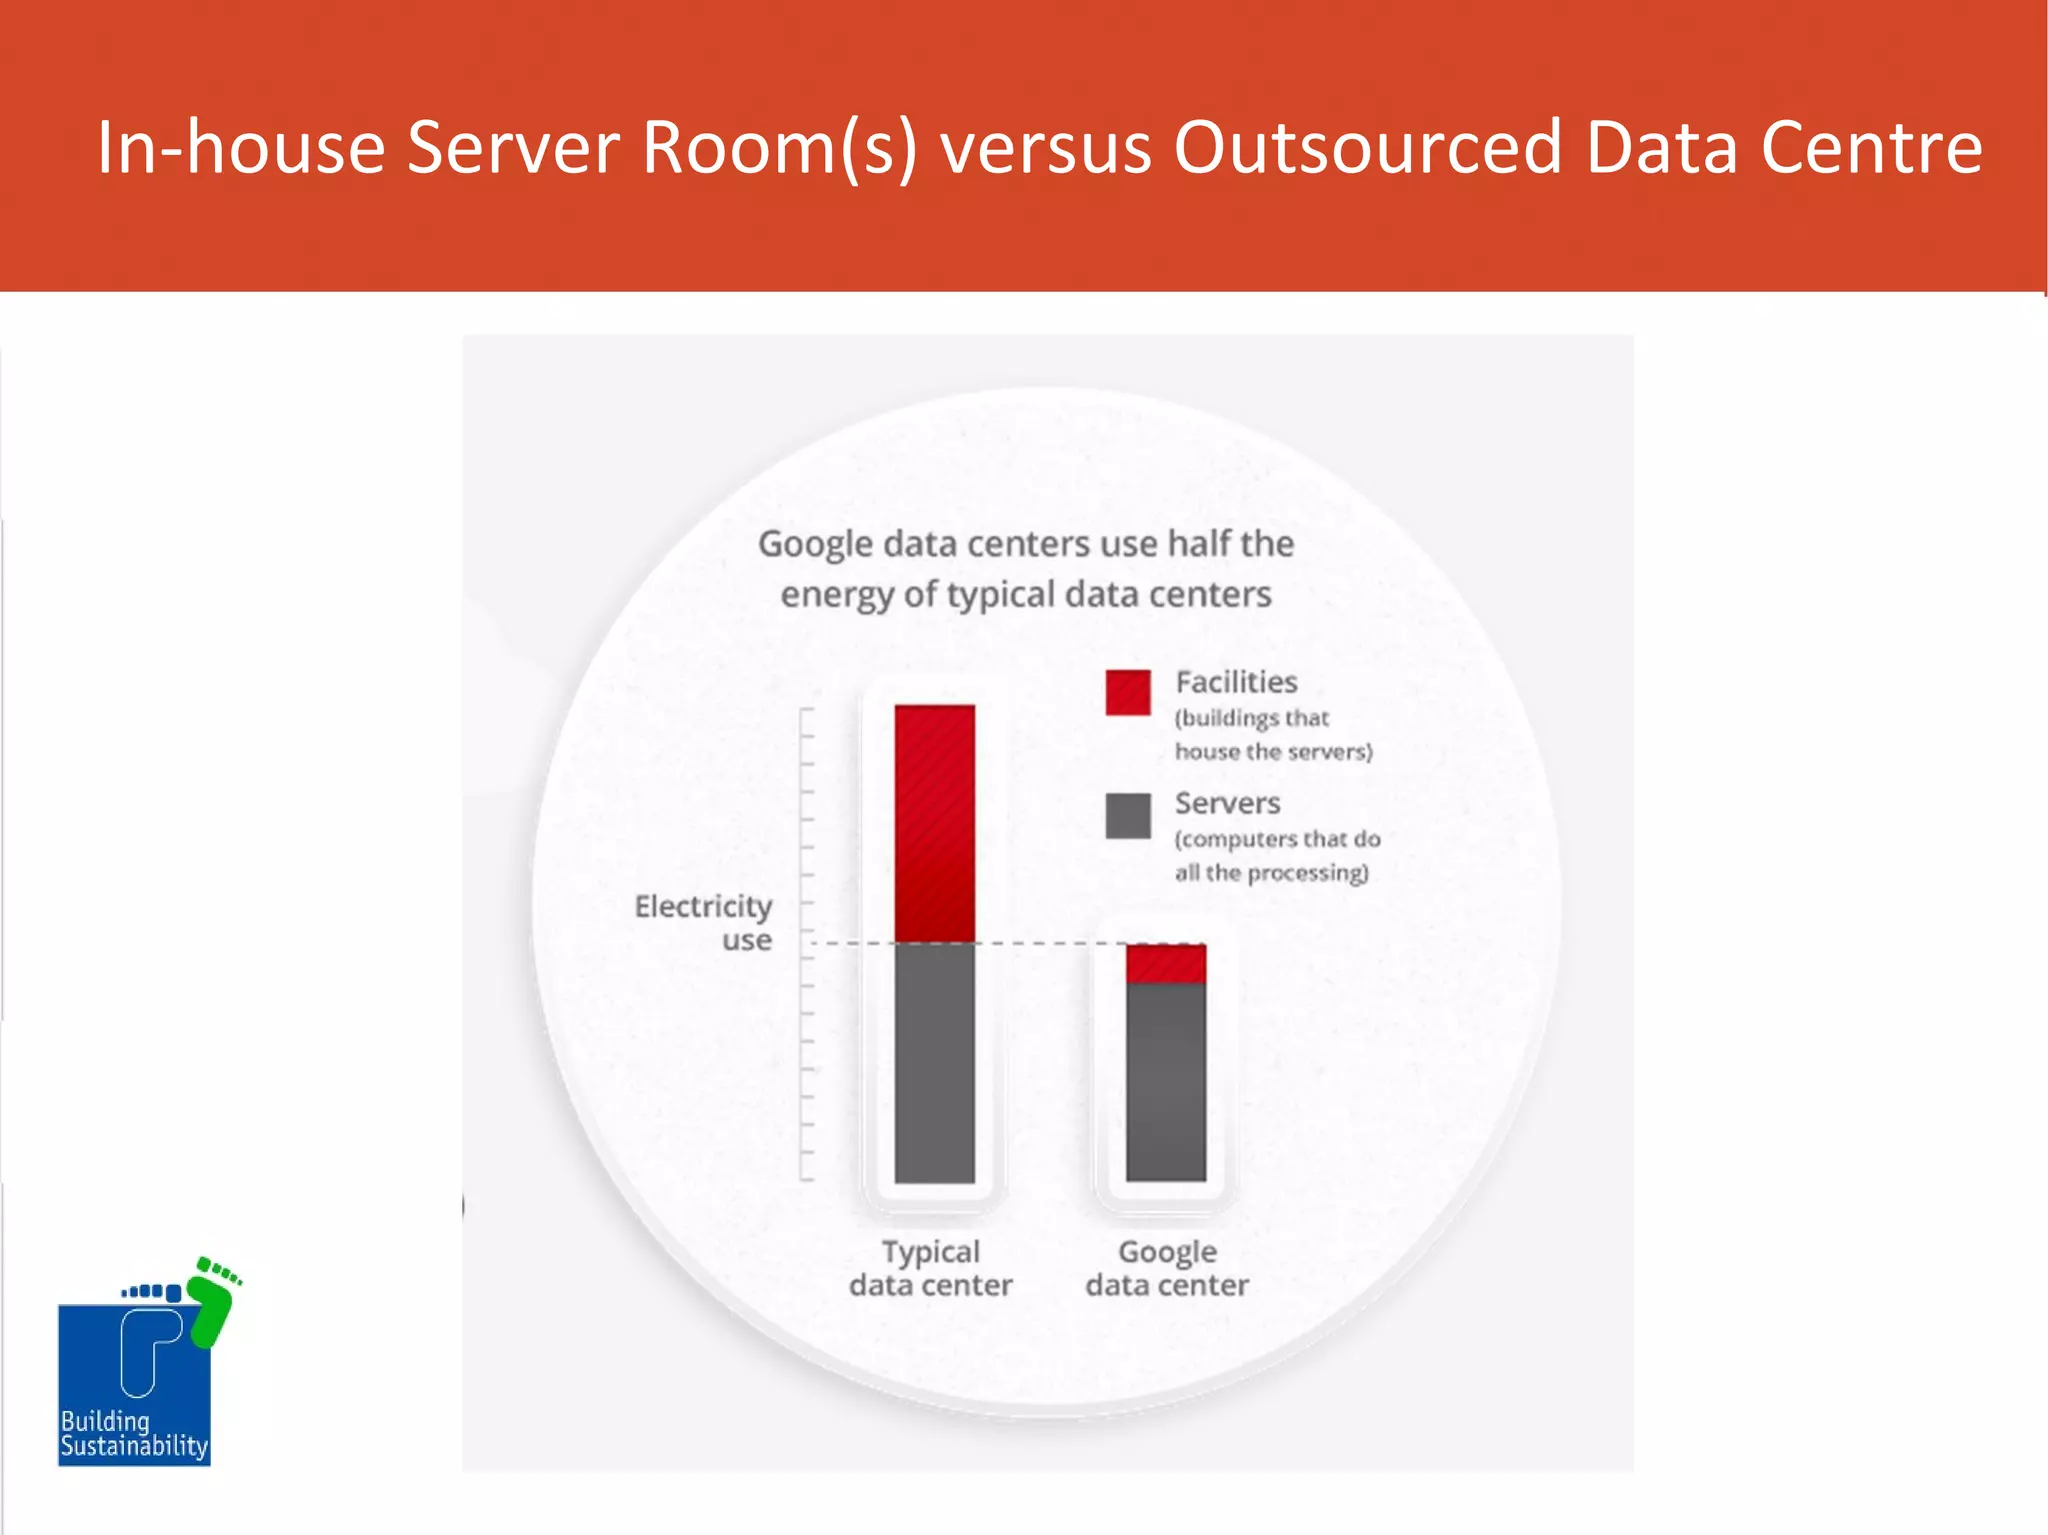
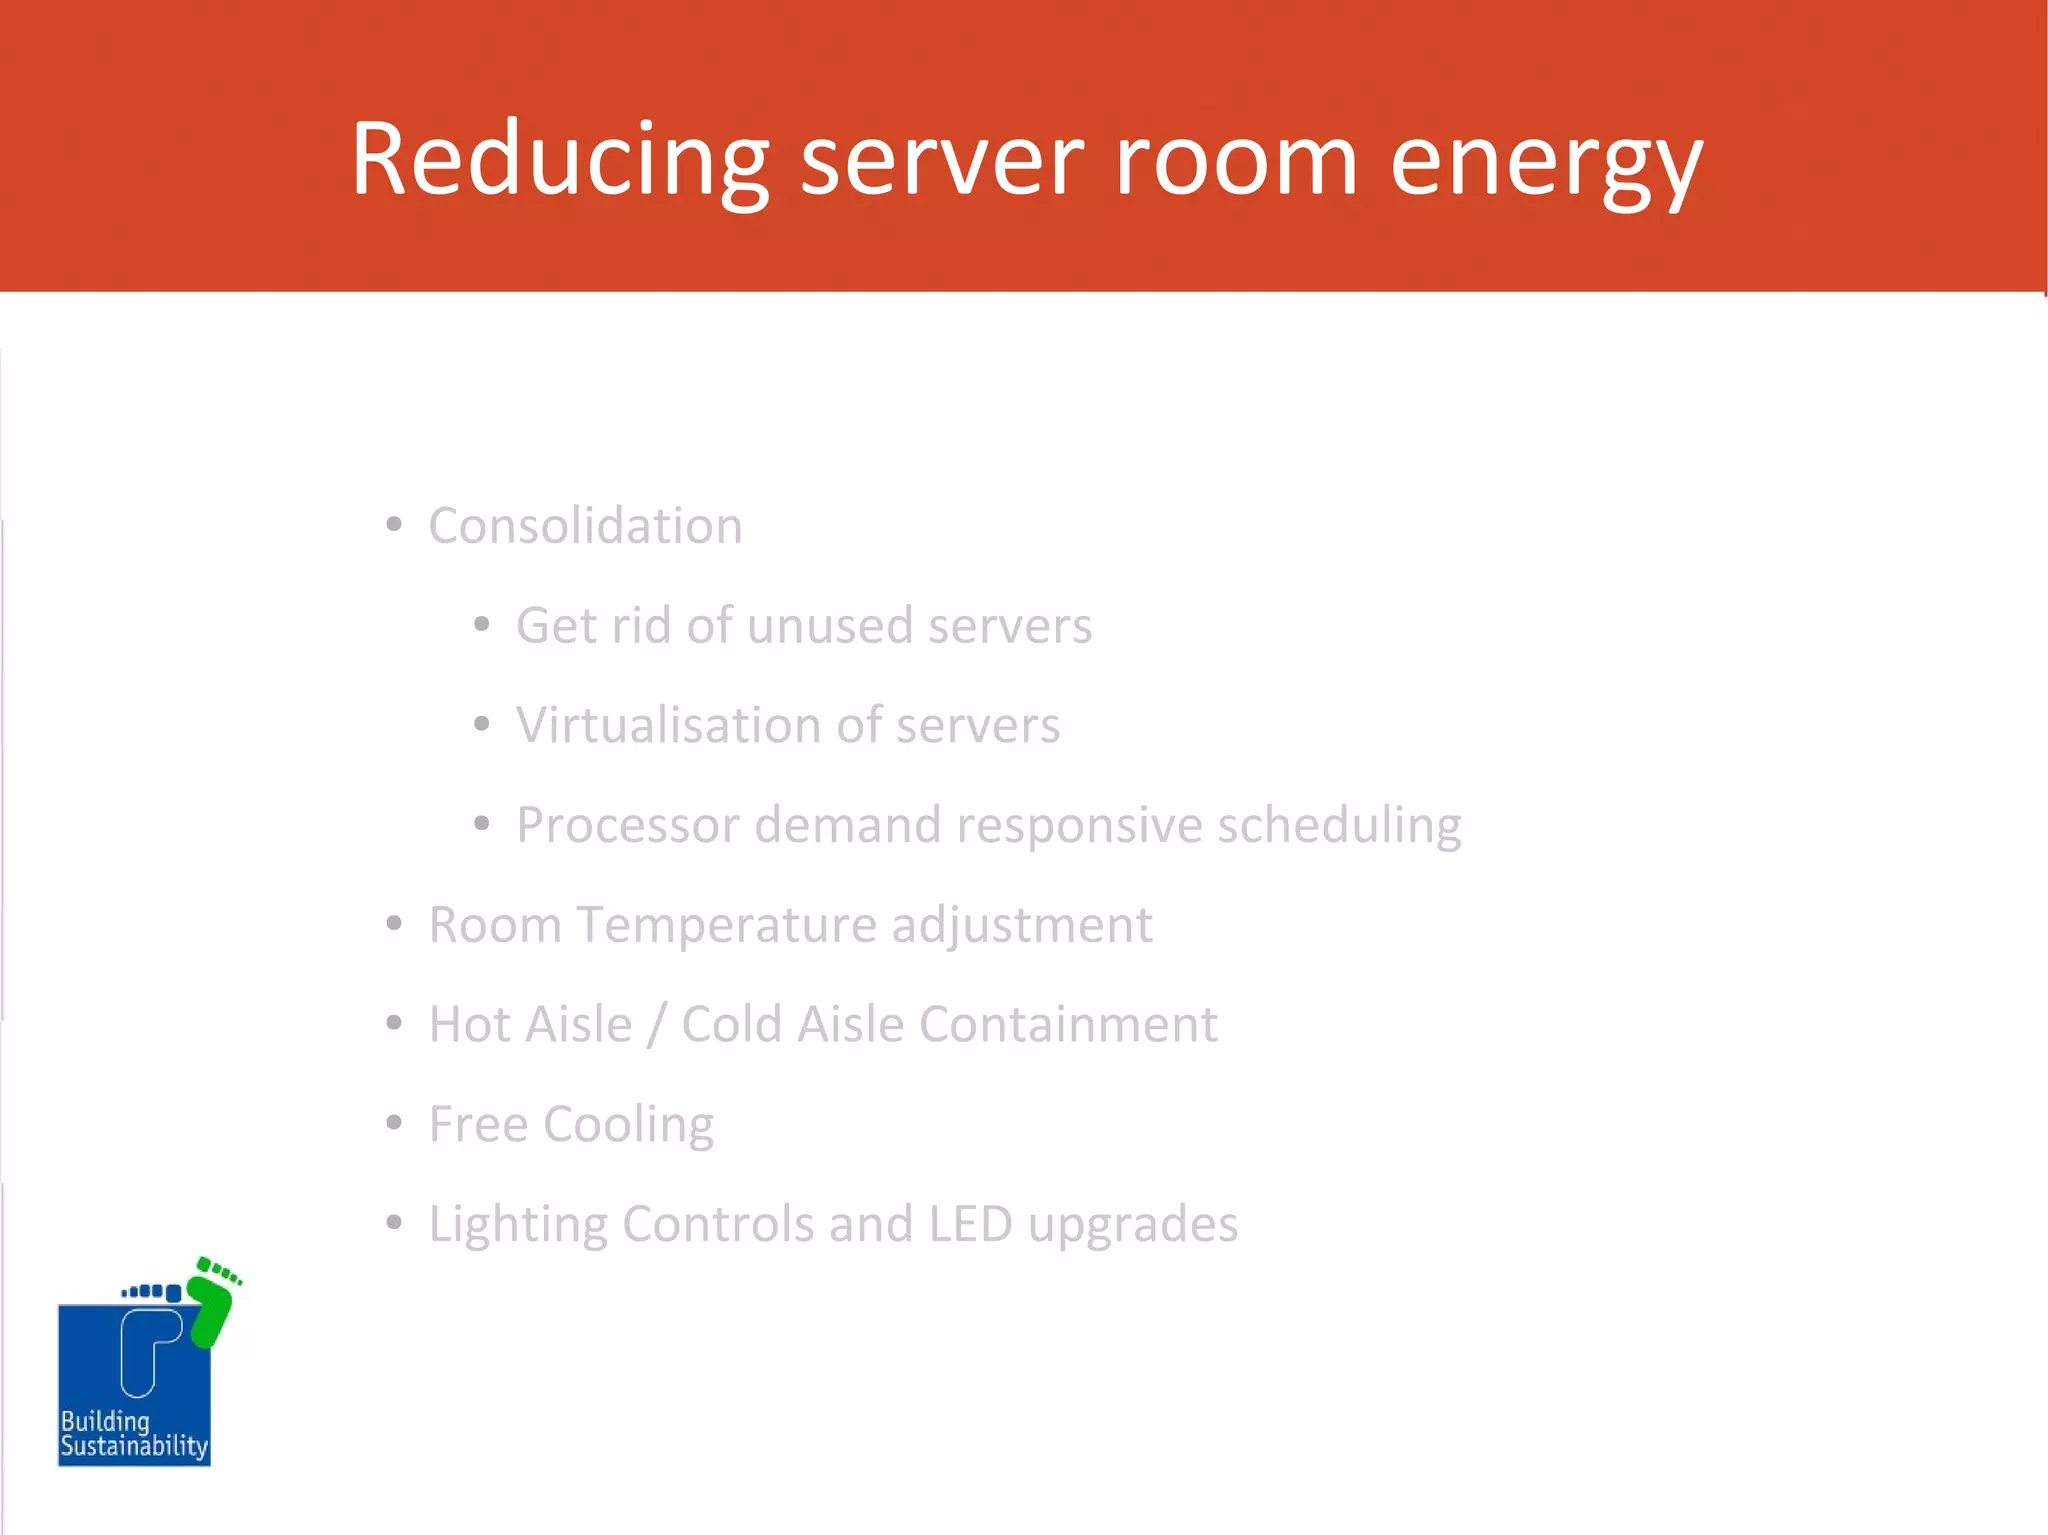
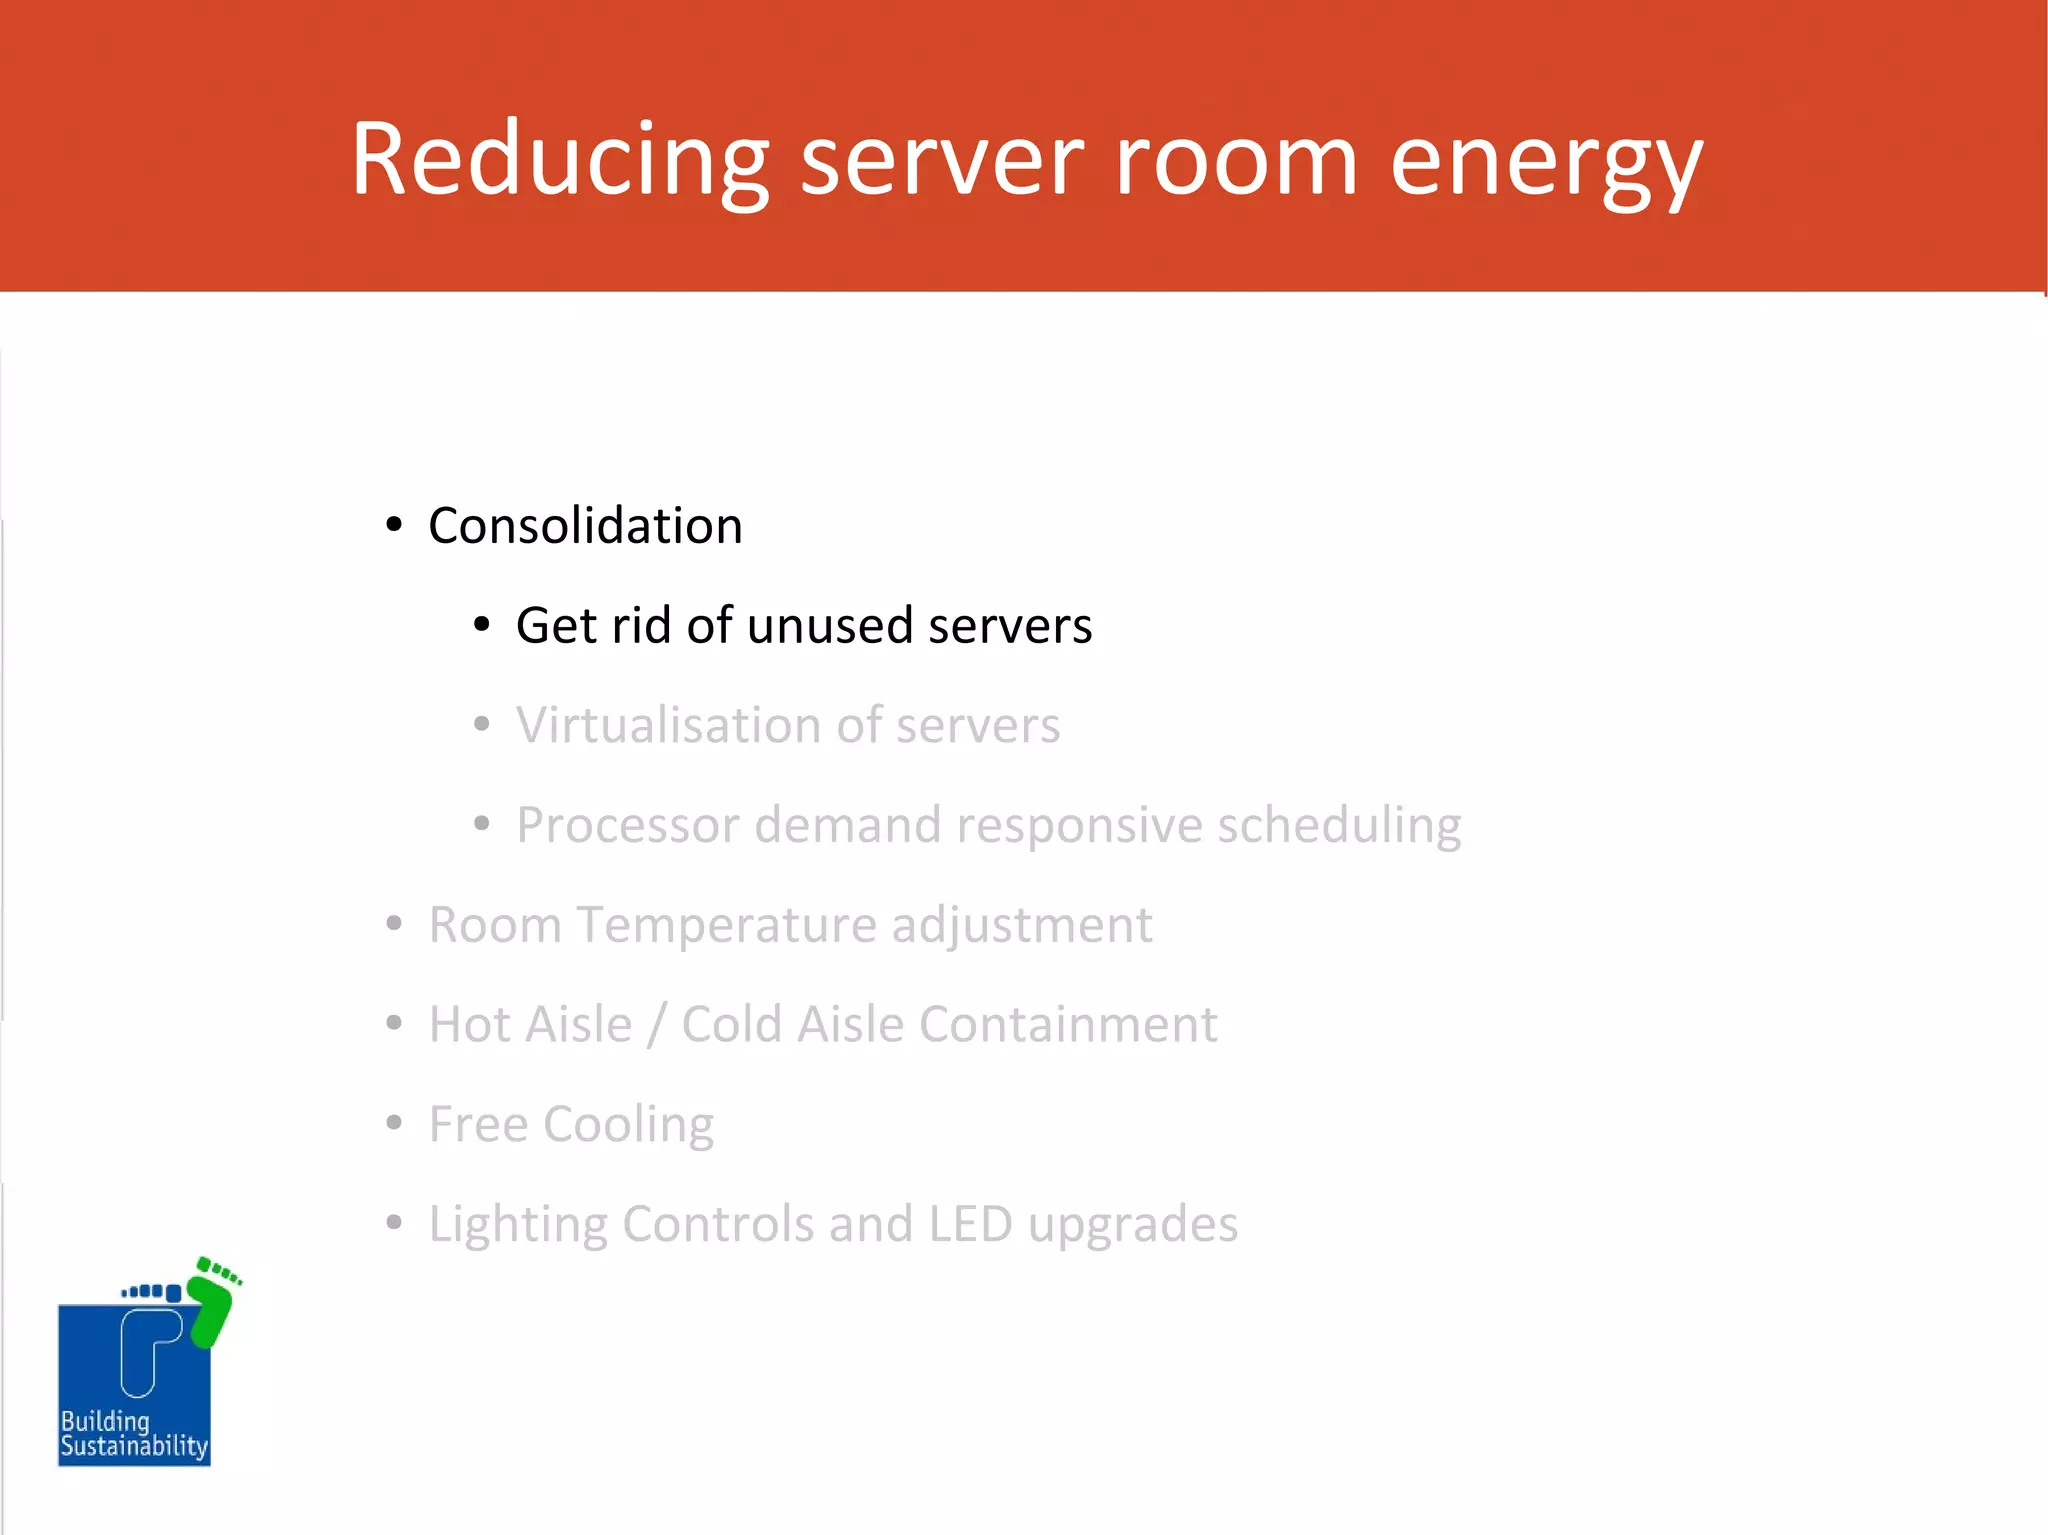
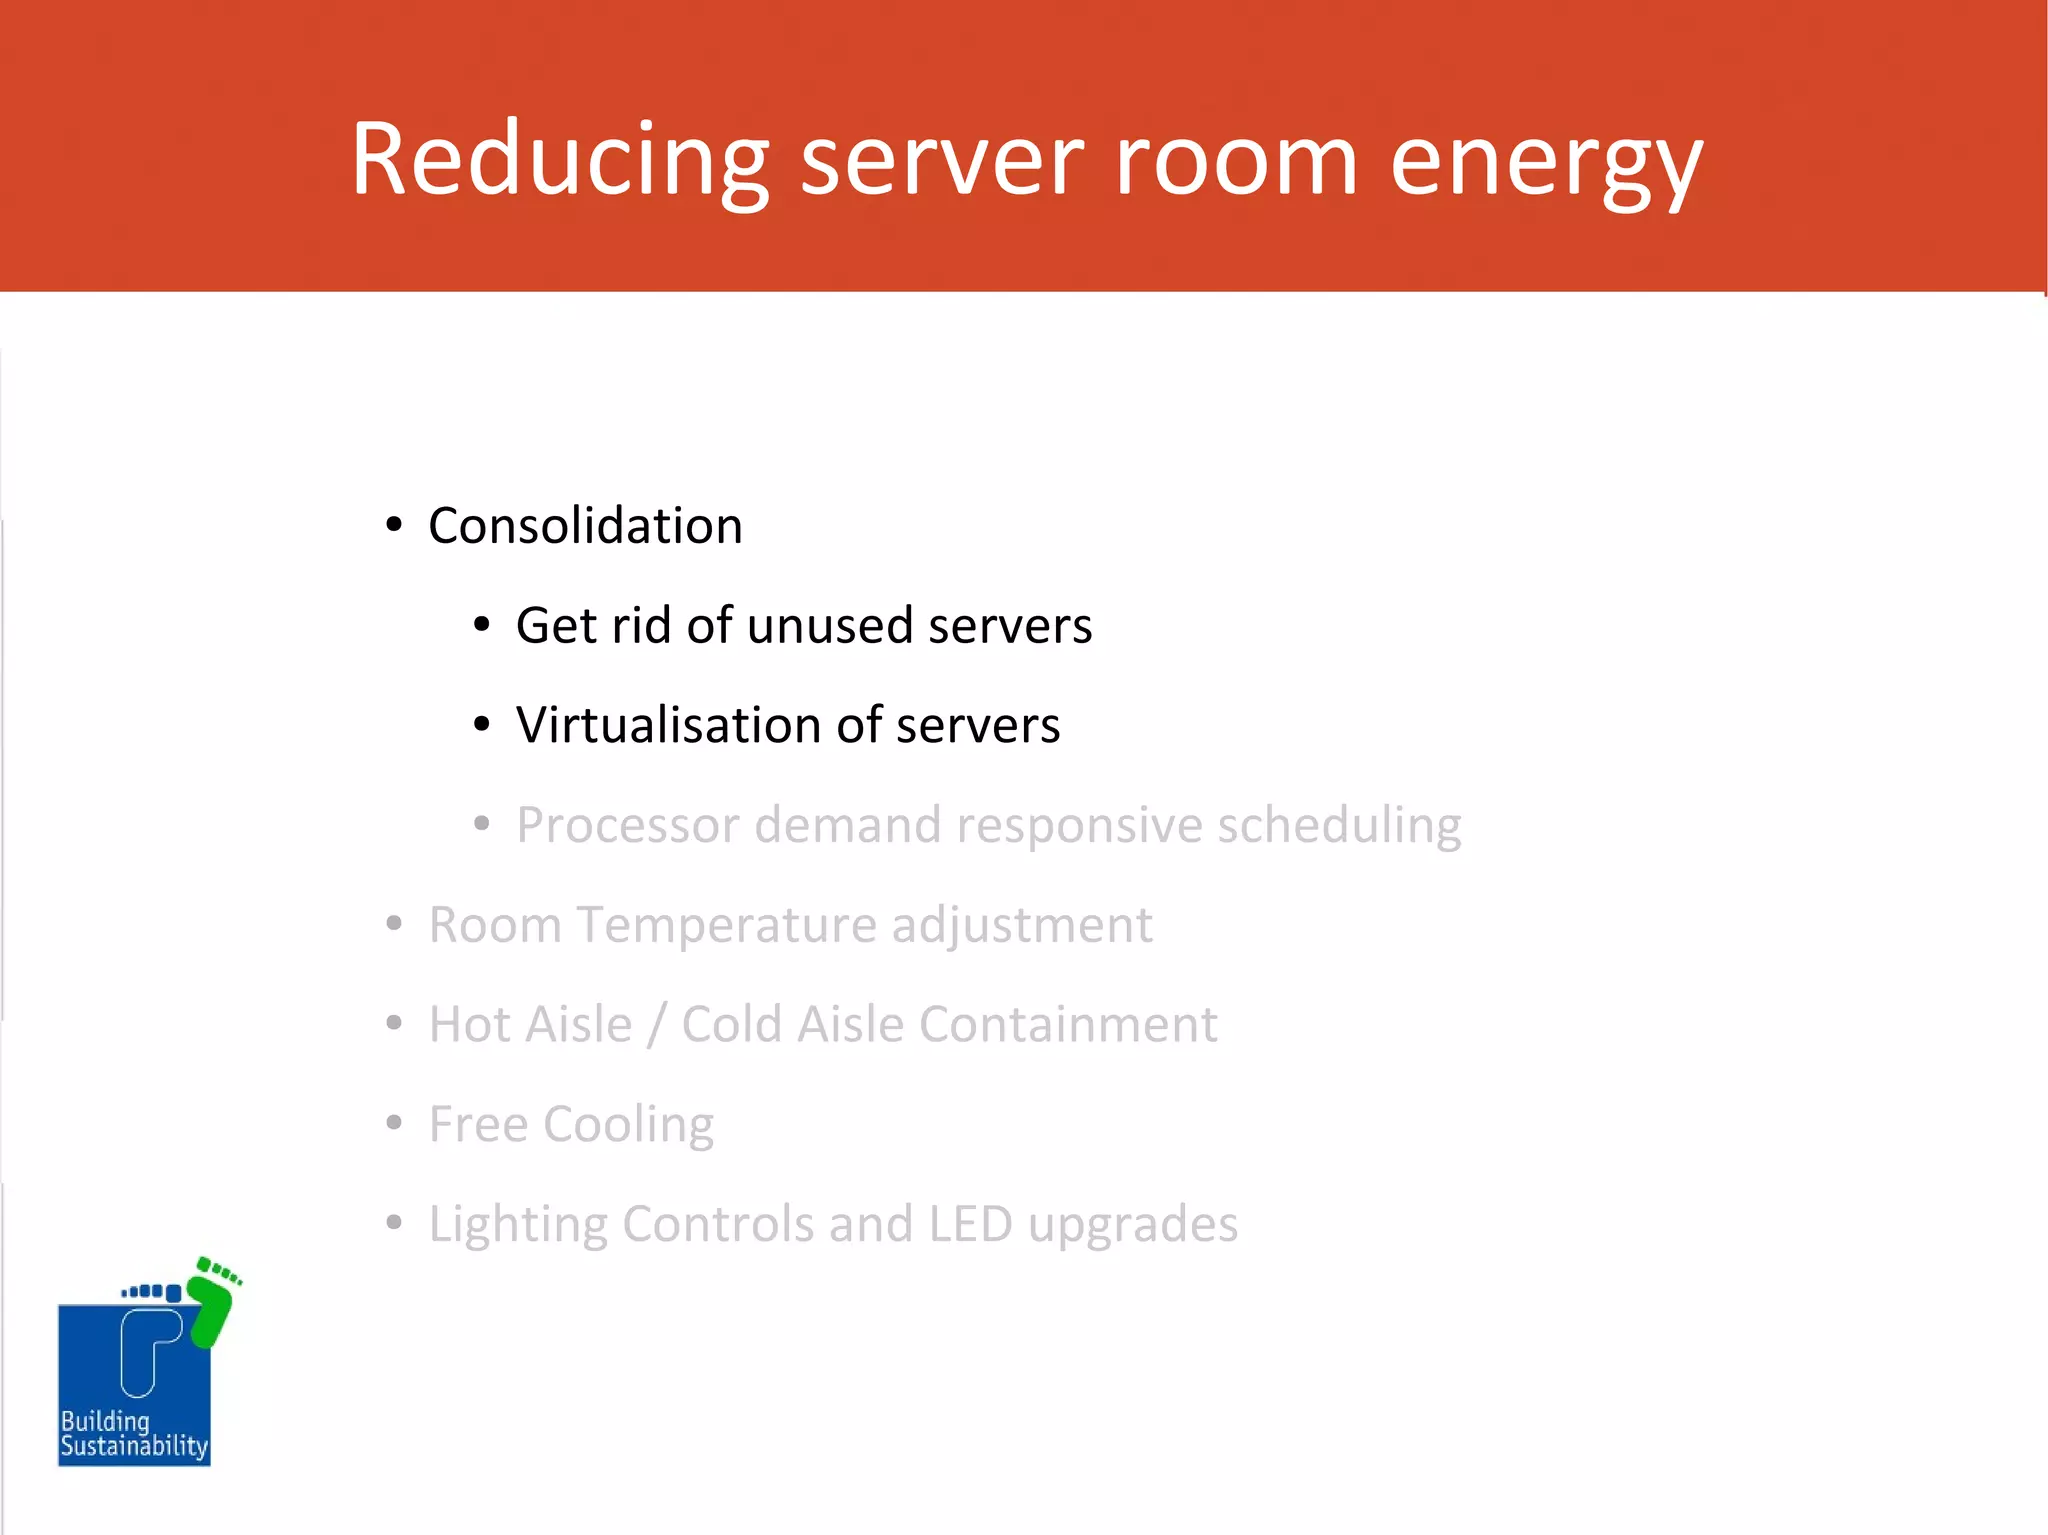
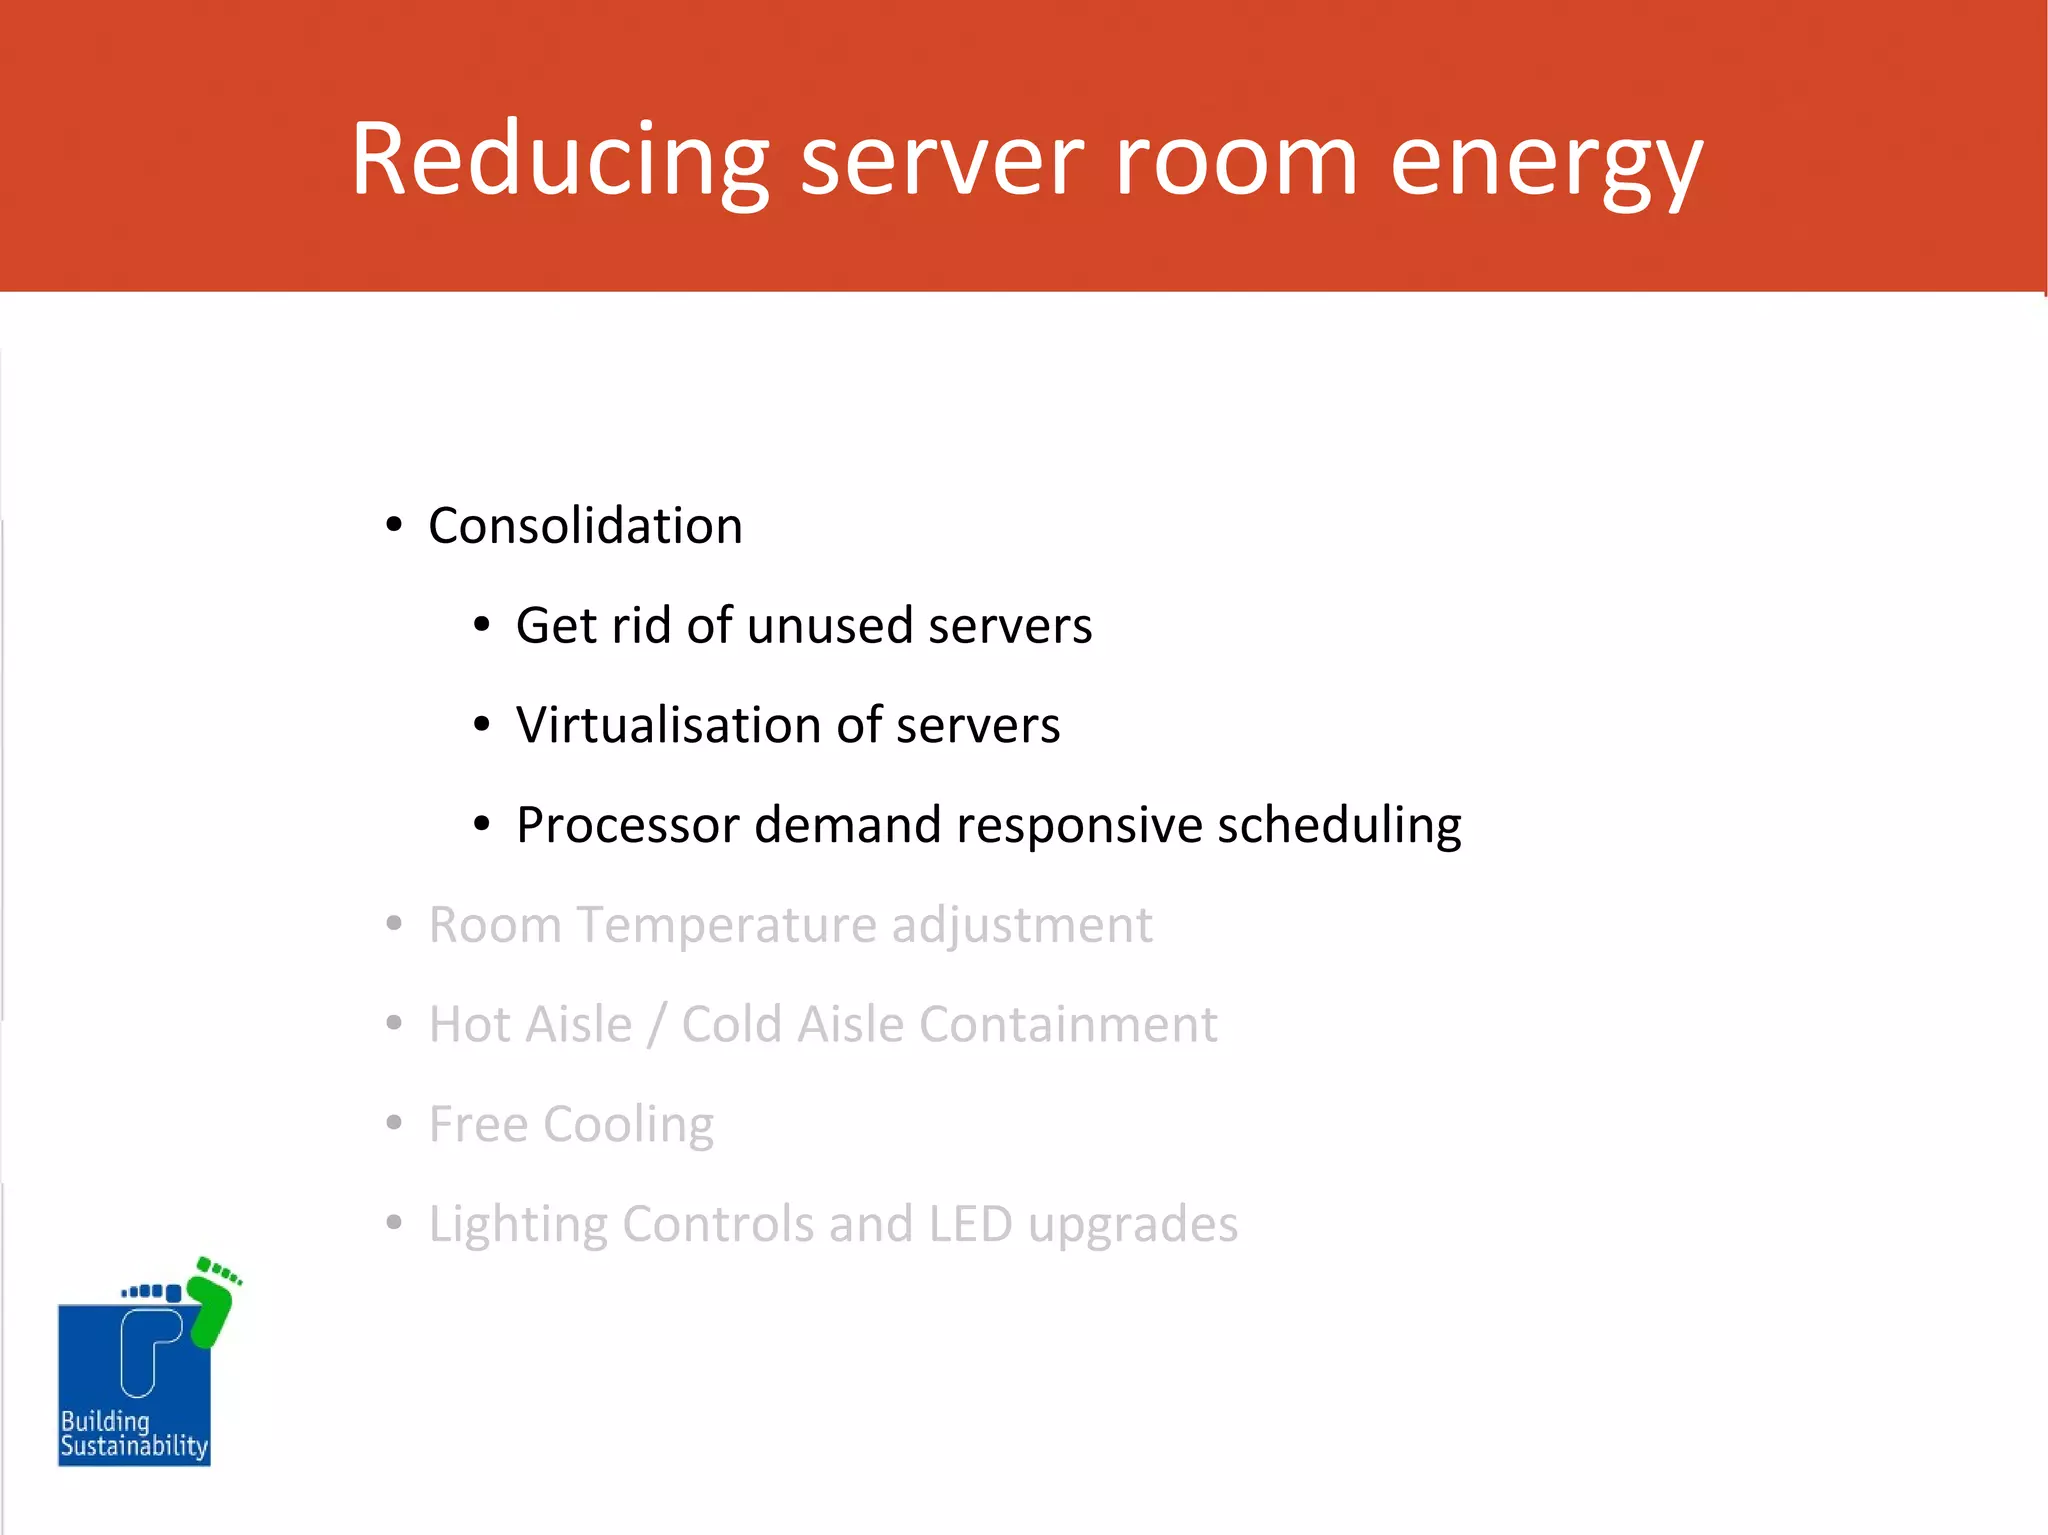
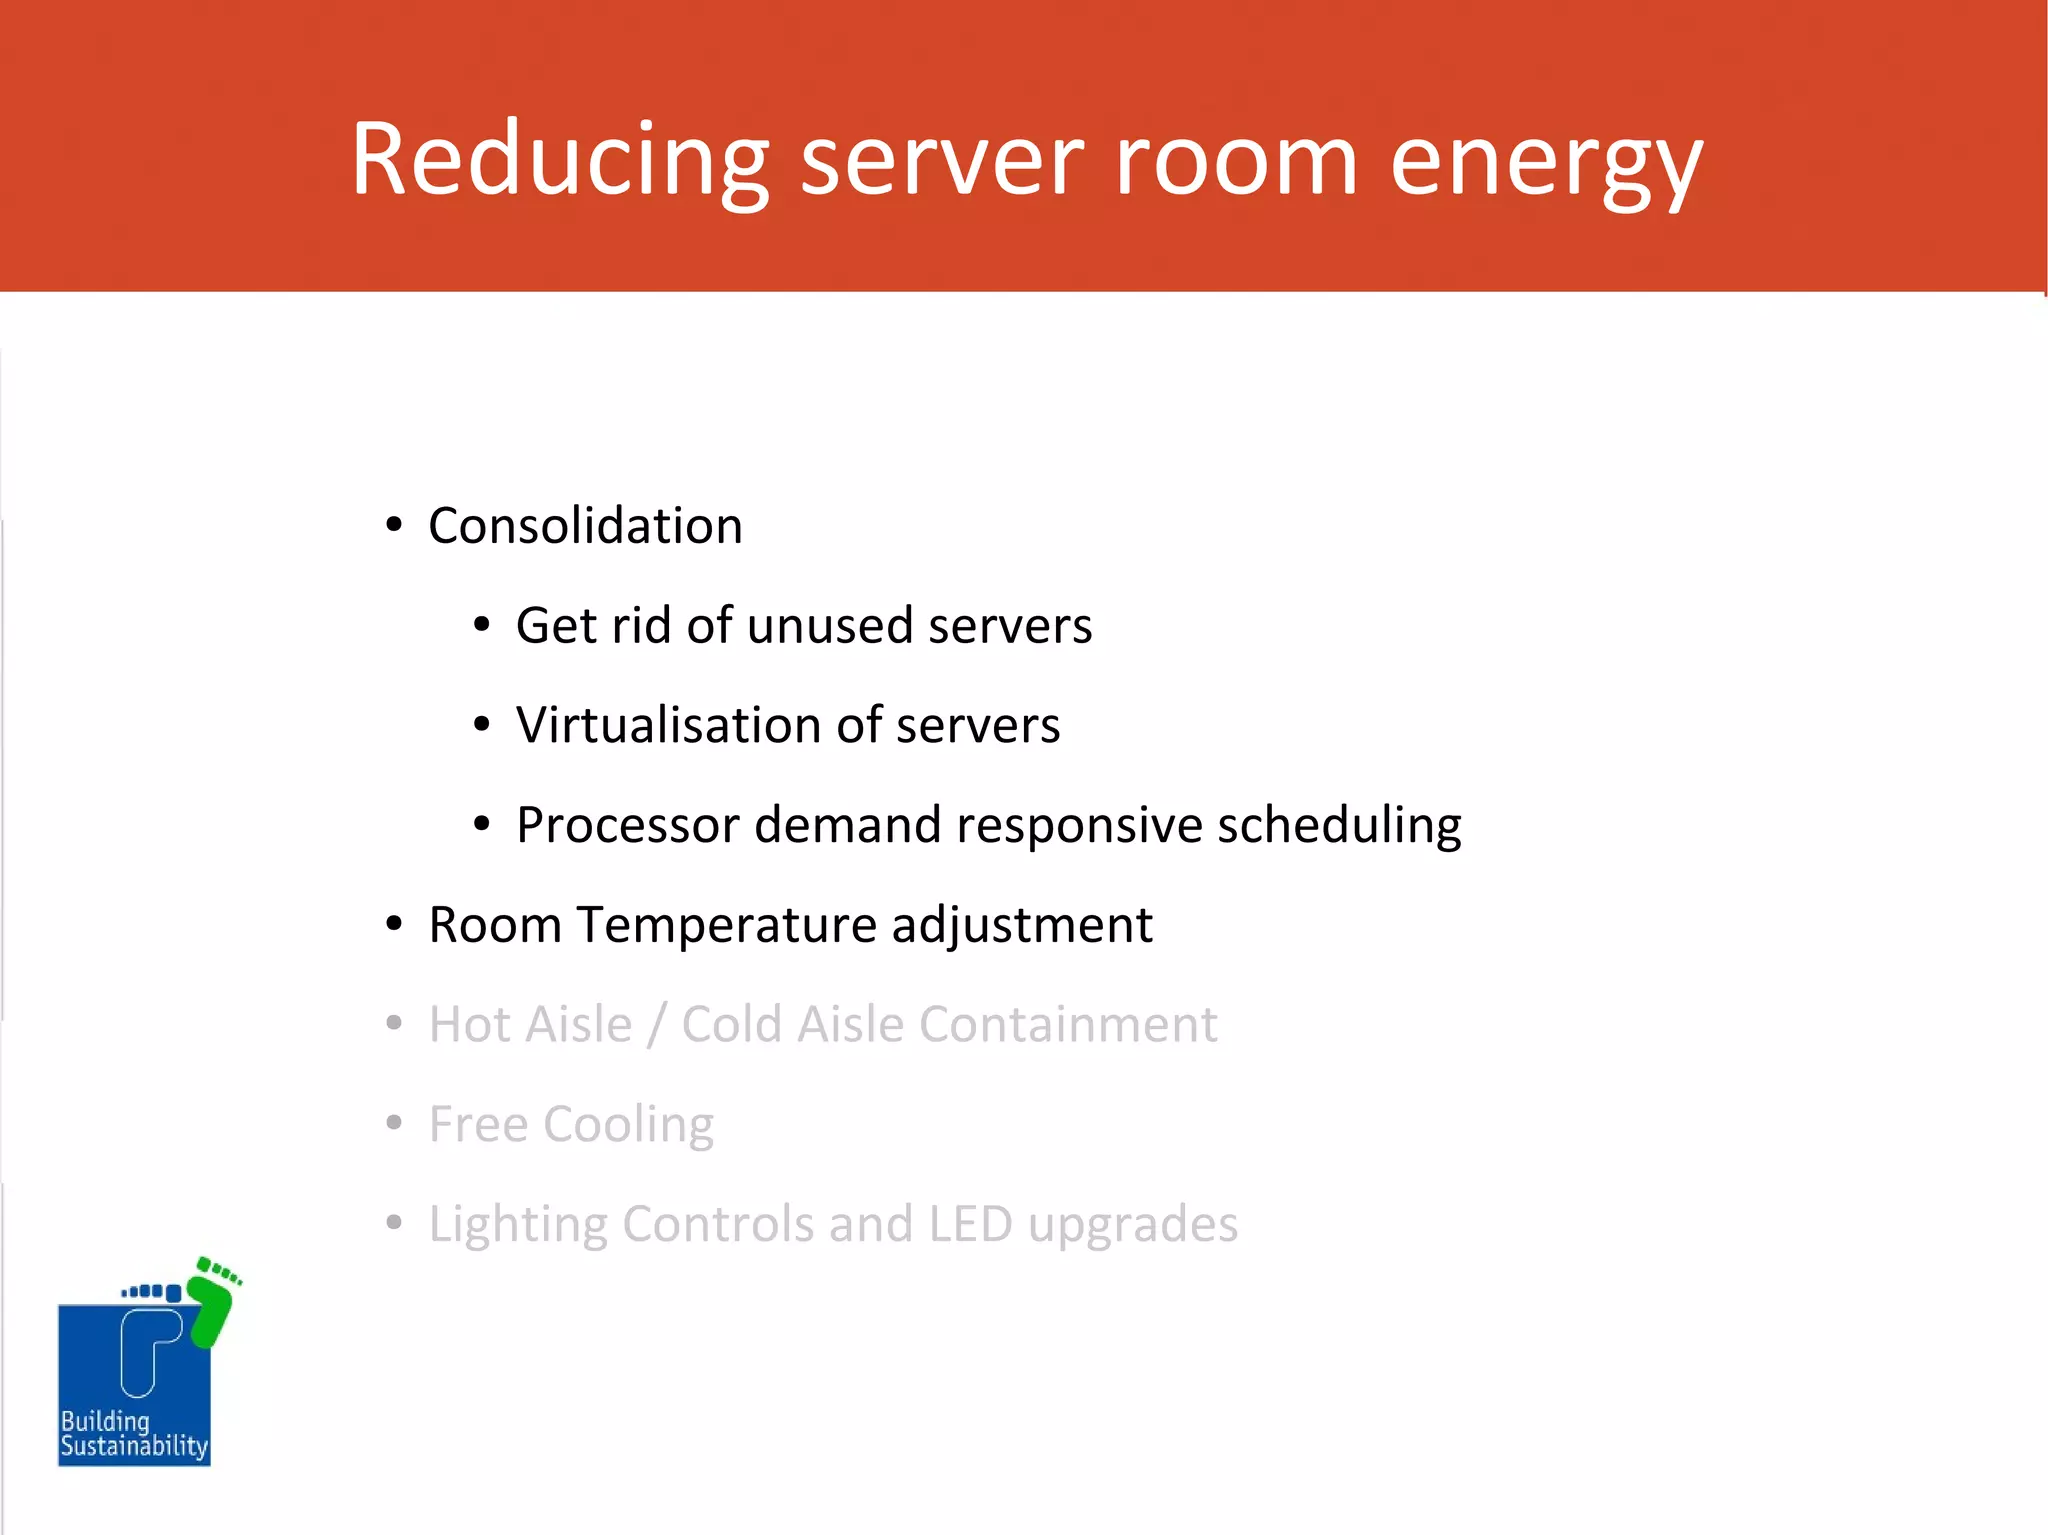
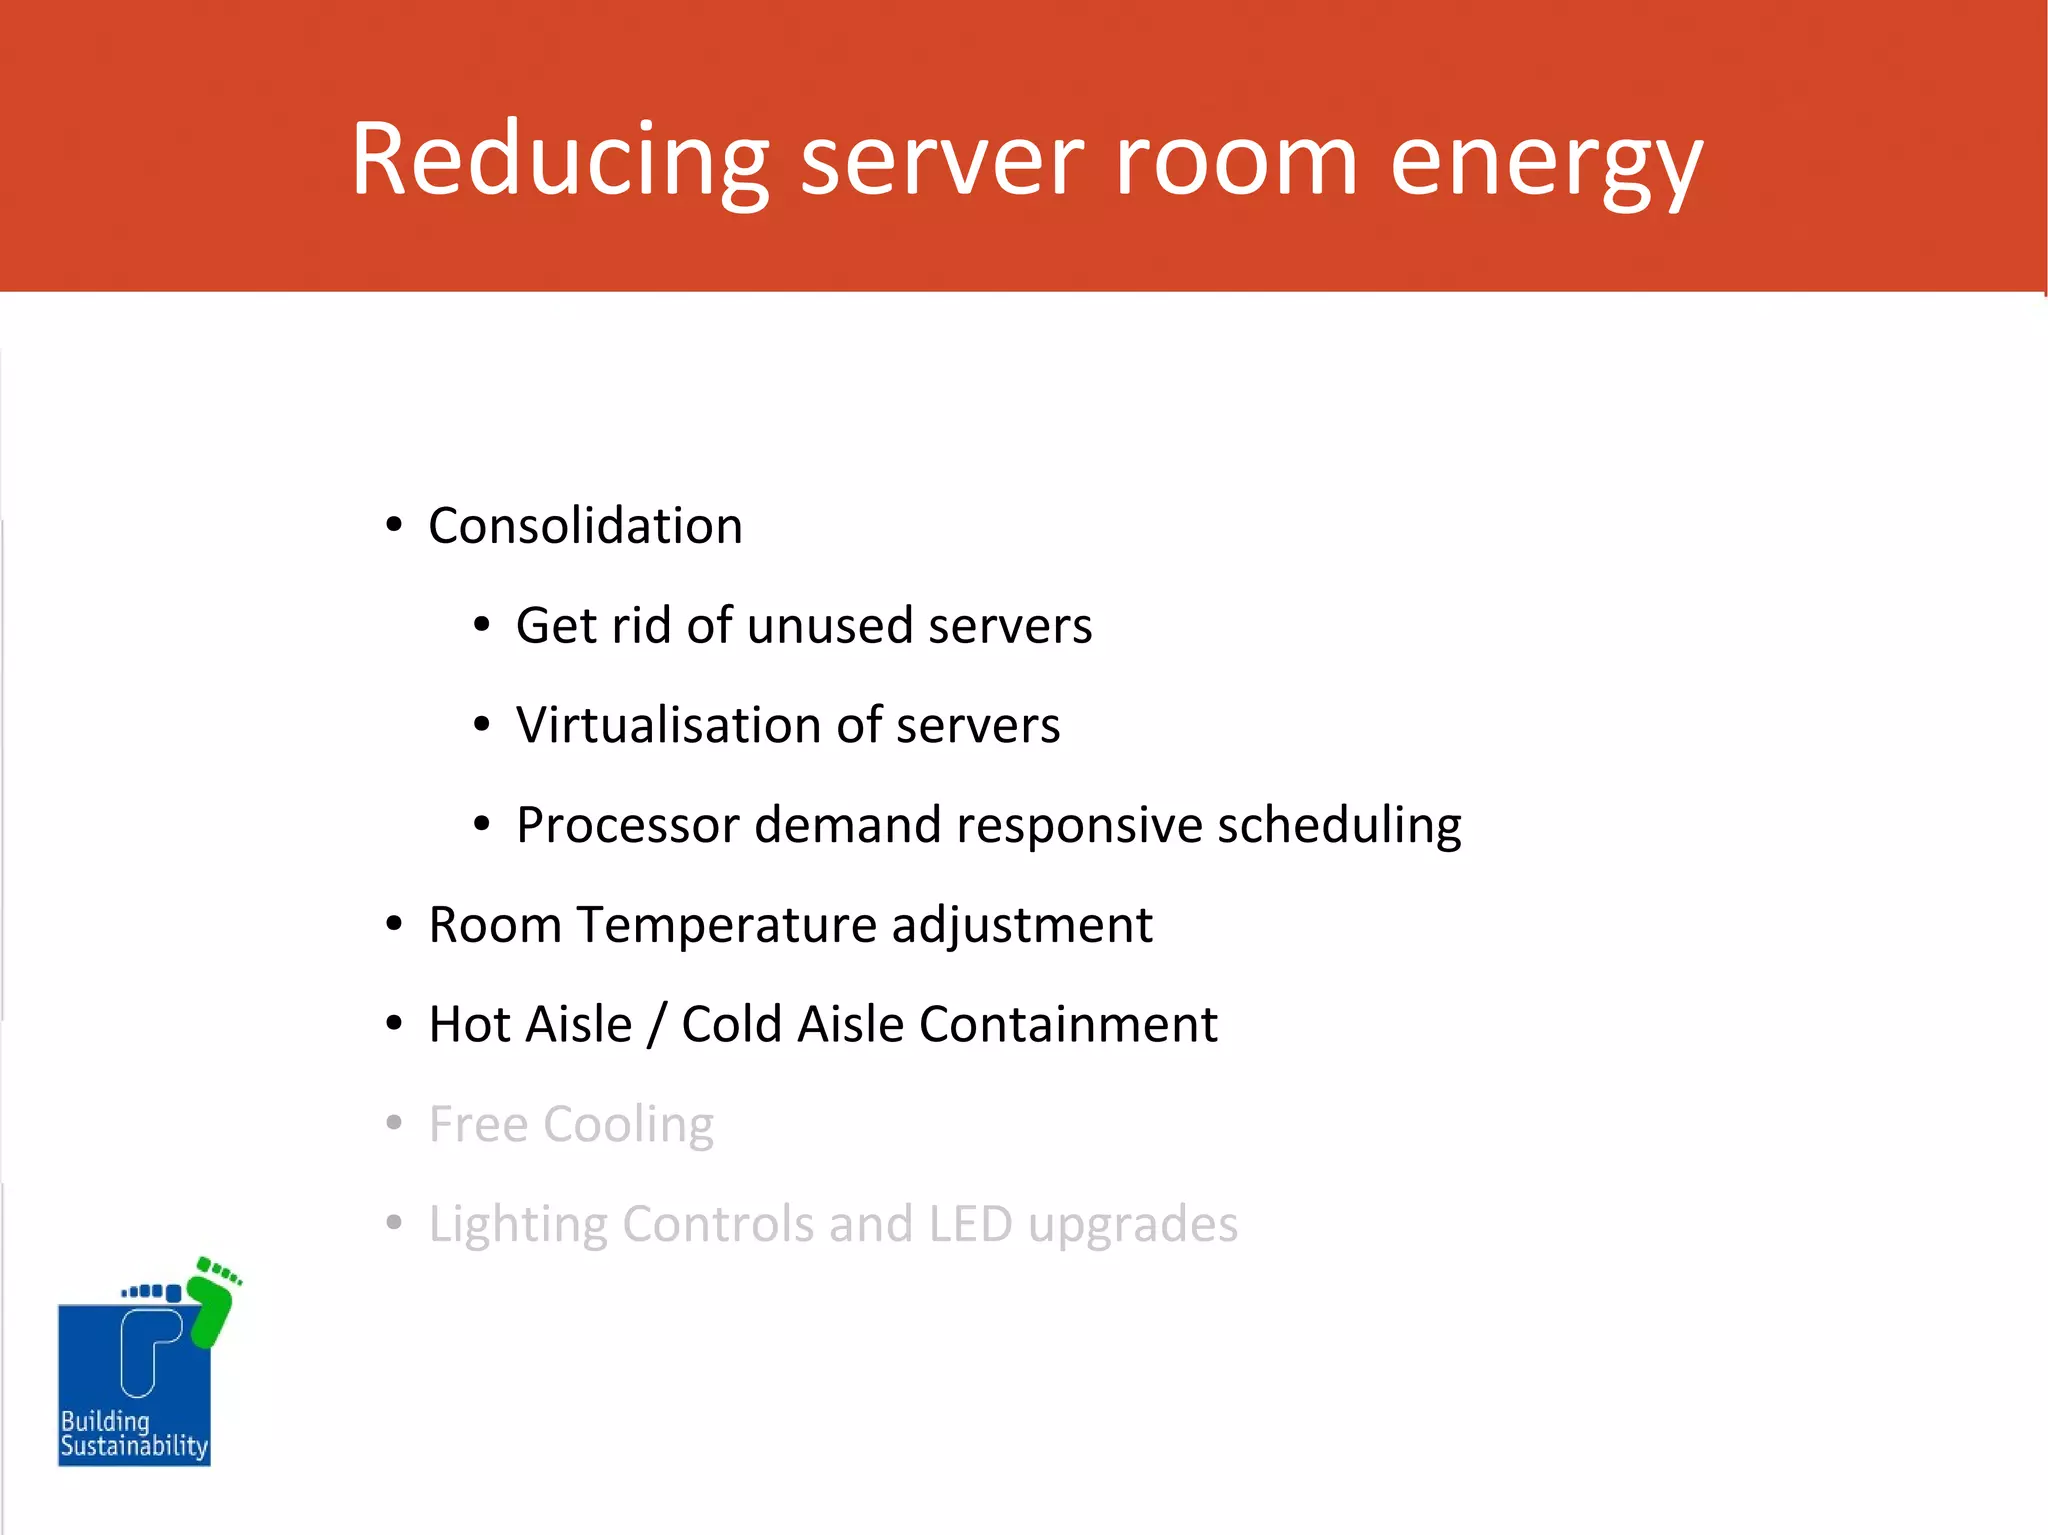
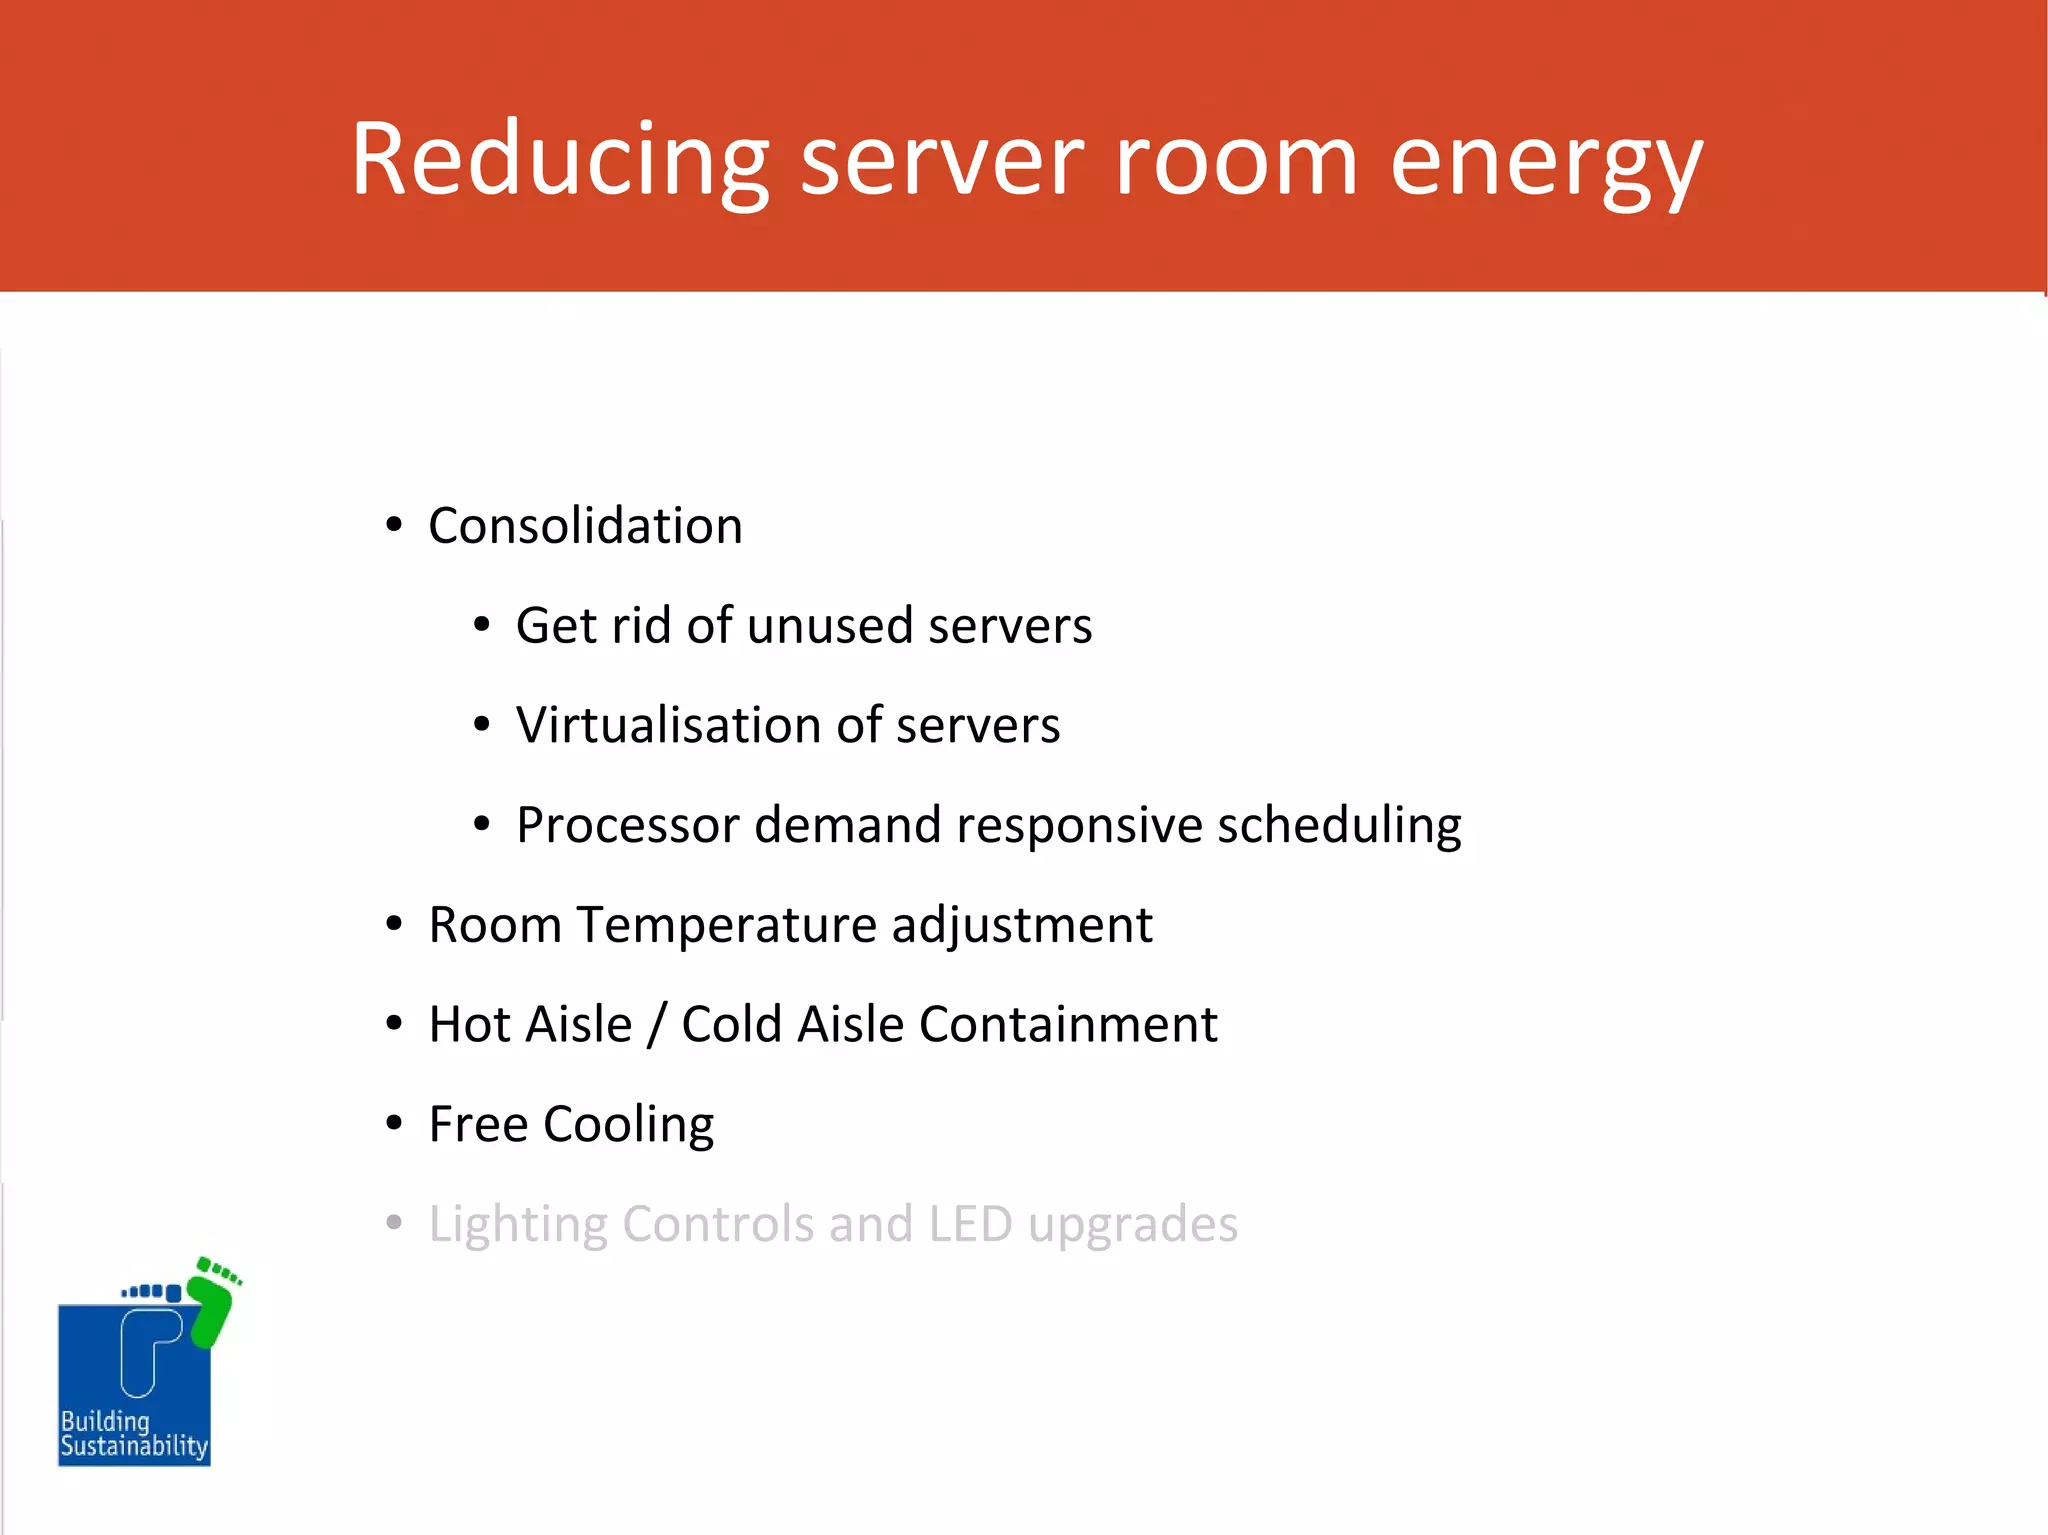
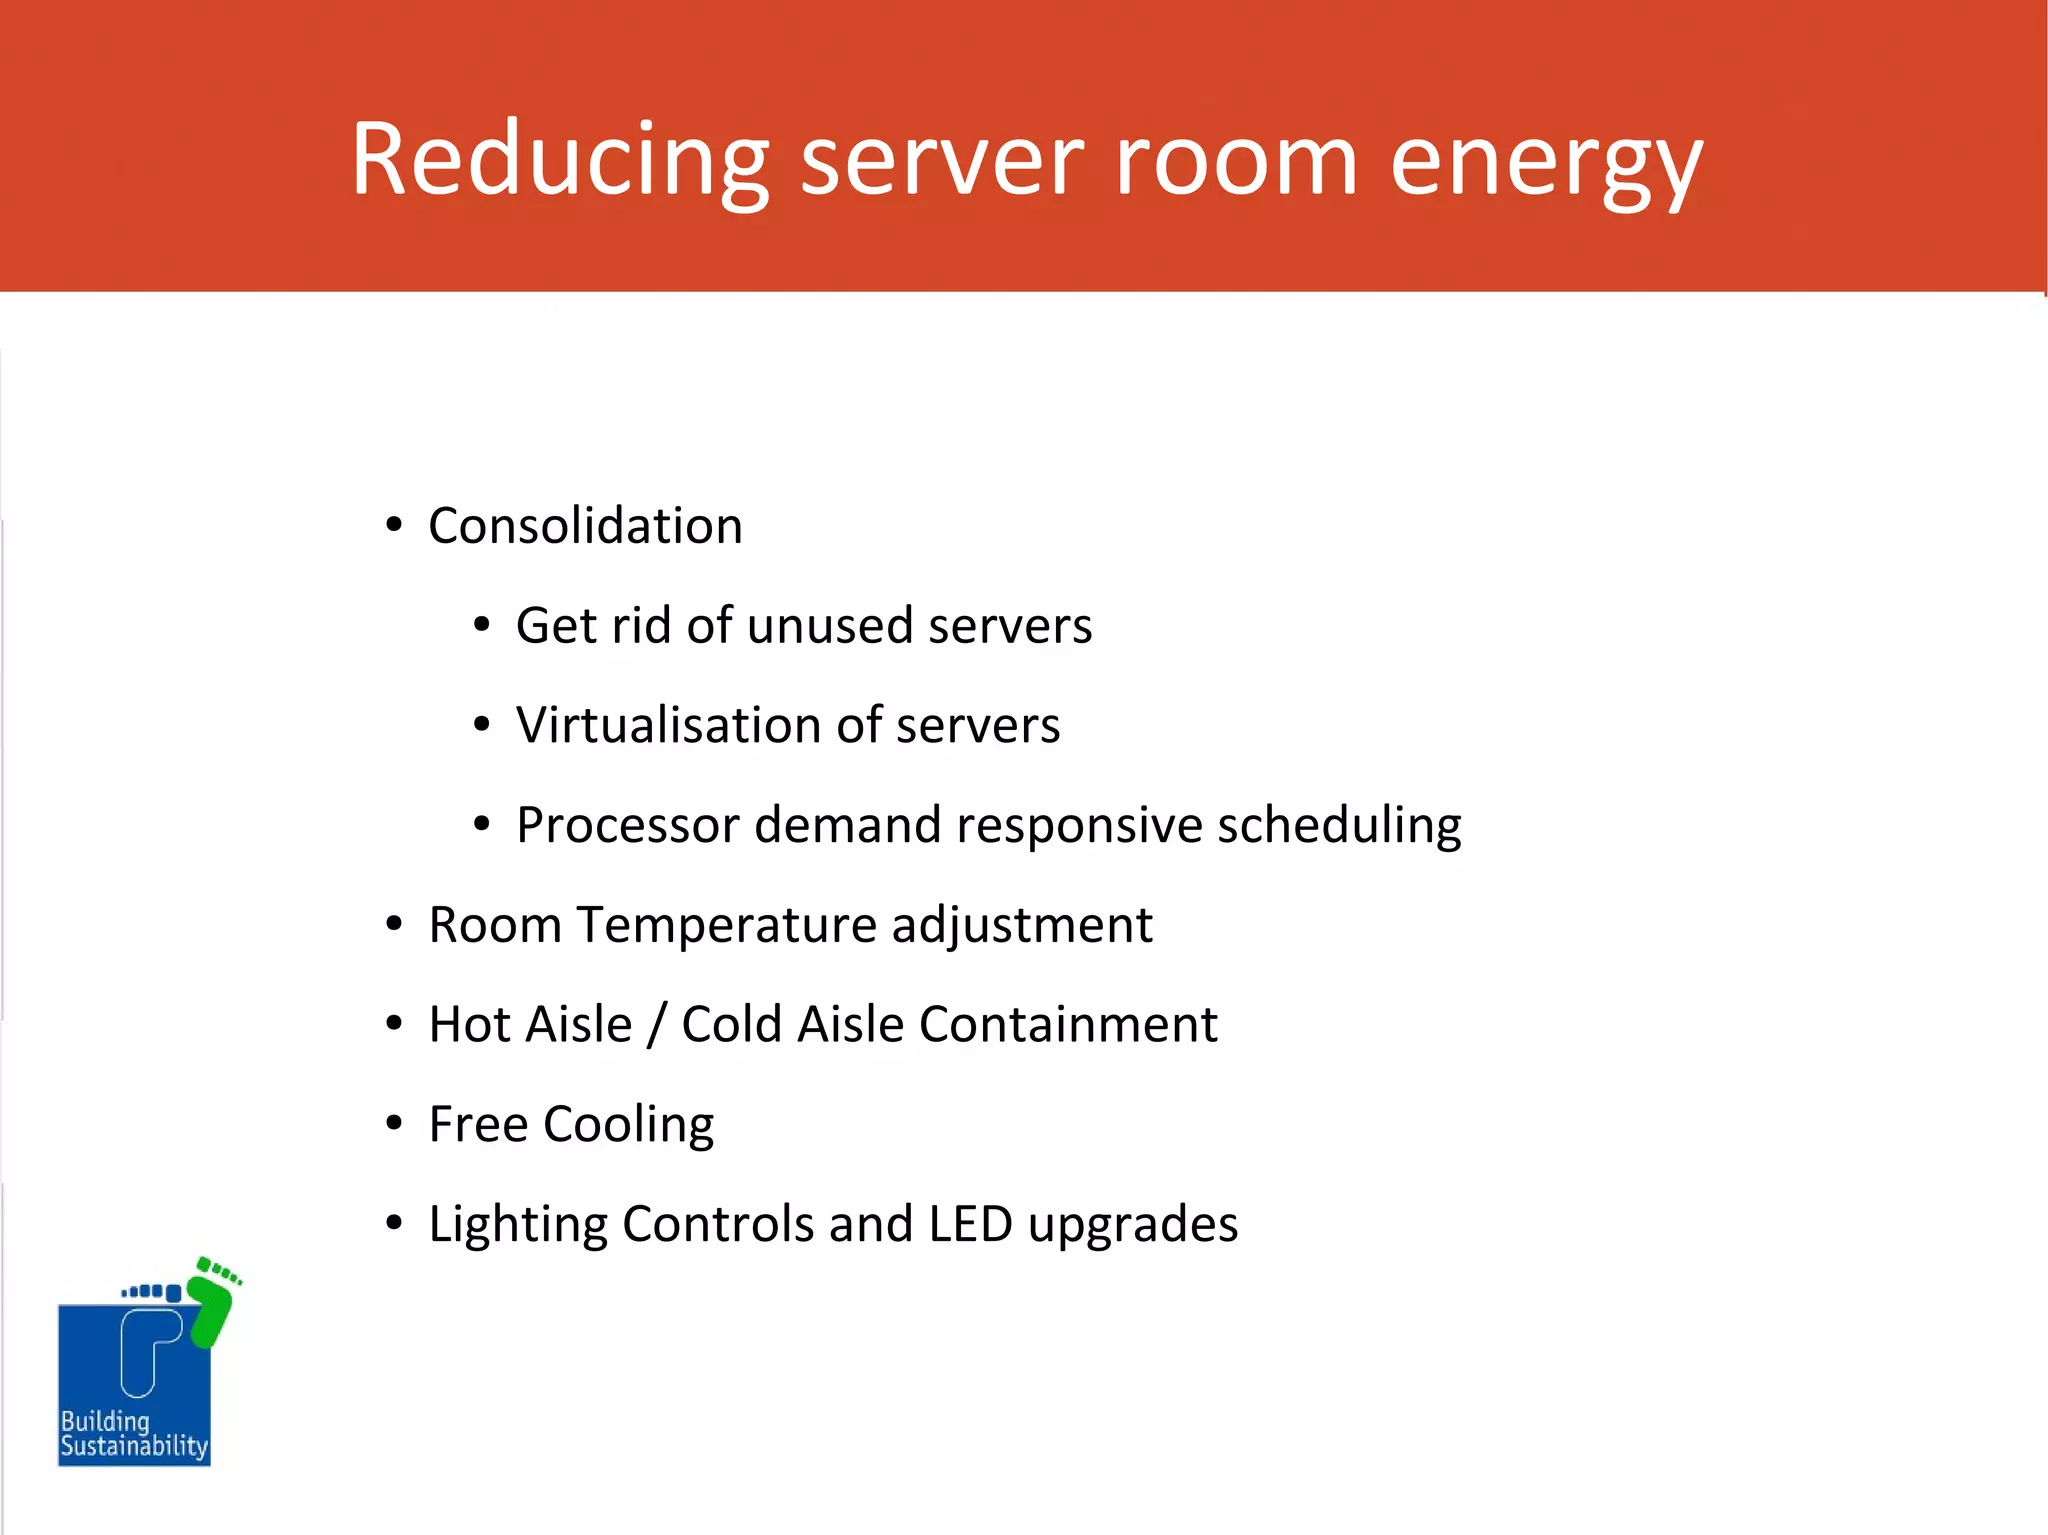
Webinar Series

Server Rooms – Energy Efficient Measures

Your Speakers
George
Bartley

Mikael
Soderman

David
Green
What we do?

Smartmeter and sensors
Information
System

Client Sites
Our data centre
Our clients target 40% carbon
emissions reduction by 2020
Target

Actual Consumption
But we have discovered a problem –
Server Rooms !!!

Many of our client have a targer to reduce
carbon emissions by 40%
Is there an Elephant in the room?
Ballooning Carbon

THE DCDI 2013 CENSUS UK FIGURES
The issue is our in-house server
rooms

THE DCDI 2013 CENSUS UK FIGURES
Your feedback on the issue
●

Poll 1

●

Is your server room energy
separately metered?

Poll 2

Can you measure the PUE in your
server room?
Conclusion

Get as many business applications moved off-site and onto the Cloud using an energy
efficient Data Centre provider - as soon as possible
Allocating a utility bill to the IT department is a must for encouraging management of this
issue.
If you identify with this issue could you please complete the server room survey on our website
www.buildingsustainability.net/survey/server_rooms.html
In-house Server Room(s) versus Outsourced Data Centre
In-house Server
Rooms

Outsourced
Data Centre
Can approach 90% using Cloud
Applications where multiple
tenants are using a single
application – servers are virtual
running on blade processors

Server
Utilisation

operate at less than 10% of
server processing capacity
- one server per application.

Cooling

90% overhead
– PUE of >1.9

10% overhead
Use of free/high efficient cooling
- PUE of 1.1

Energy
Management

Low priority - IT Manager
rarely even sees the Utility
Bill - Usually no separate
energy monitoring

Top Priority - Managing energy is
core to the business process and is
linked to bottom line profitability
and used to attract clients
In-house Server Room(s) versus Outsourced Data Centre
Reducing server room energy

●

Consolidation
●

Get rid of unused servers

●

Virtualisation of servers

●

Processor demand responsive scheduling

●

Room Temperature adjustment

●

Hot Aisle / Cold Aisle Containment

●

Free Cooling

●

Lighting Controls and LED upgrades
Reducing server room energy

●

Consolidation
●

Get rid of unused servers

●

Virtualisation of servers

●

Processor demand responsive scheduling

●

Room Temperature adjustment

●

Hot Aisle / Cold Aisle Containment

●

Free Cooling

●

Lighting Controls and LED upgrades
Reducing server room energy

●

Consolidation
●

Get rid of unused servers

●

Virtualisation of servers

●

Processor demand responsive scheduling

●

Room Temperature adjustment

●

Hot Aisle / Cold Aisle Containment

●

Free Cooling

●

Lighting Controls and LED upgrades
Reducing server room energy

●

Consolidation
●

Get rid of unused servers

●

Virtualisation of servers

●

Processor demand responsive scheduling

●

Room Temperature adjustment

●

Hot Aisle / Cold Aisle Containment

●

Free Cooling

●

Lighting Controls and LED upgrades
Reducing server room energy

●

Consolidation
●

Get rid of unused servers

●

Virtualisation of servers

●

Processor demand responsive scheduling

●

Room Temperature adjustment

●

Hot Aisle / Cold Aisle Containment

●

Free Cooling

●

Lighting Controls and LED upgrades
Reducing server room energy

●

Consolidation
●

Get rid of unused servers

●

Virtualisation of servers

●

Processor demand responsive scheduling

●

Room Temperature adjustment

●

Hot Aisle / Cold Aisle Containment

●

Free Cooling

●

Lighting Controls and LED upgrades
Reducing server room energy

●

Consolidation
●

Get rid of unused servers

●

Virtualisation of servers

●

Processor demand responsive scheduling

●

Room Temperature adjustment

●

Hot Aisle / Cold Aisle Containment

●

Free Cooling

●

Lighting Controls and LED upgrades
Reducing server room energy

●

Consolidation
●

Get rid of unused servers

●

Virtualisation of servers

●

Processor demand responsive scheduling

●

Room Temperature adjustment

●

Hot Aisle / Cold Aisle Containment

●

Free Cooling

●

Lighting Controls and LED upgrades
Reducing server room energy

●

Consolidation
●

Get rid of unused servers

●

Virtualisation of servers

●

Processor demand responsive scheduling

●

Room Temperature adjustment

●

Hot Aisle / Cold Aisle Containment

●

Free Cooling

●

Lighting Controls and LED upgrades
Monitor server room energy

We need the right tools!
The Footprint Tracker
Services Grouping
Navigating the data
Navigating the data
Navigating the data
Navigating the data
Managing projects
CuSum
Live ROI Tracker
Blog
Blog
Digital Signage
●

●

●

Content managed
Connects to most types of
screens
Using Android or Raspberry Pi
hardware
Casestudy
David Green
Department of Engineering
University of Cambridge
Department of Engineering Overview

•

Accounts for around 10% of
university.

•

Activities based in 7 buildings.

•

Around 600 members of staff

•

•

Four year M.Eng course – around
1,200 students.
Postgraduate students numbers:
•

2011 (792) - 2012 (830)

34
The Problem
Background
•

•

Approach

Initially a distributed arrangement.

•

Centralised computing resources in two computer
rooms (34 racks,12 racks)

•

Pre 2010 Cooling Arrangement
•

•

KJ Tait feasibility
study
Support from the
University’s Estate
Management

Refrigerant based CRAC system, full recirculation via
under floor plenum

•

Computing Staff

63kW plug-load

•

Salix Funding

Key Project Drivers
•

University Energy Incentivisation Scheme (EIS)

•

Further server purchases planned

•

IT electricity consumption is a significant part of the
Department’s energy base load
35
The Solution - Installation

Cold aisle
containment

EC Extract Fans

Ambient air
through louver

Self contained
plant room

No raised floor
6 EcoCooling
CREC’s giving
150kW N+1

36
30/06/2010

29/06/2010

28/06/2010

27/06/2010

624

633

830
772

745

863

1069

1284

1574

1568

1528

1584

1601

1546

1525

1525

1525

1506

1458

1474

1457

1493

1587

1565

1492

June 2010 - kWh used per day, per consumer unit

26/06/2010

25/06/2010

908

1000

24/06/2010

23/06/2010

848

IT Load
1200
~63kW

781

831

850

850

851

826

866

852

823

837

837

1400

22/06/2010

21/06/2010

20/06/2010

19/06/2010

18/06/2010

17/06/2010

16/06/2010

15/06/2010

14/06/2010

13/06/2010

12/06/2010

11/06/2010

10/06/2010

09/06/2010

08/06/2010

07/06/2010

06/06/2010

840

866

810

`

05/06/2010

04/06/2010

03/06/2010

02/06/2010

800
791

1600

01/06/2010

•

kWhr

Before – Energy Use 2010
Air-con Units kWh used

Racks Units kWh used

1800

PUE of 1.65

600

400
Cooling and
Lighting
200
~35kW

0

37
0
0

600
1000

400

200
500
633

840

866

837

96

96

810

96

09/06/2010
09/06/2011
10/06/2010
10/06/2011

96

103
128

15/06/2010
15/06/2011
16/06/2010
16/06/2011
17/06/2010
17/06/2011

178

22/06/2010
22/06/2011
23/06/2010
23/06/2011

170

175

260

830
772

745

863

908

848

781

831

1069

1200
2000

30/06/2010
30/06/2011

29/06/2010
29/06/2011

28/06/2010
28/06/2011

27/06/2010
27/06/2011

26/06/2010
26/06/2011

25/06/2010
25/06/2011

175

180

21/06/2010
21/06/2011

850

850

851

826

866

1000

24/06/2010
24/06/2011

168

20/06/2010
20/06/2011

19/06/2010
19/06/2011
159

98

14/06/2010
14/06/2011

18/06/2010
18/06/2011

97

13/06/2010
13/06/2011

12/06/2010
12/06/2011

11/06/2010
11/06/2011

1458
2356

2184

2058

2210

2279

2239

1284
2220

2203

2191

2237

2255

1528

1584

1601

1546

1525

1525

23931525

2300 1506

2221

1574

1568

2298 1474

2325

1587

1565

1493

2254 1457

2190

2232

2294

2315 1492

June 2010 -- kWh used per day, per consumer unit
2011 kWh used per day, per consumer unit

624

823

106

08/06/2010
08/06/2011

852

837

103

07/06/2010
07/06/2011

109

06/06/2010
06/06/2011

05/06/2010
05/06/2011

04/06/2010
04/06/2011

03/06/2010
03/06/2011

800

96

2500

791

1400

02/06/2010
02/06/2011

1500

98

1600

01/06/2010
01/06/2011

kWhr
kWhr

The Results – Energy Use 2011
Air-con Units kWh used

Racks Units kWh used

1800
3000

PUE of 1.1

38
Engineering’s Data Centre electrical loads

•

300 MWh electrical base load

•

Pre 2010 – 35% = Server rooms

•

•

Now 2 x Data Centres and 23% of
base load
Purchasing vs energy performance

39
Risks – Reliability and Maintenance

•

•

•

•

•

Initially maintenance was not
comprehensively scheduled
Location - surprising amount of
large fibres caught by insect
screen in the Spring
3 monthly maintenance of the
equipment is required
Routine ‘deep’ cleaning of
facility to ISO 7
With internal installation room
cleanliness needs to be
maintained
40
What next?
•

Move as many applications to “The Cloud” as
possible minimising the number of in-house servers

•

Sub-meter all server rooms and measure PUE

•

Rationalise in-house servers
–

•

identify redundant equipment and power
down

Assess the potential to reduce the PUE in you
server rooms
–
–

•

Increase Room temperature
Implement hot/aisle containment

Come and discuss your plans with Building
Further reading
http://www.buildingsustainability.net
http://www.talkingbuilding.co.uk
https://www.facebook.com/BuildingSustainabilityLtd
https://twitter.com/BSLEnergyTeam
Phone: +44 20 7193 8967

Server room presentation 16th january 2014