Download to read offline


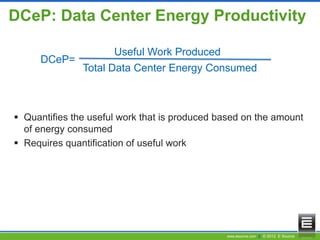


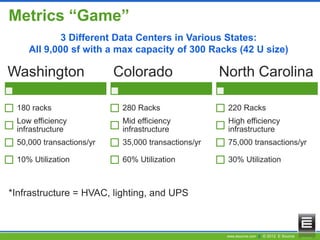


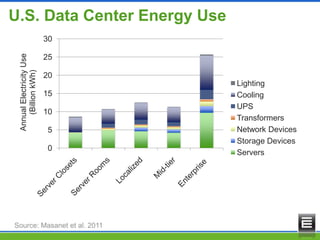


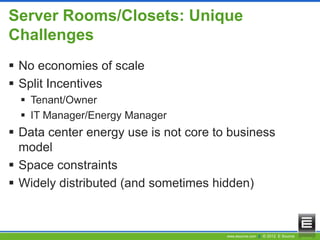


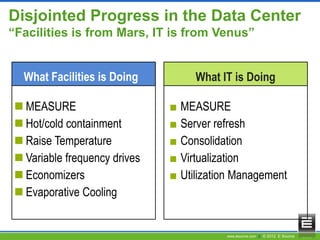


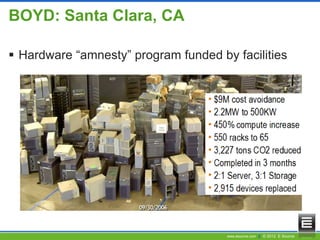
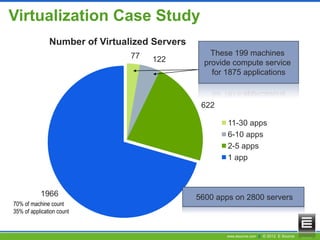
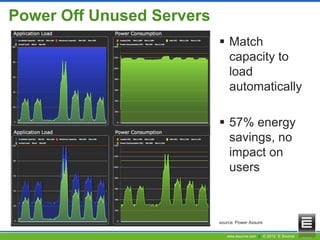


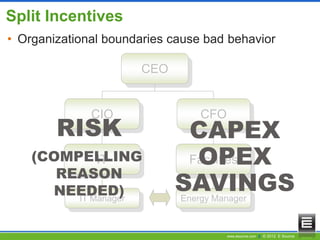


This document discusses best practices for improving efficiency in small server rooms and closets. It begins with an introduction on metrics to measure efficiency like PUE, CUE, and RUE. Unique challenges for small spaces are split incentives and lack of scale. Best practices discussed include improving infrastructure efficiency through techniques like hot/cold aisle containment and raising temperature setpoints. Improving IT efficiency through server refresh, consolidation, virtualization and powering off unused servers is also covered. Case studies show significant potential savings through these approaches.