Download to read offline

![Scope and Application:-
This standard operating procedure (SOP)
describes the measurement of pH (the ratio of
hydrogen [H+] and hydroxyl [OH-] ion
activities at a given temperature) of soils using
a Cole-Palmer Digi-Sense® digital
pH/millivolt/oxidation reduction potential
(pH/mV/ORP) meter](https://image.slidesharecdn.com/541037e4-a879-49b3-a6a2-770935894fb6-160210130835/75/AmanPOWER-POINT-17-2048.jpg)
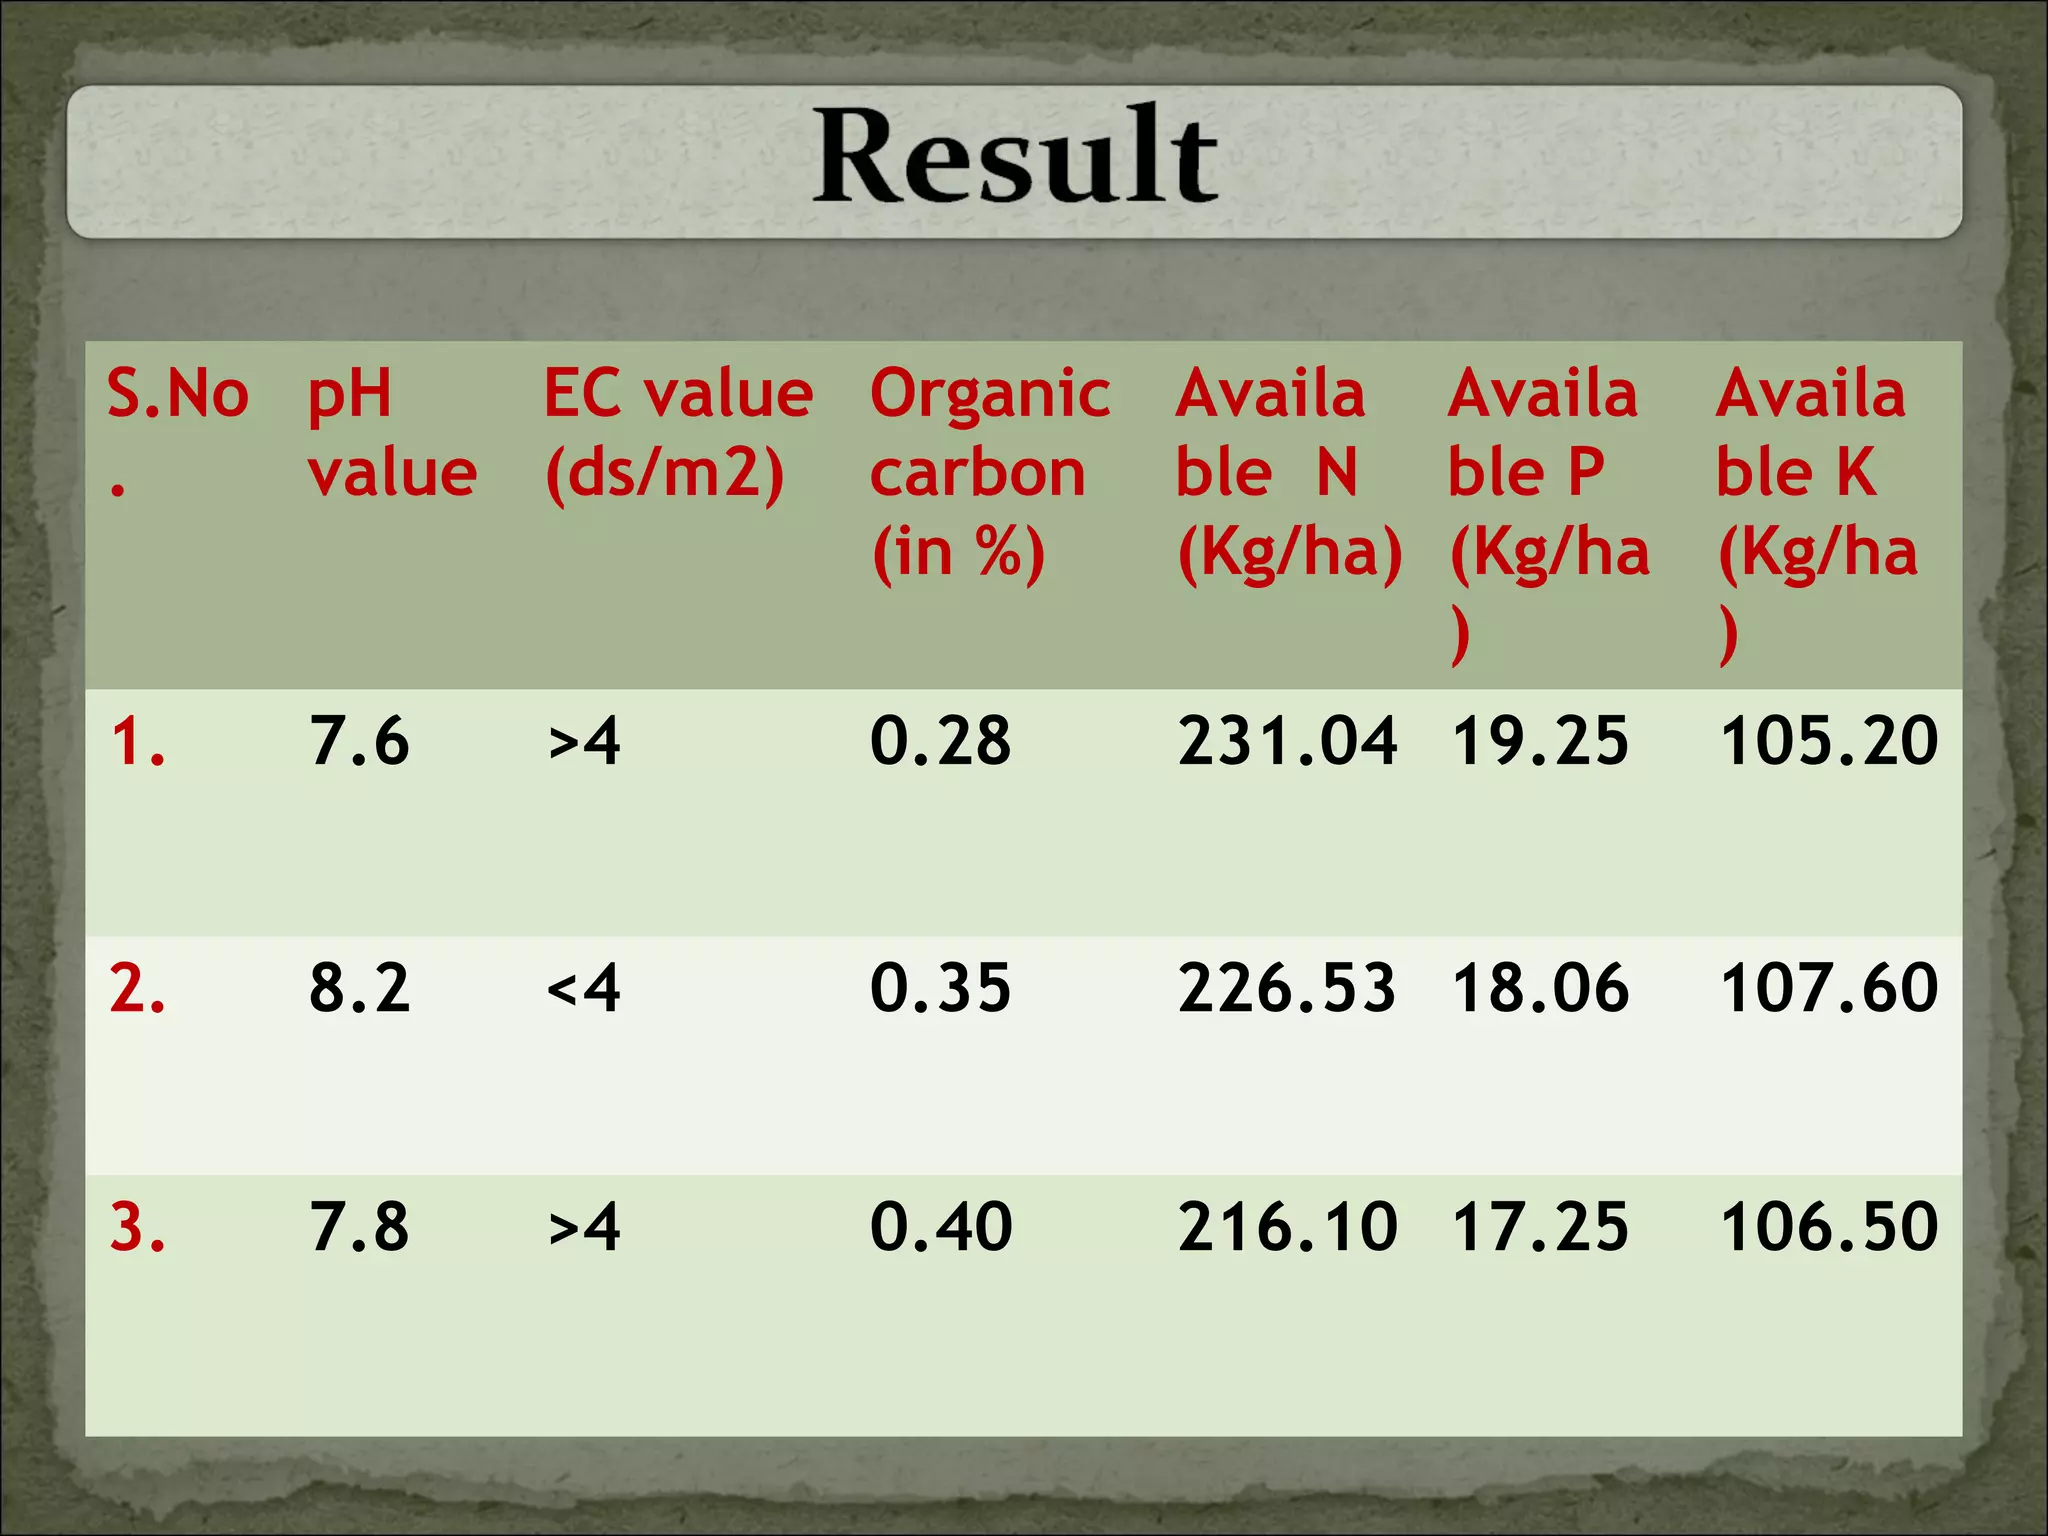
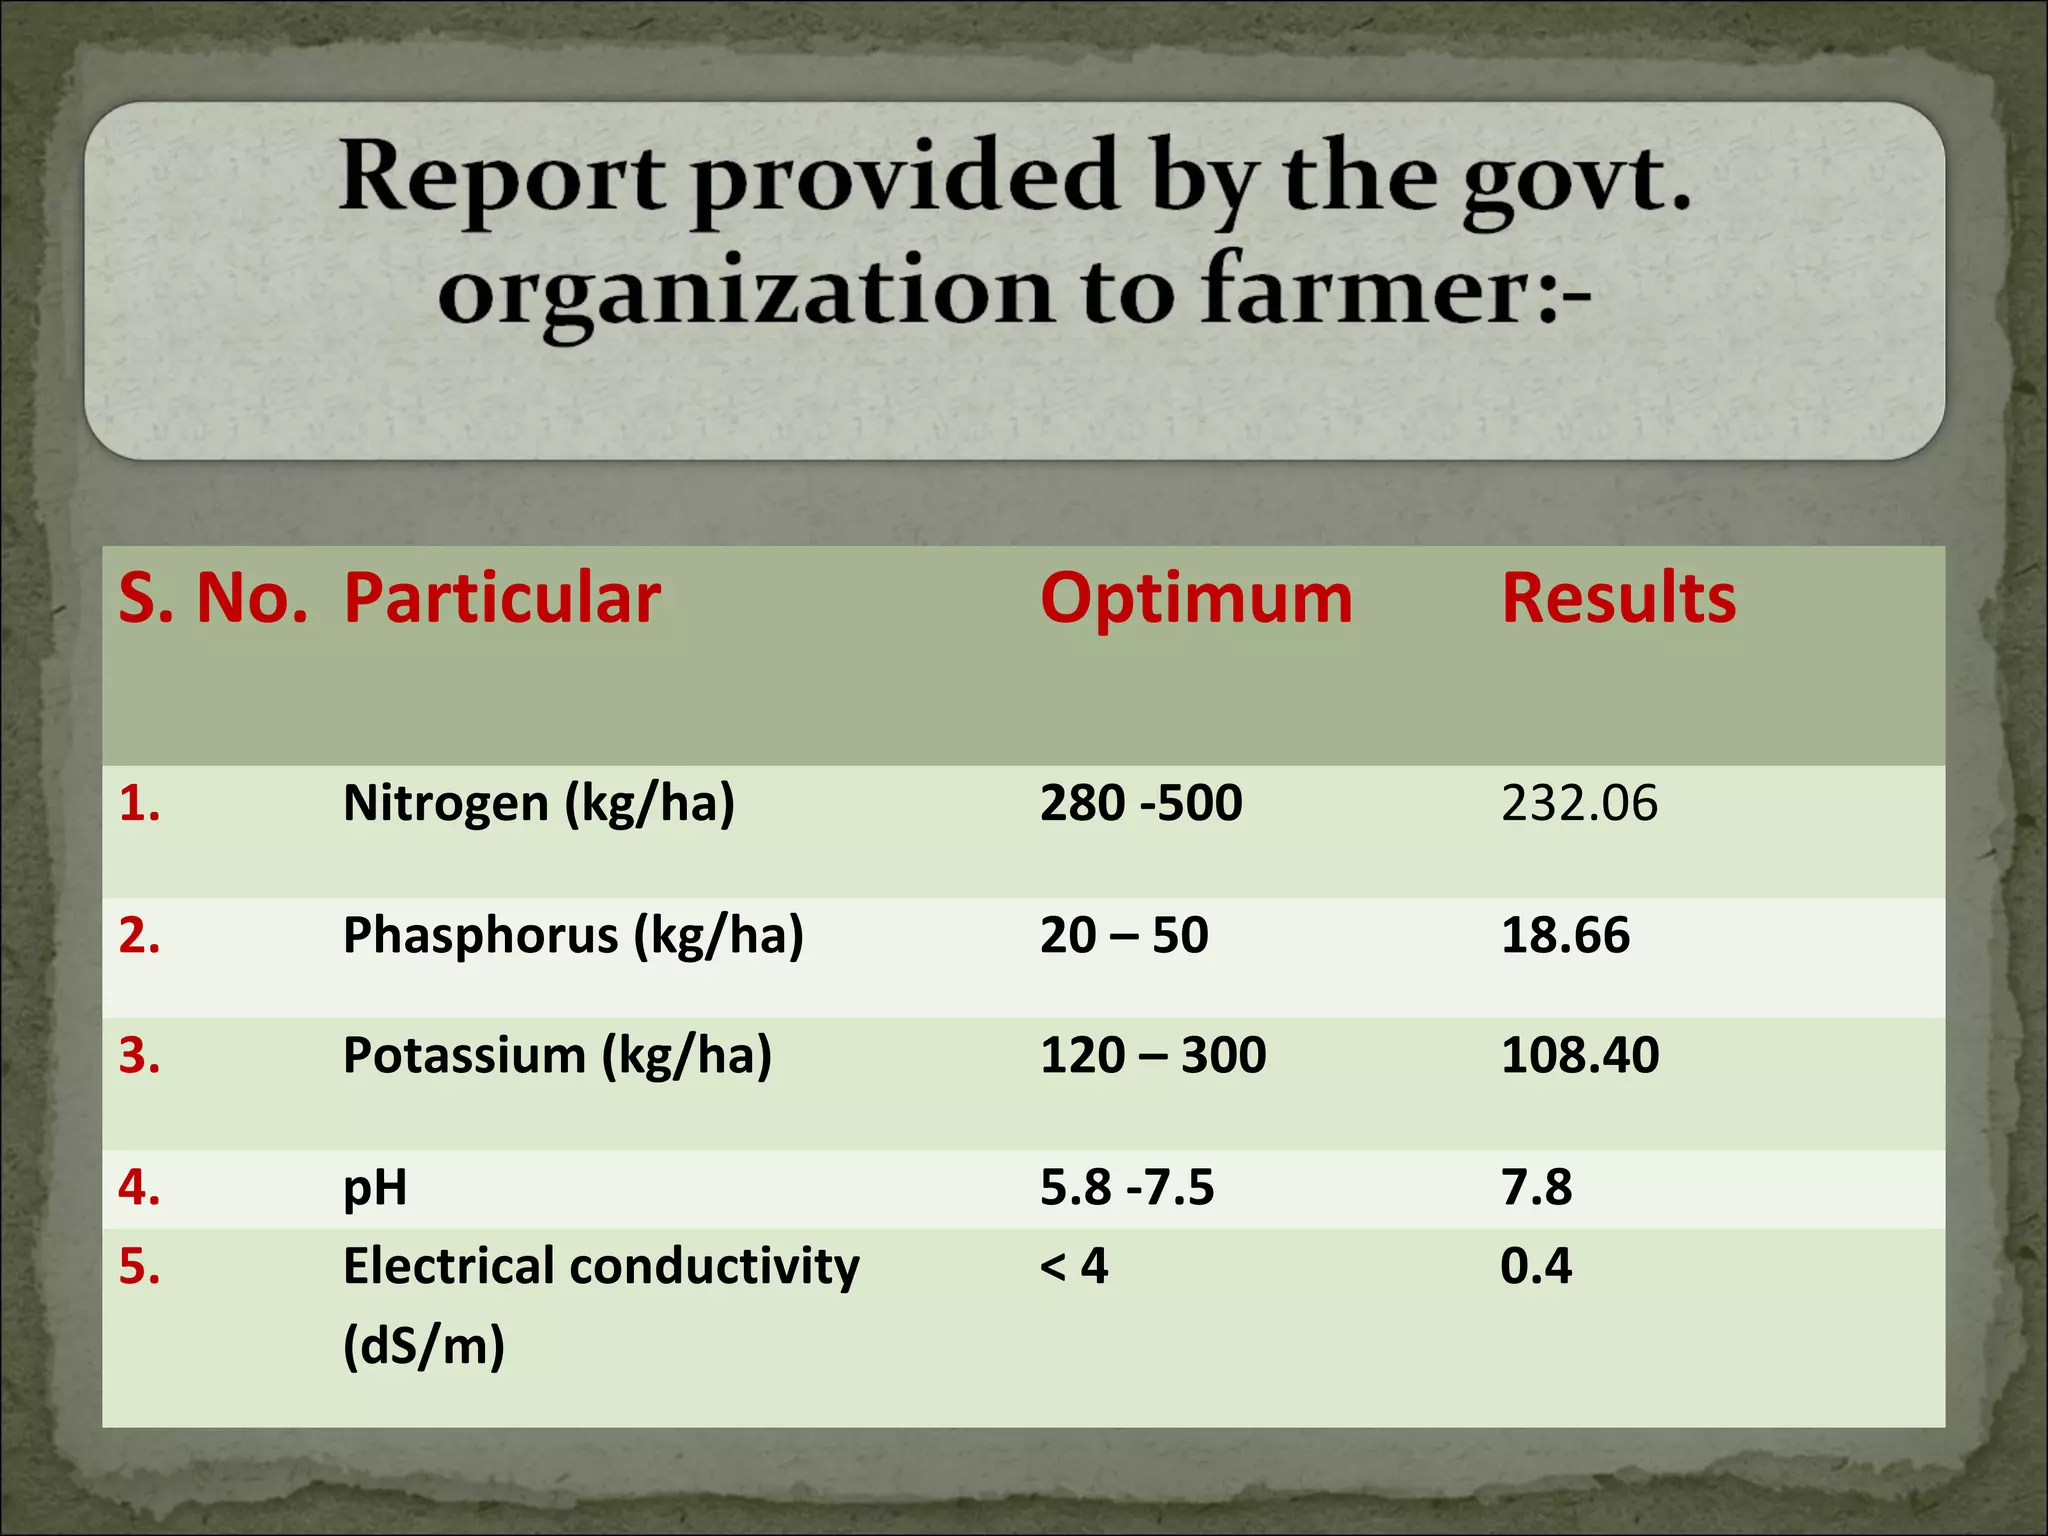
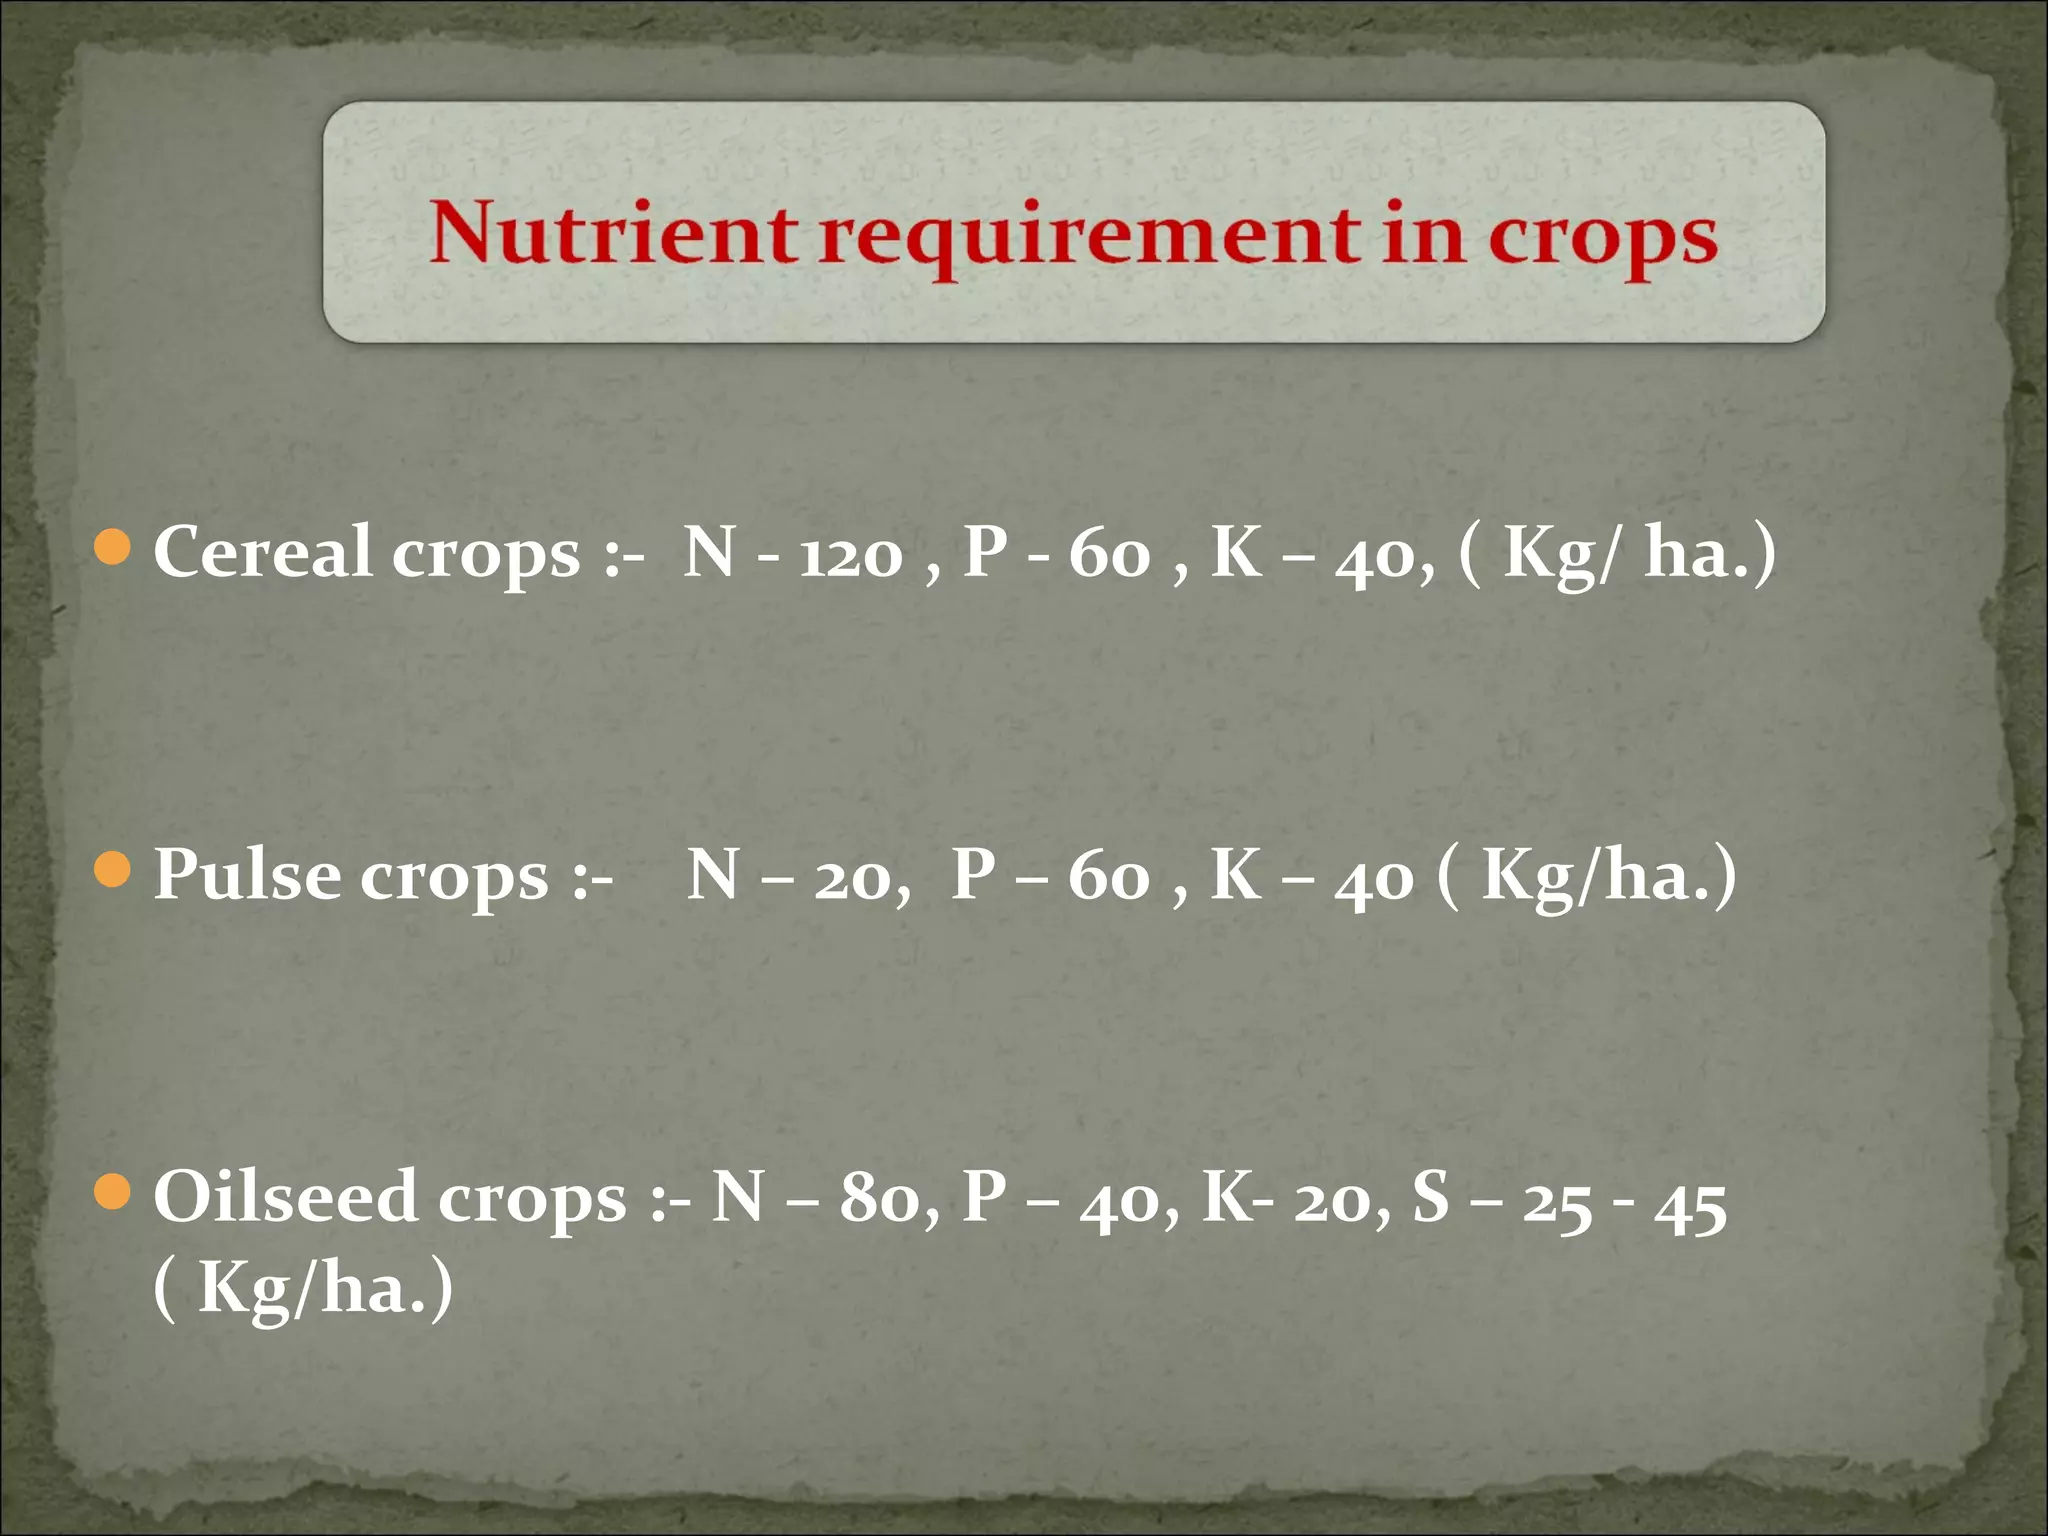
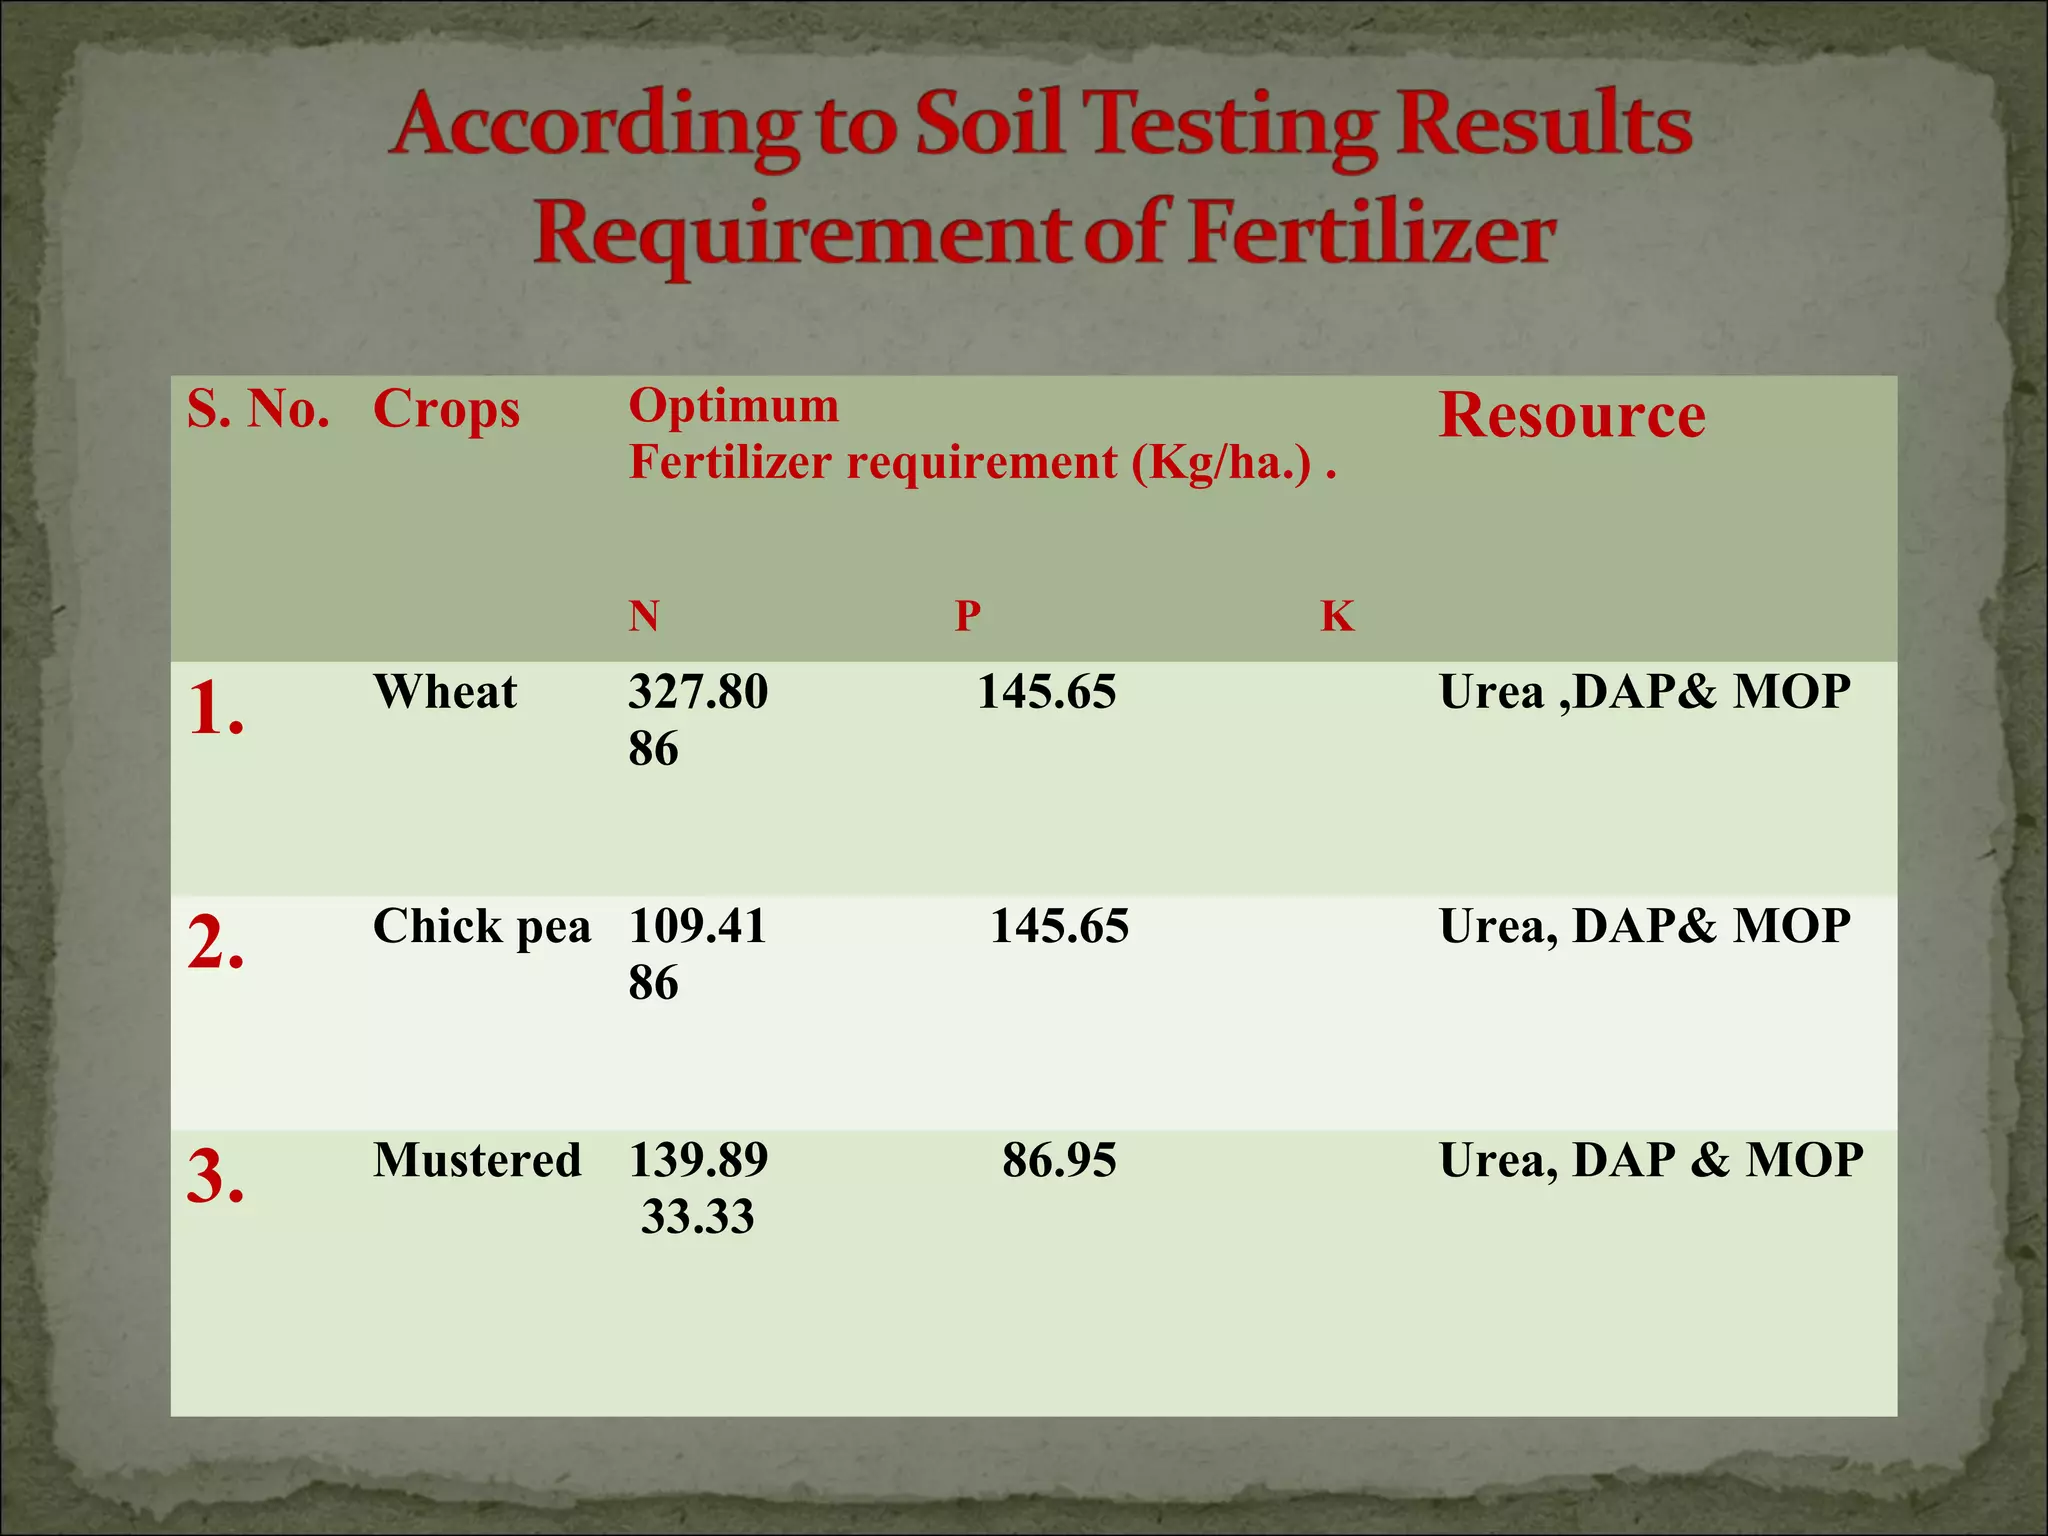
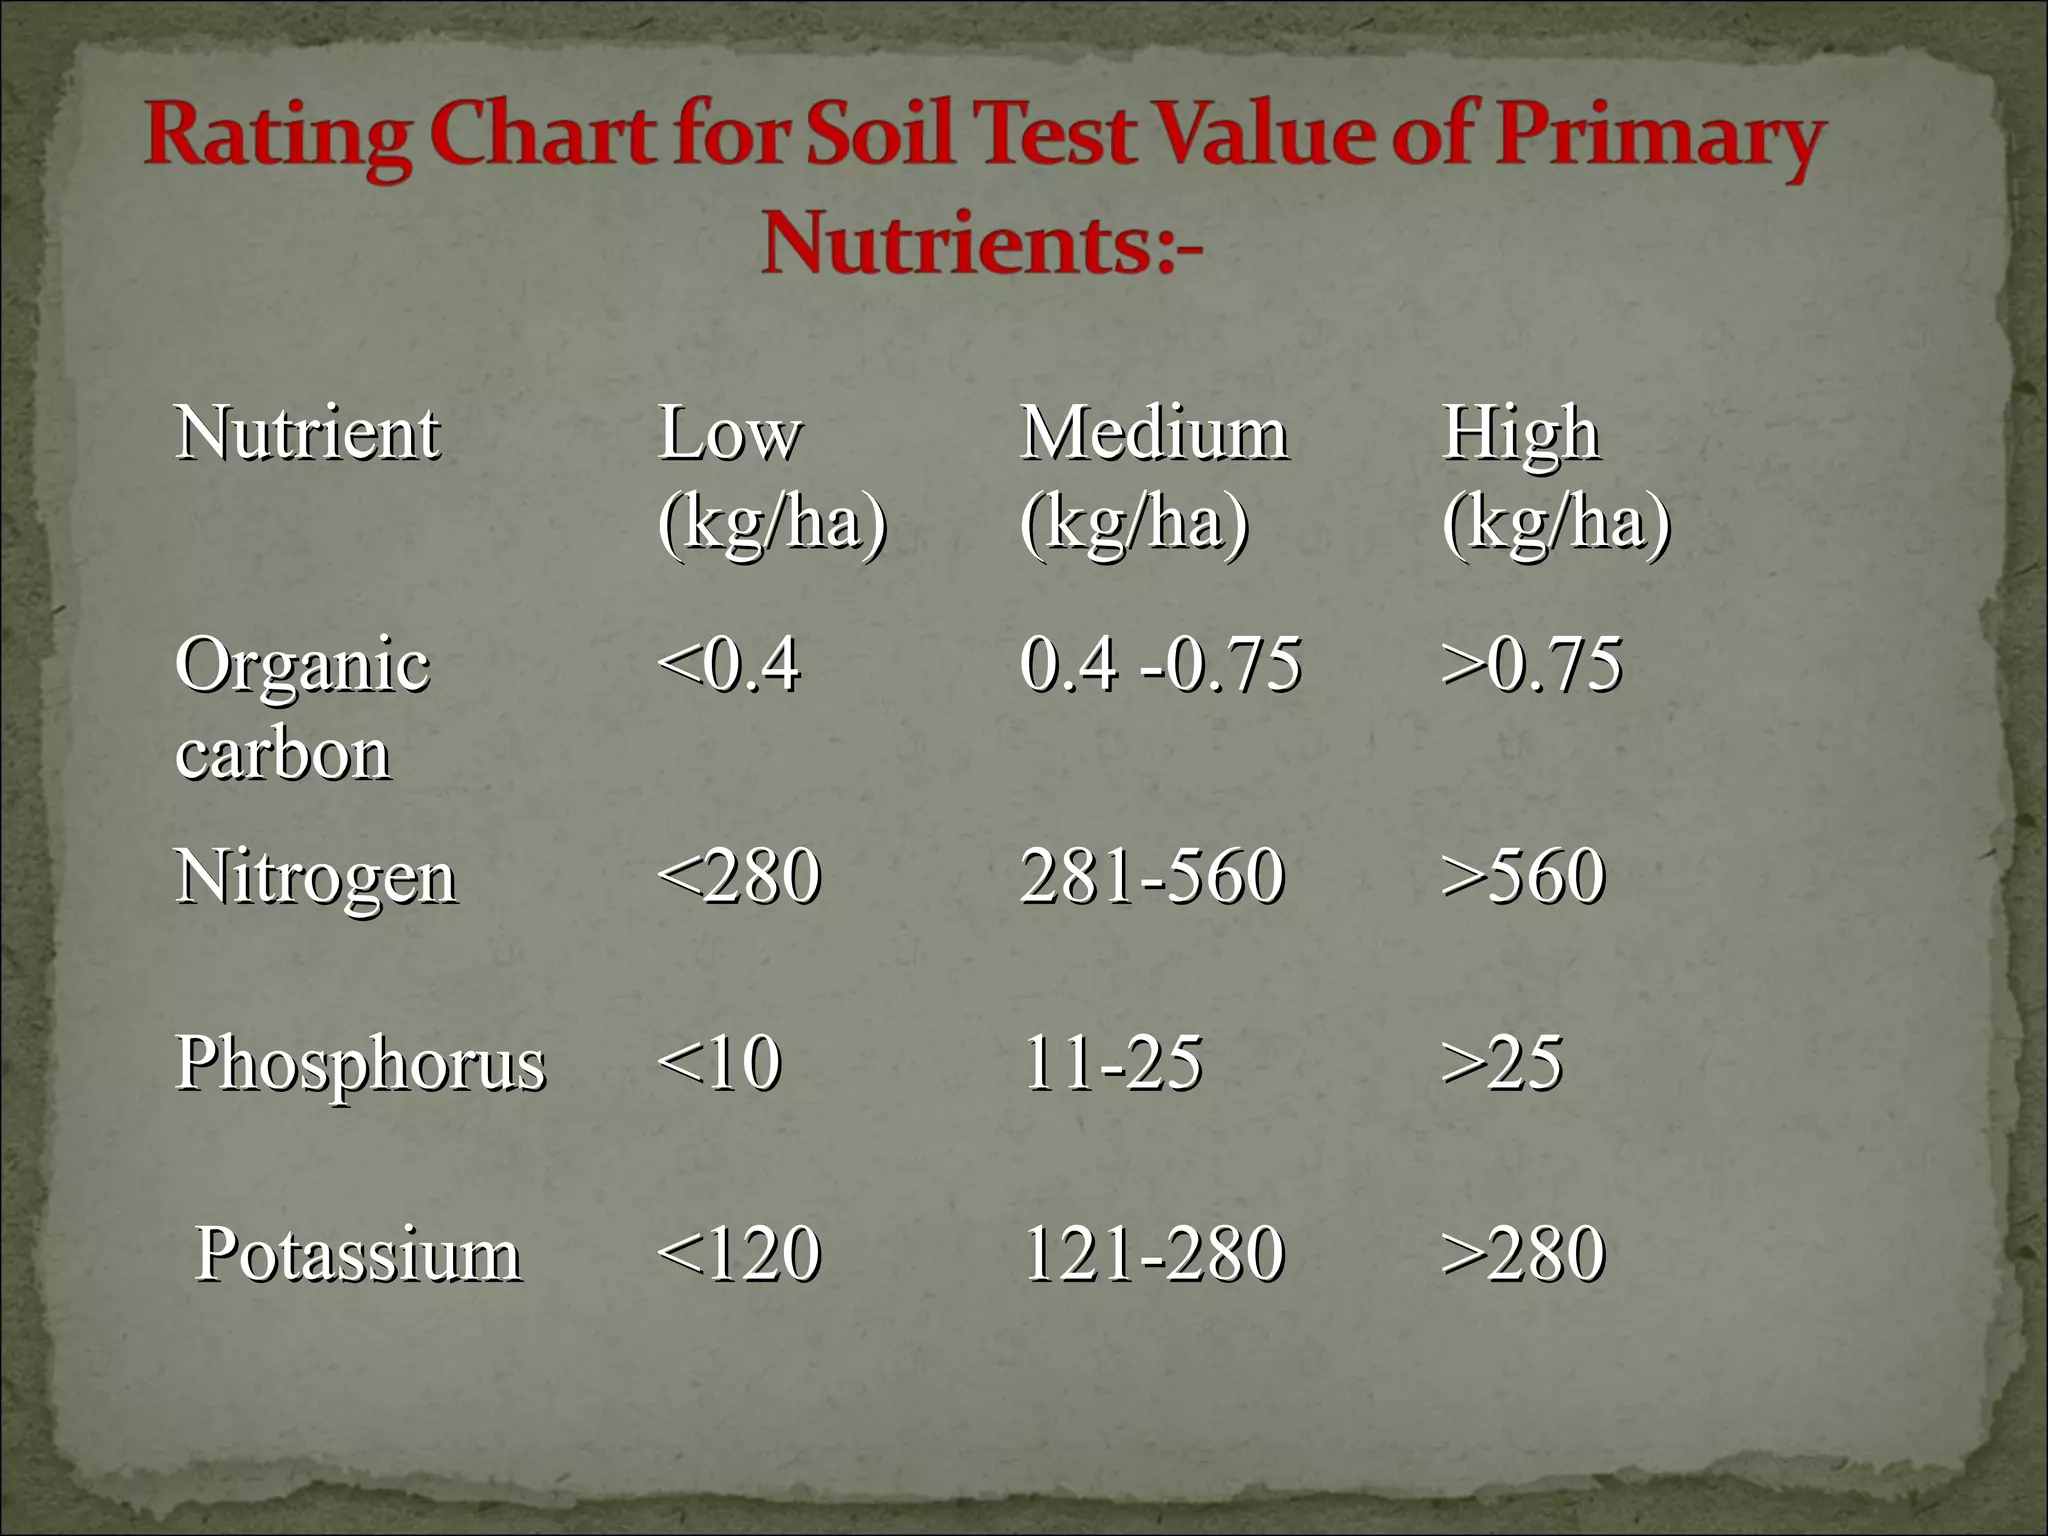
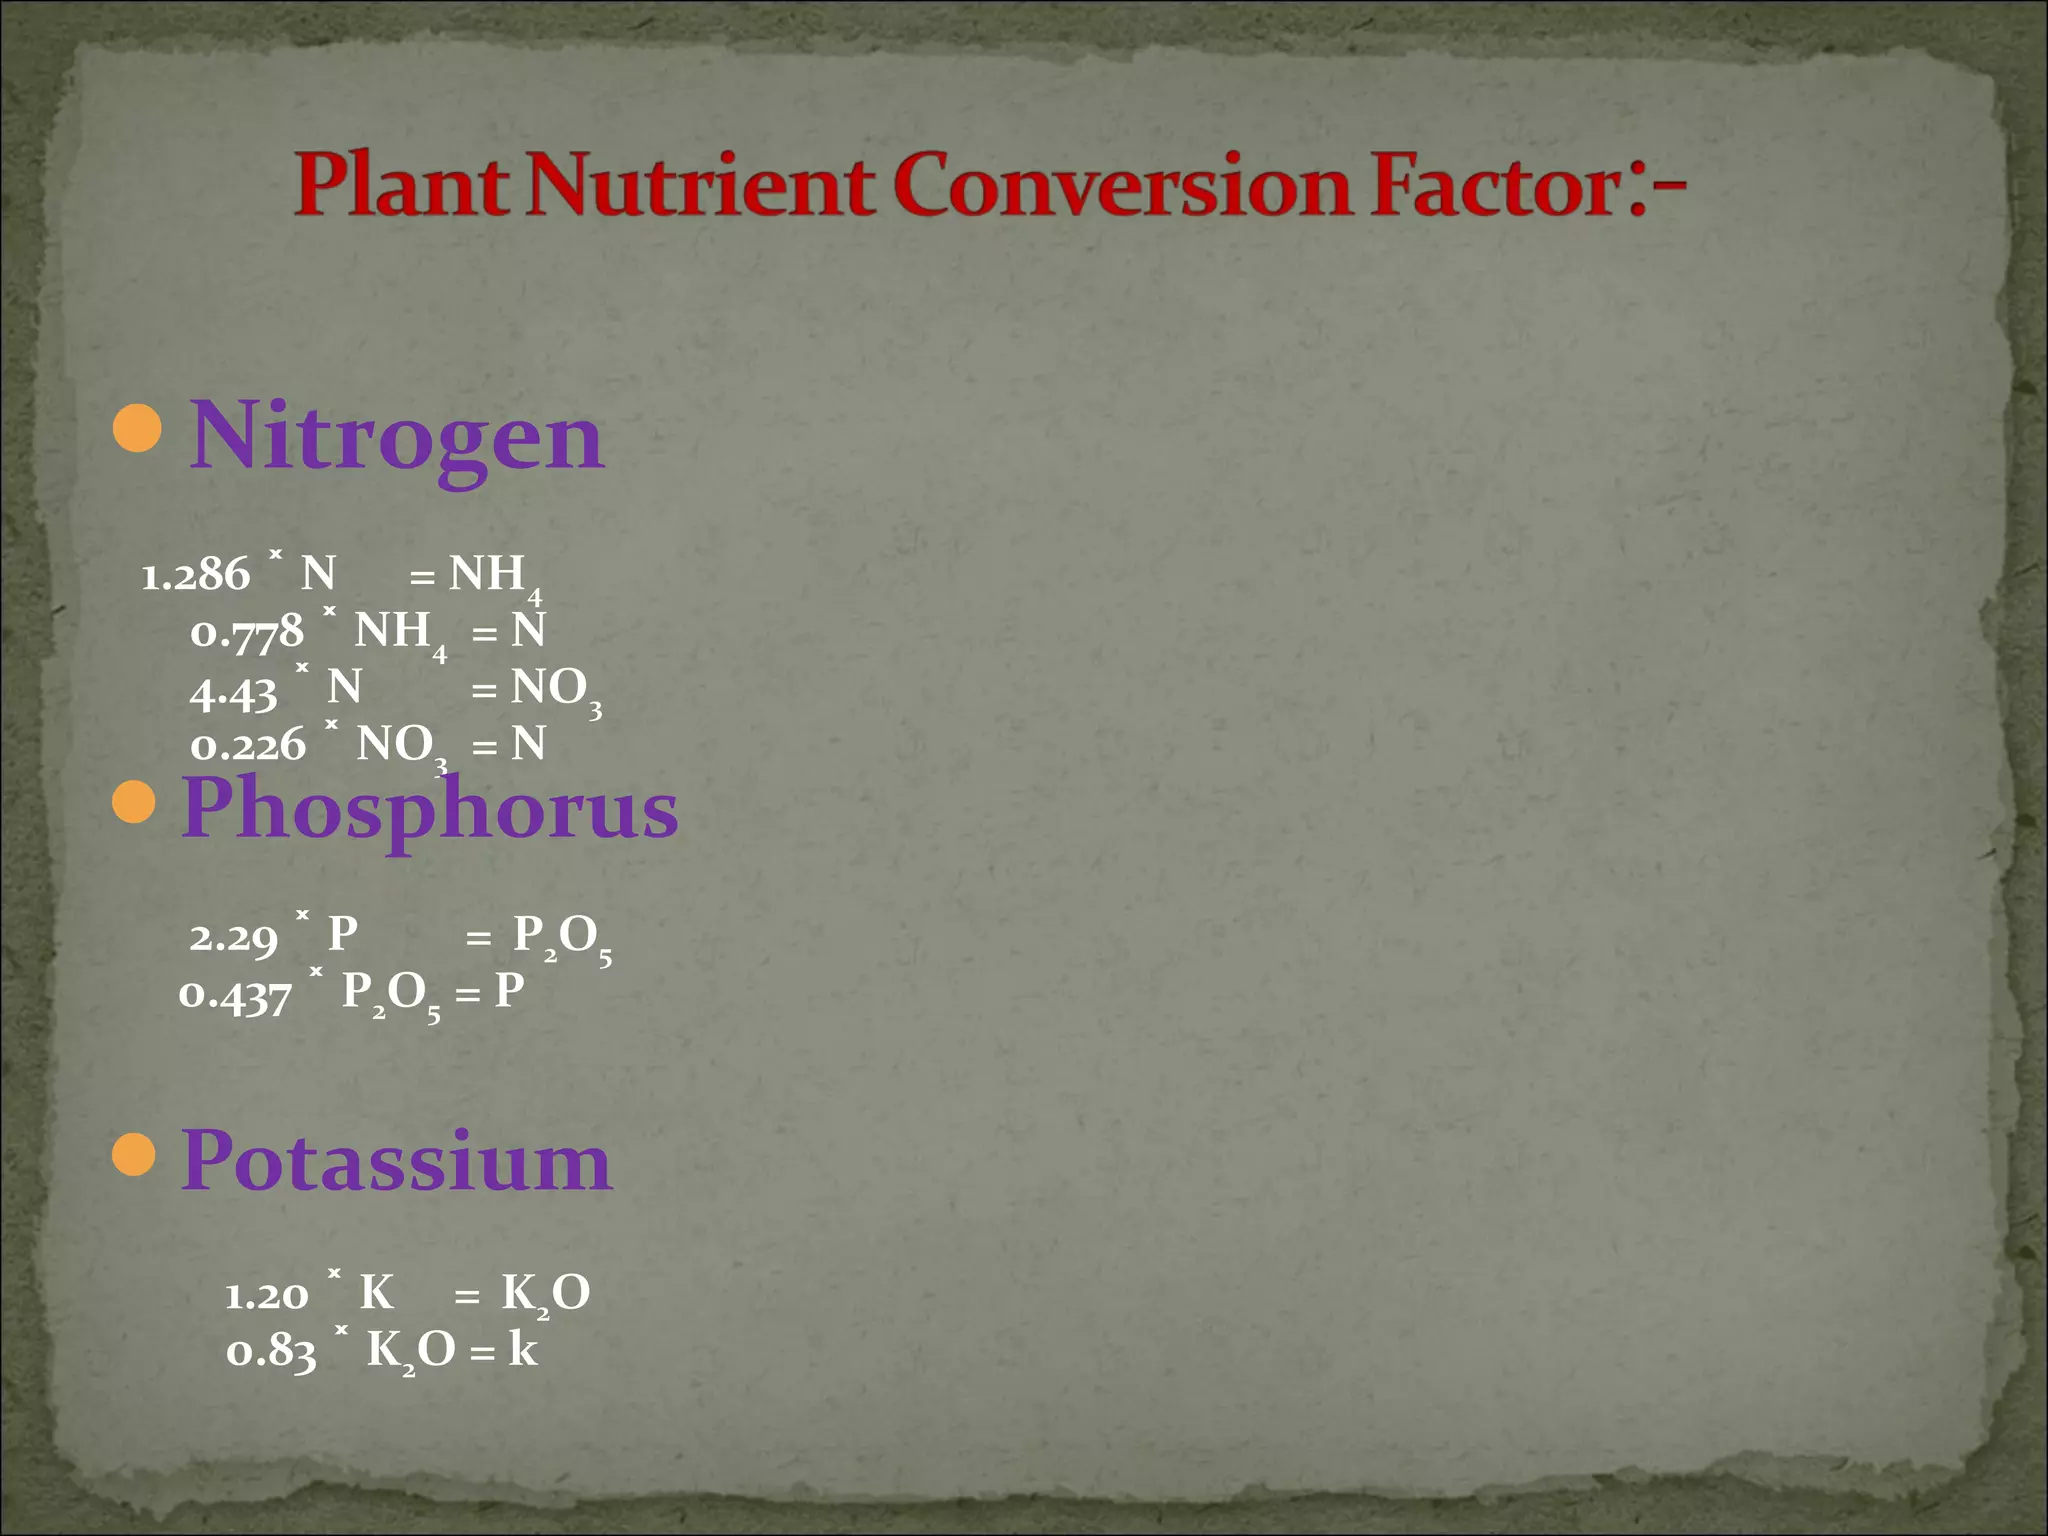
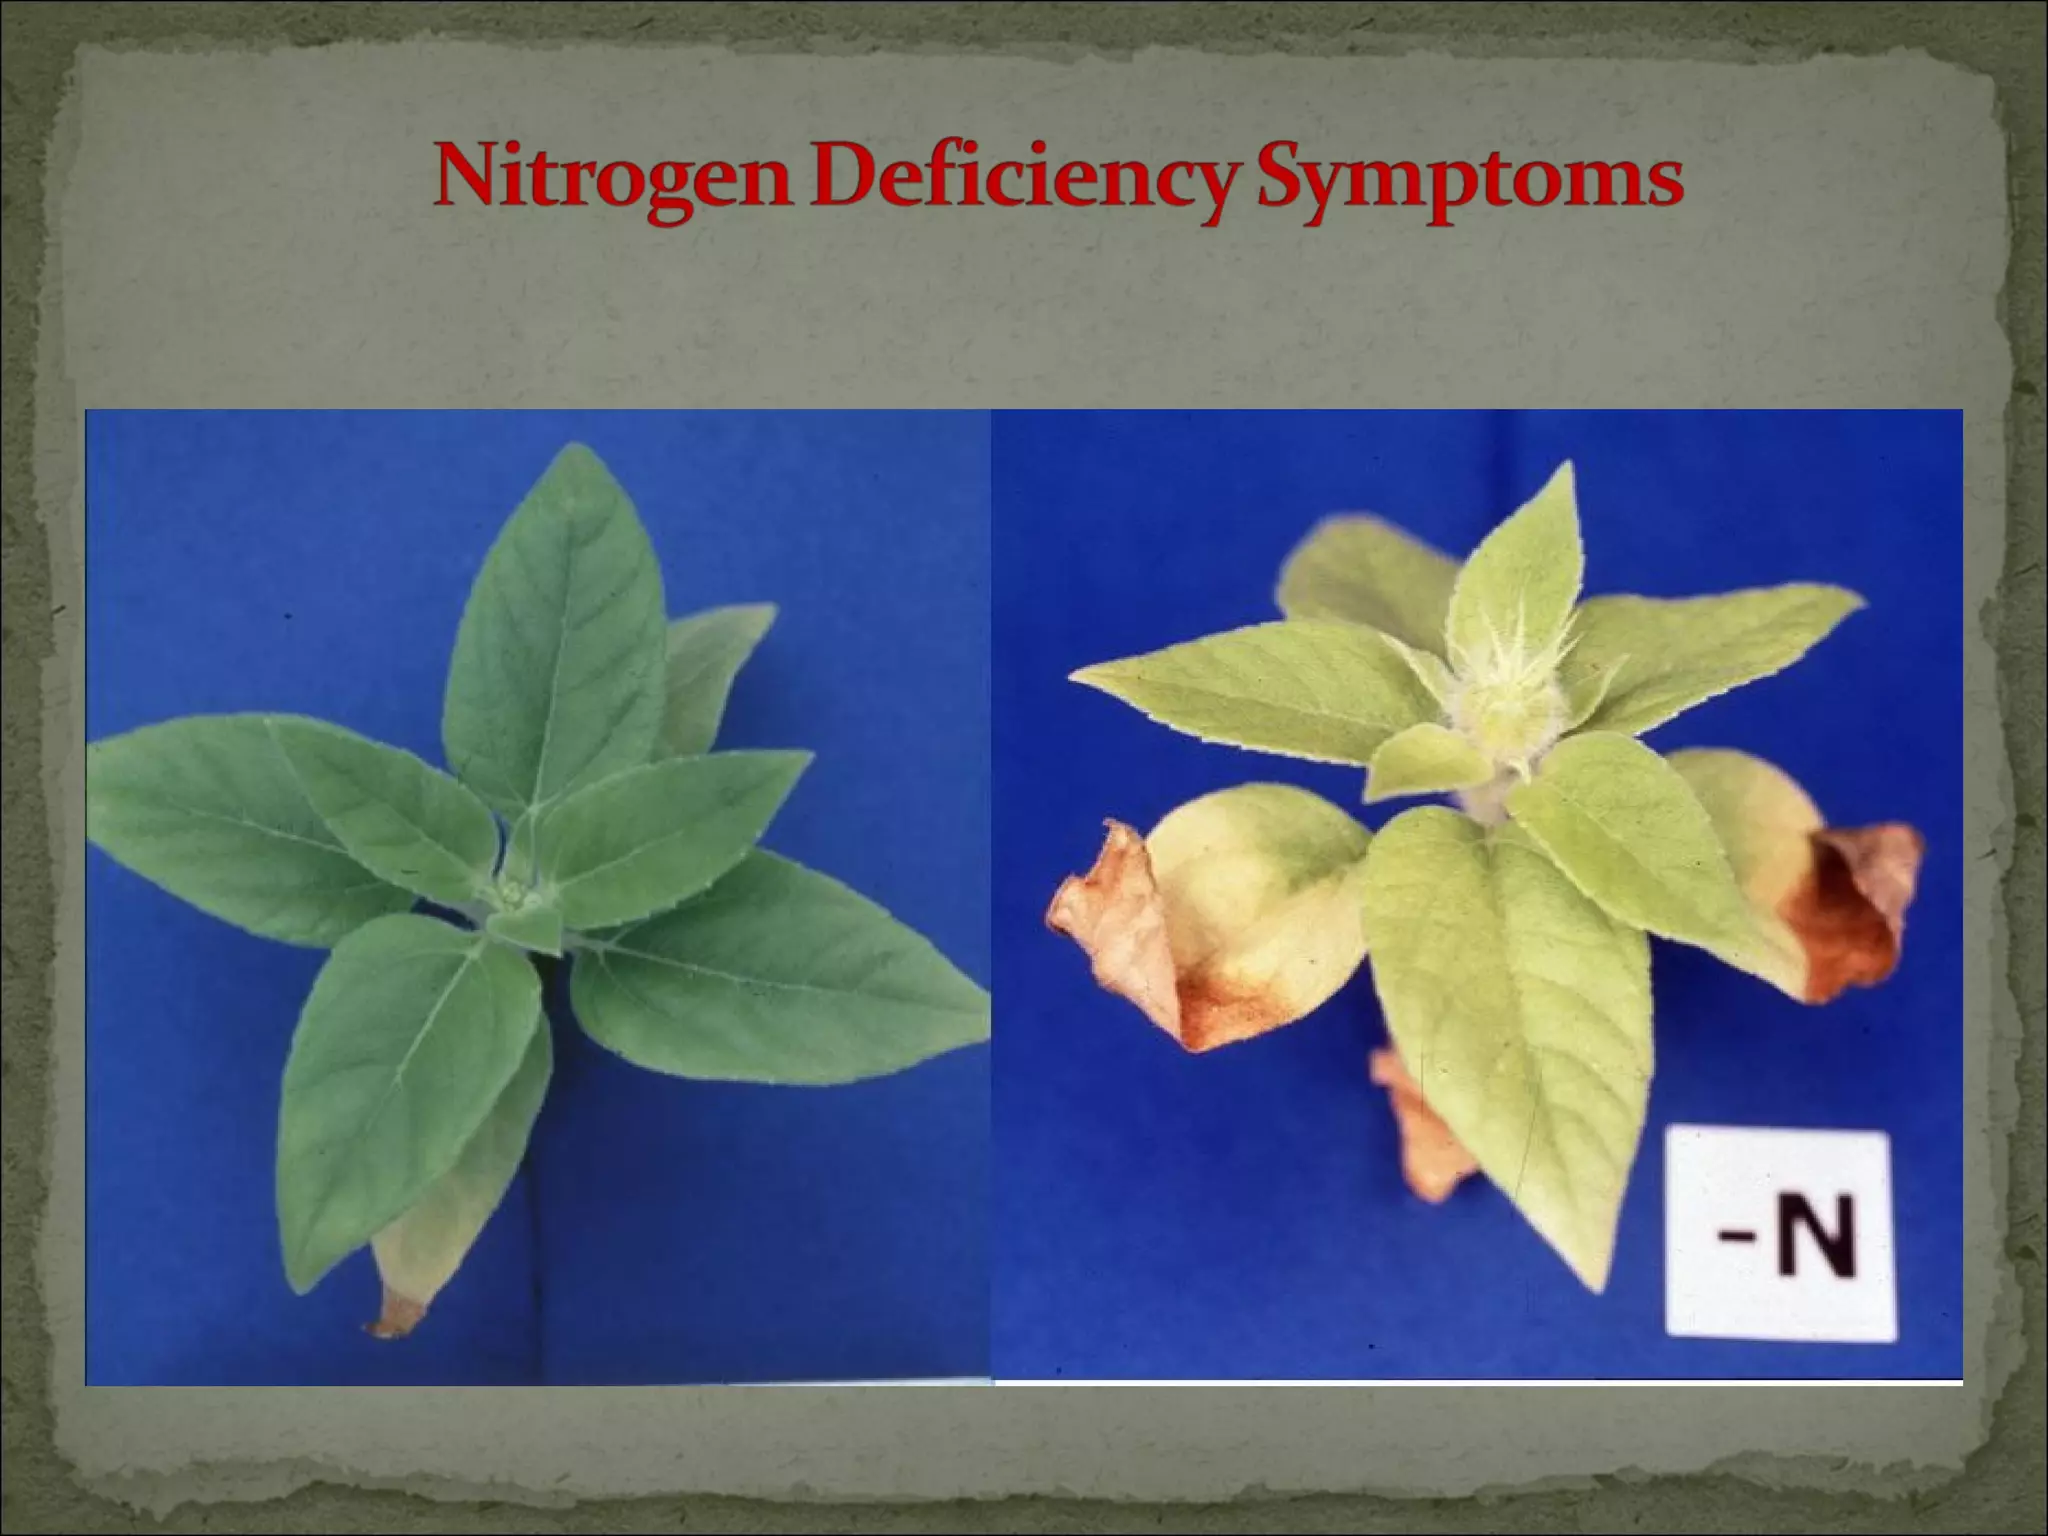
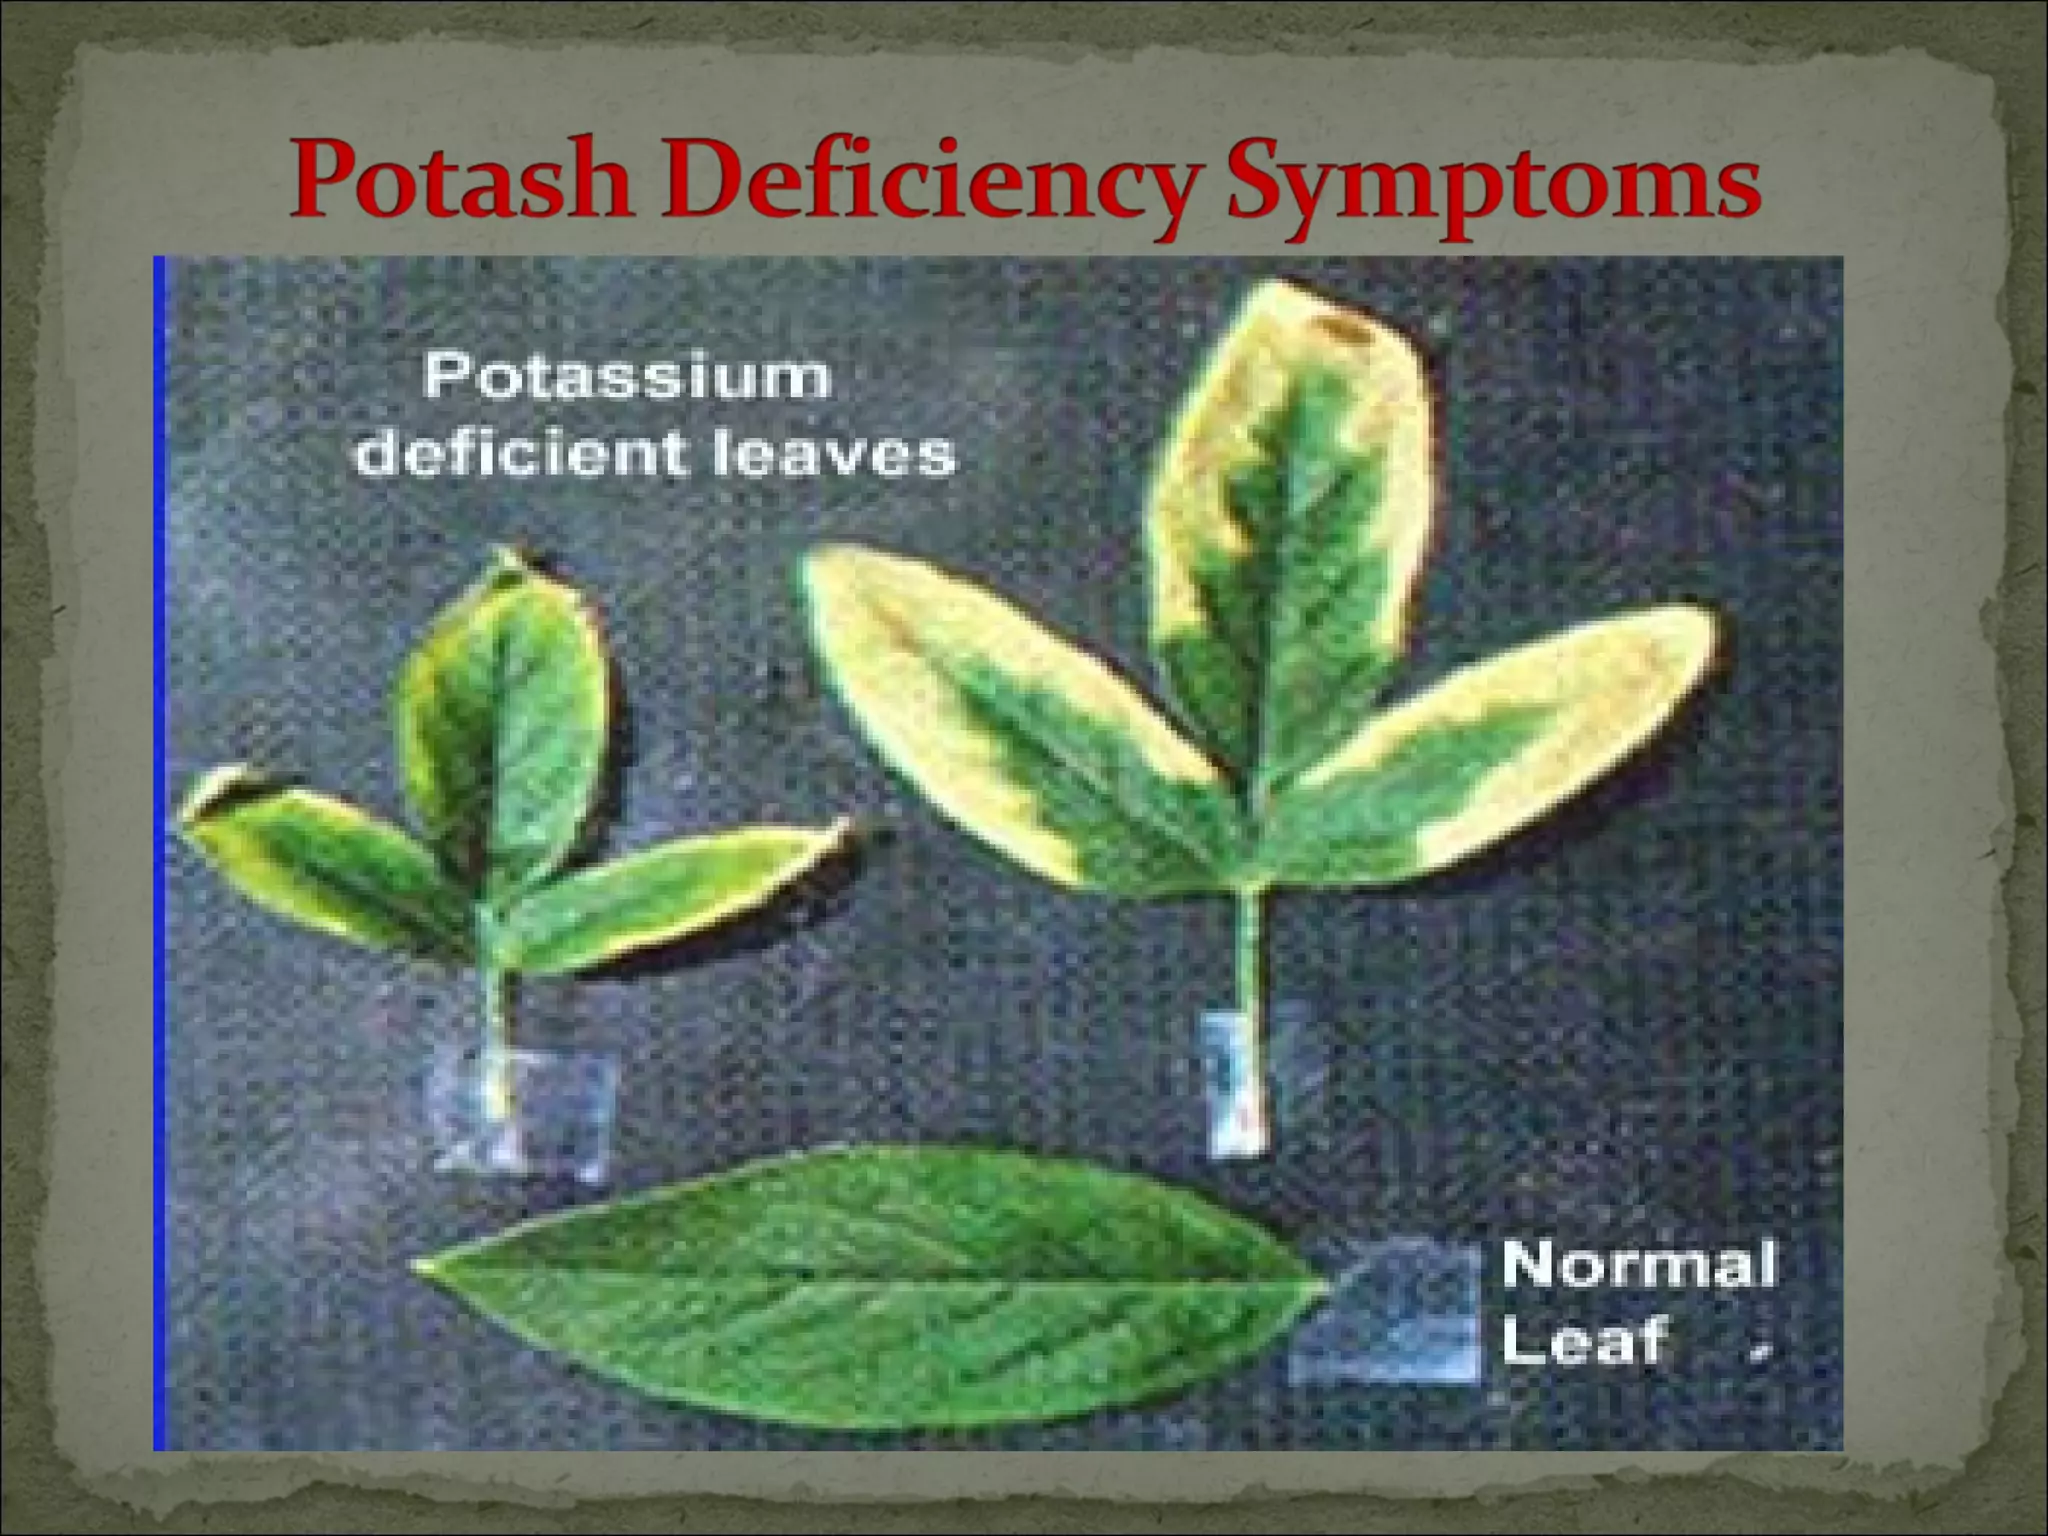
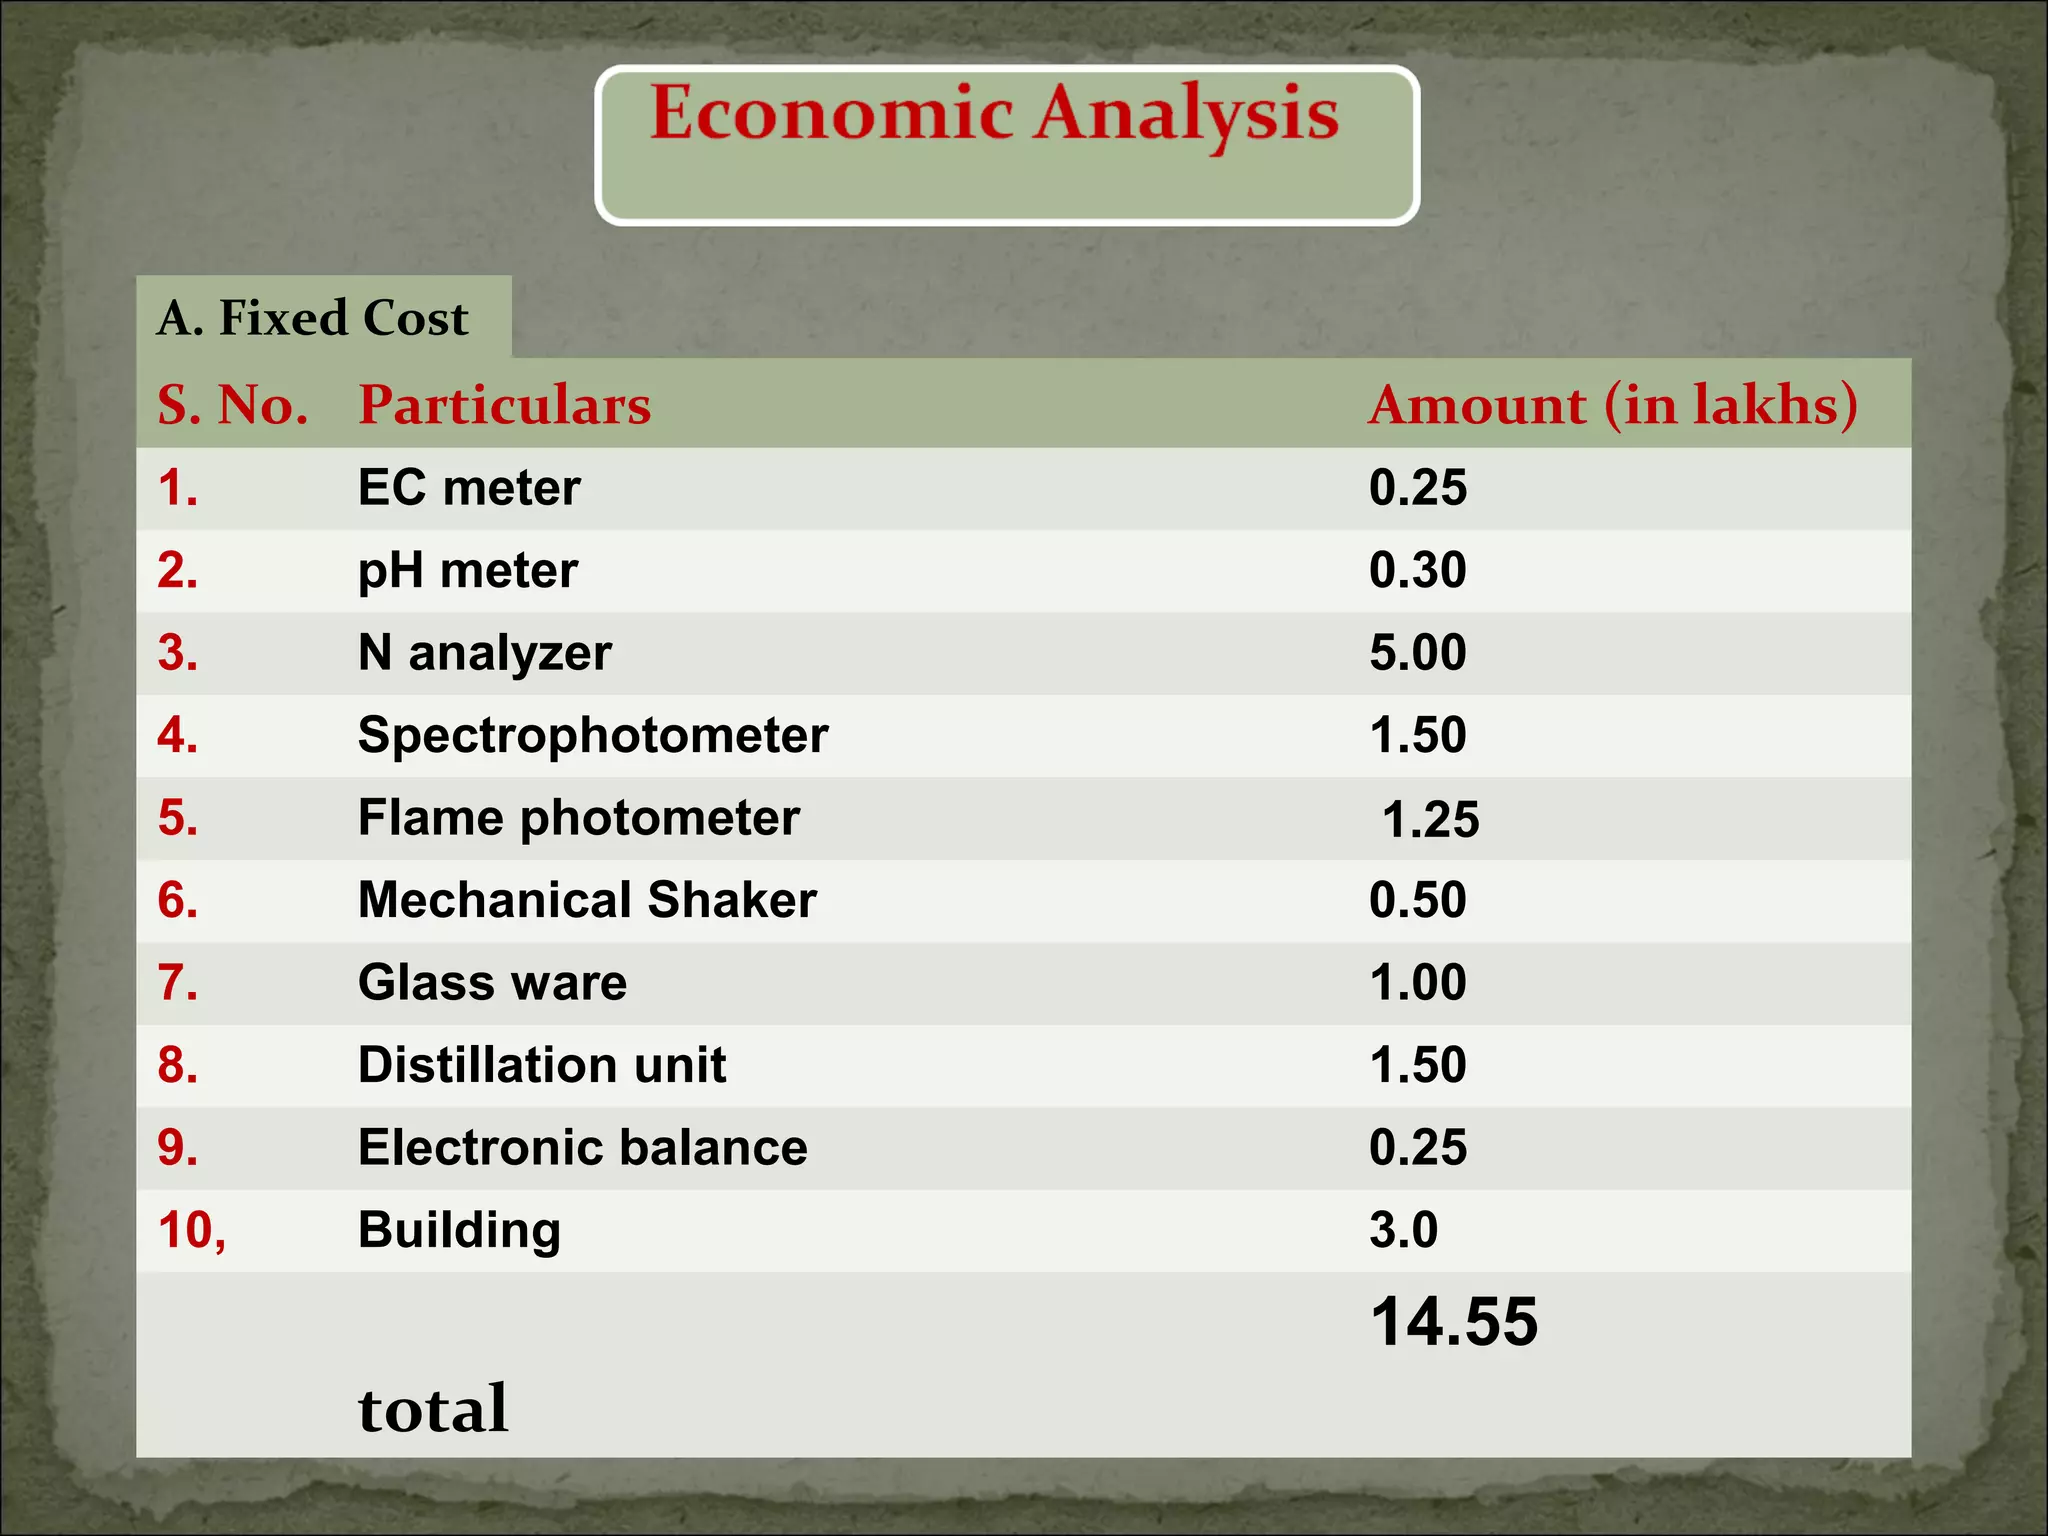
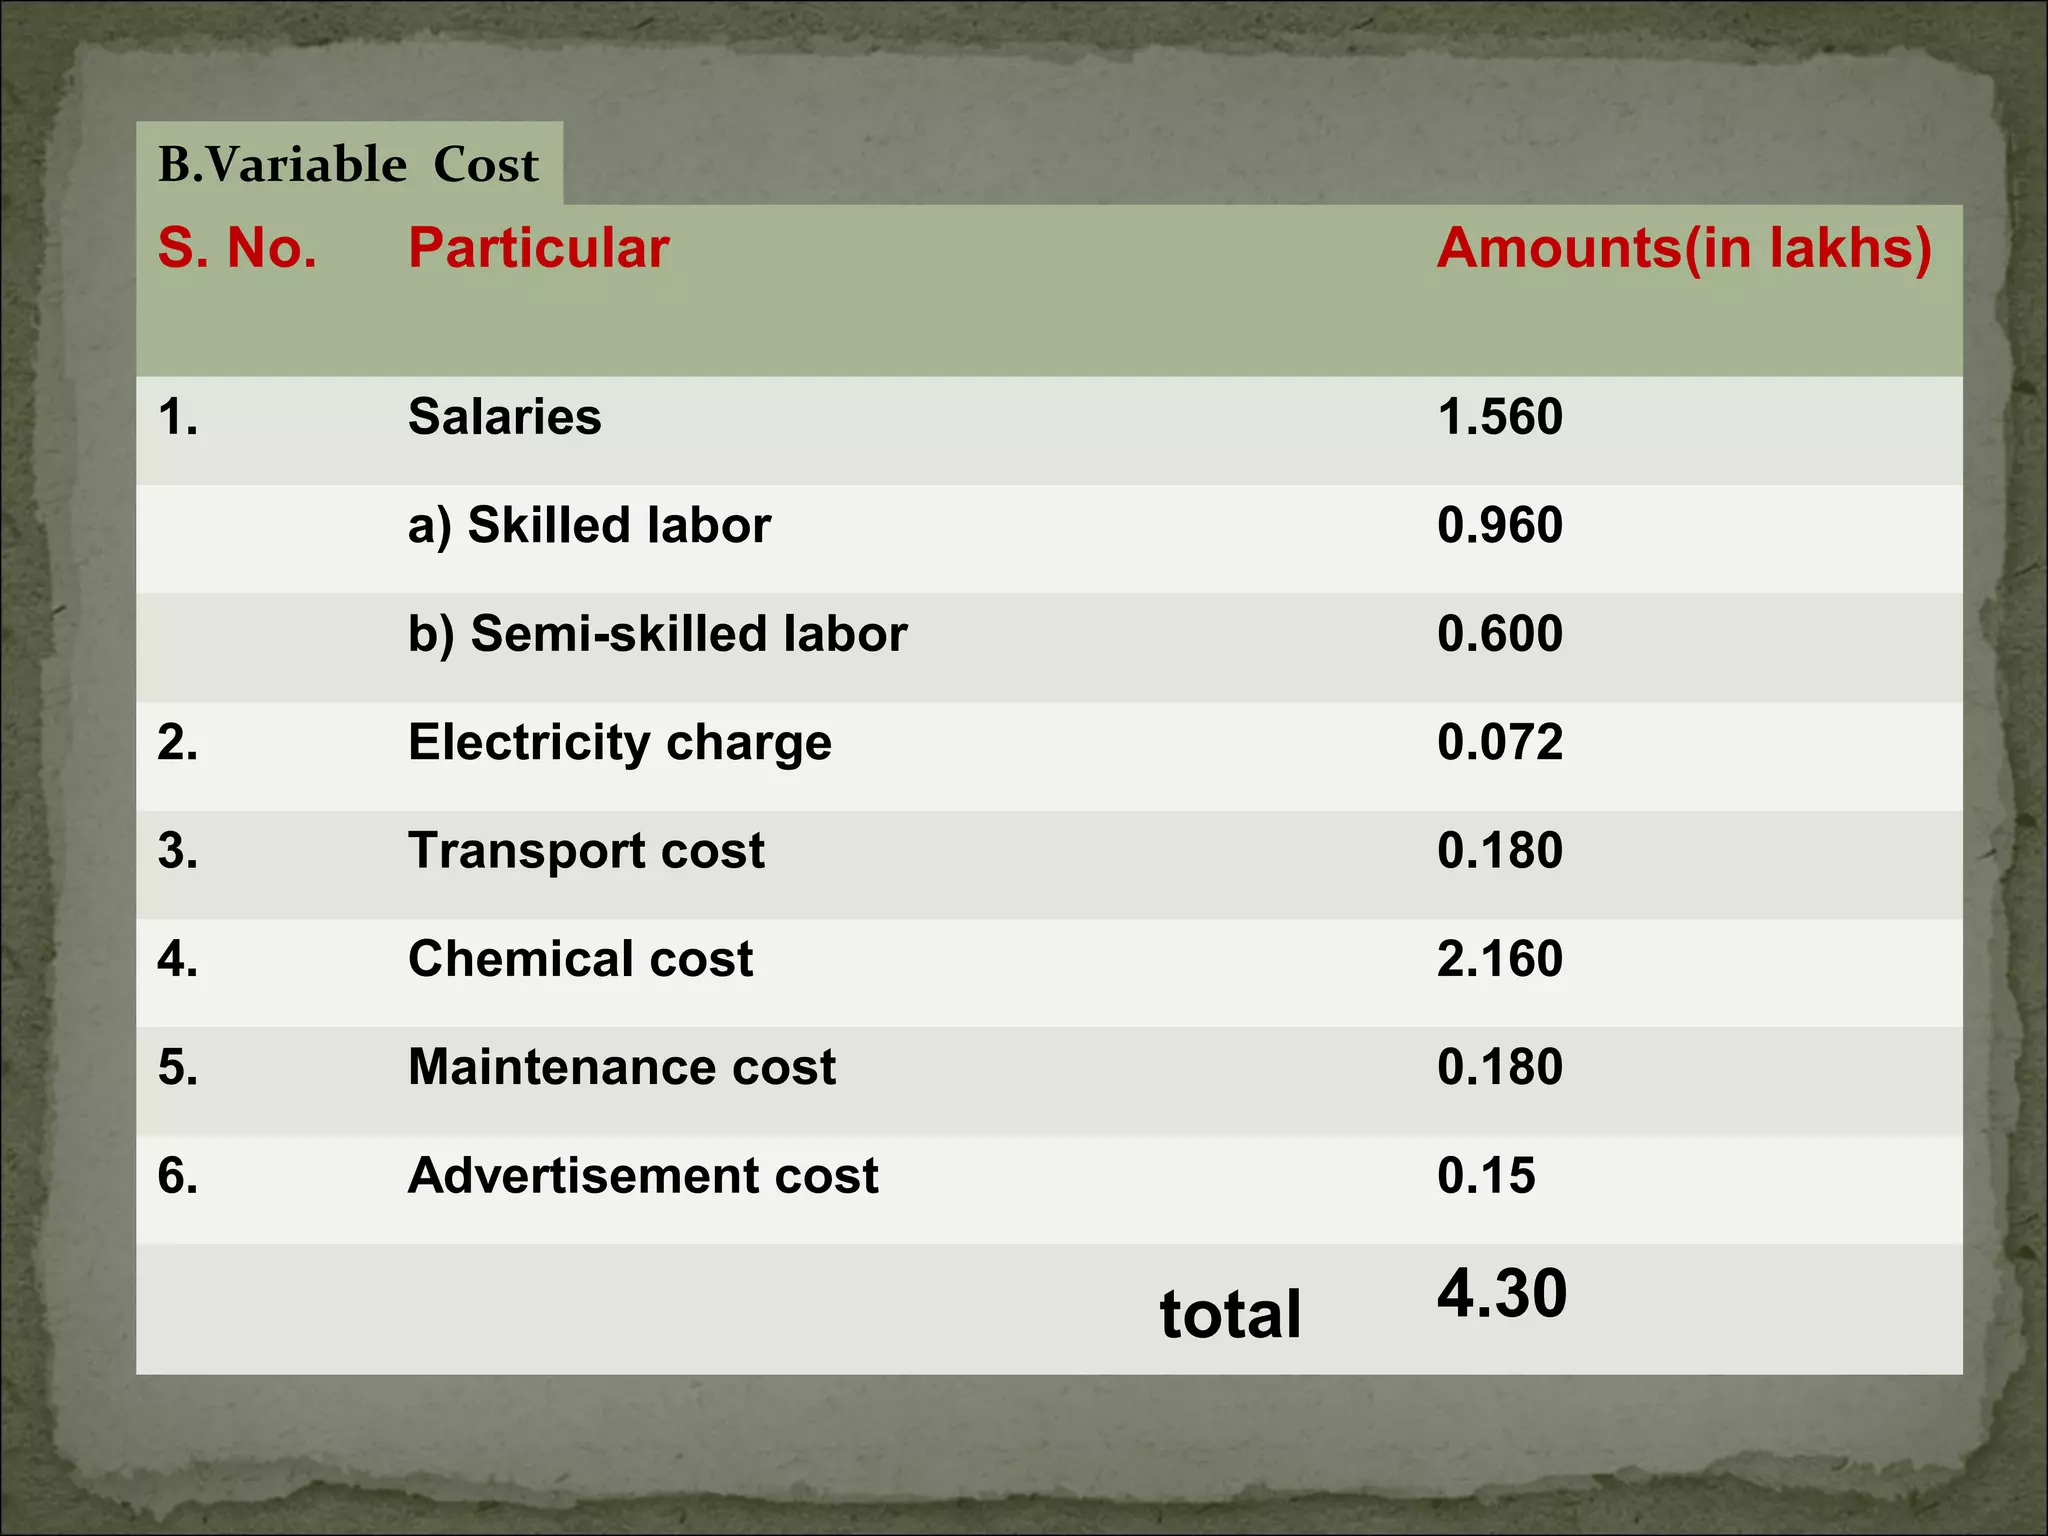
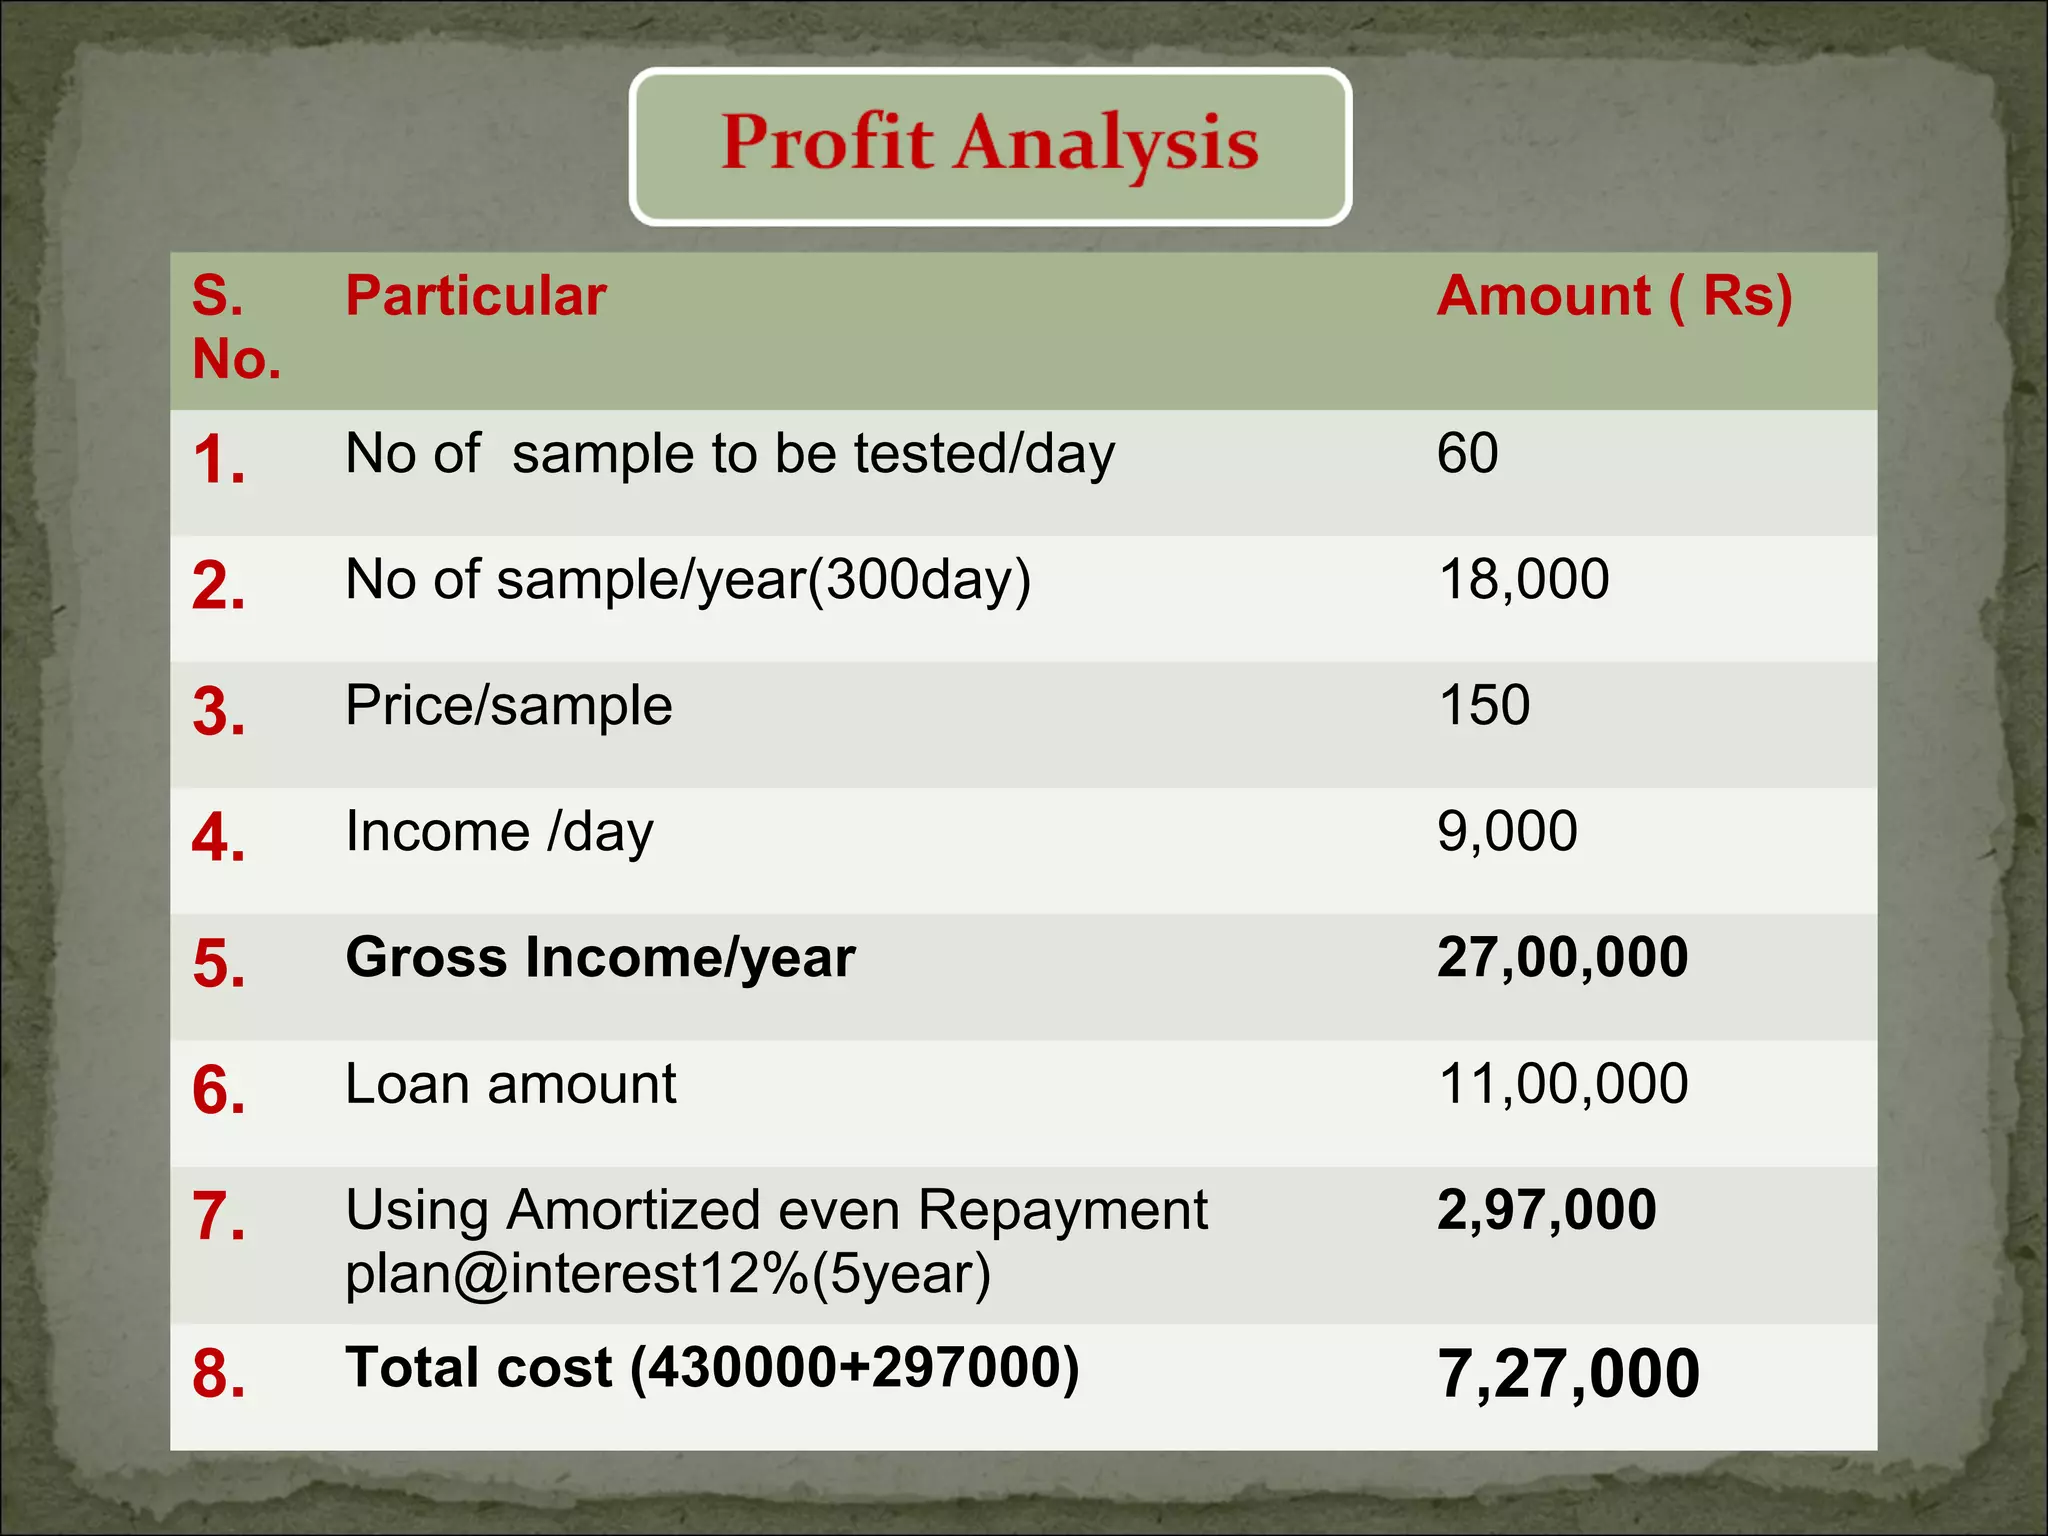
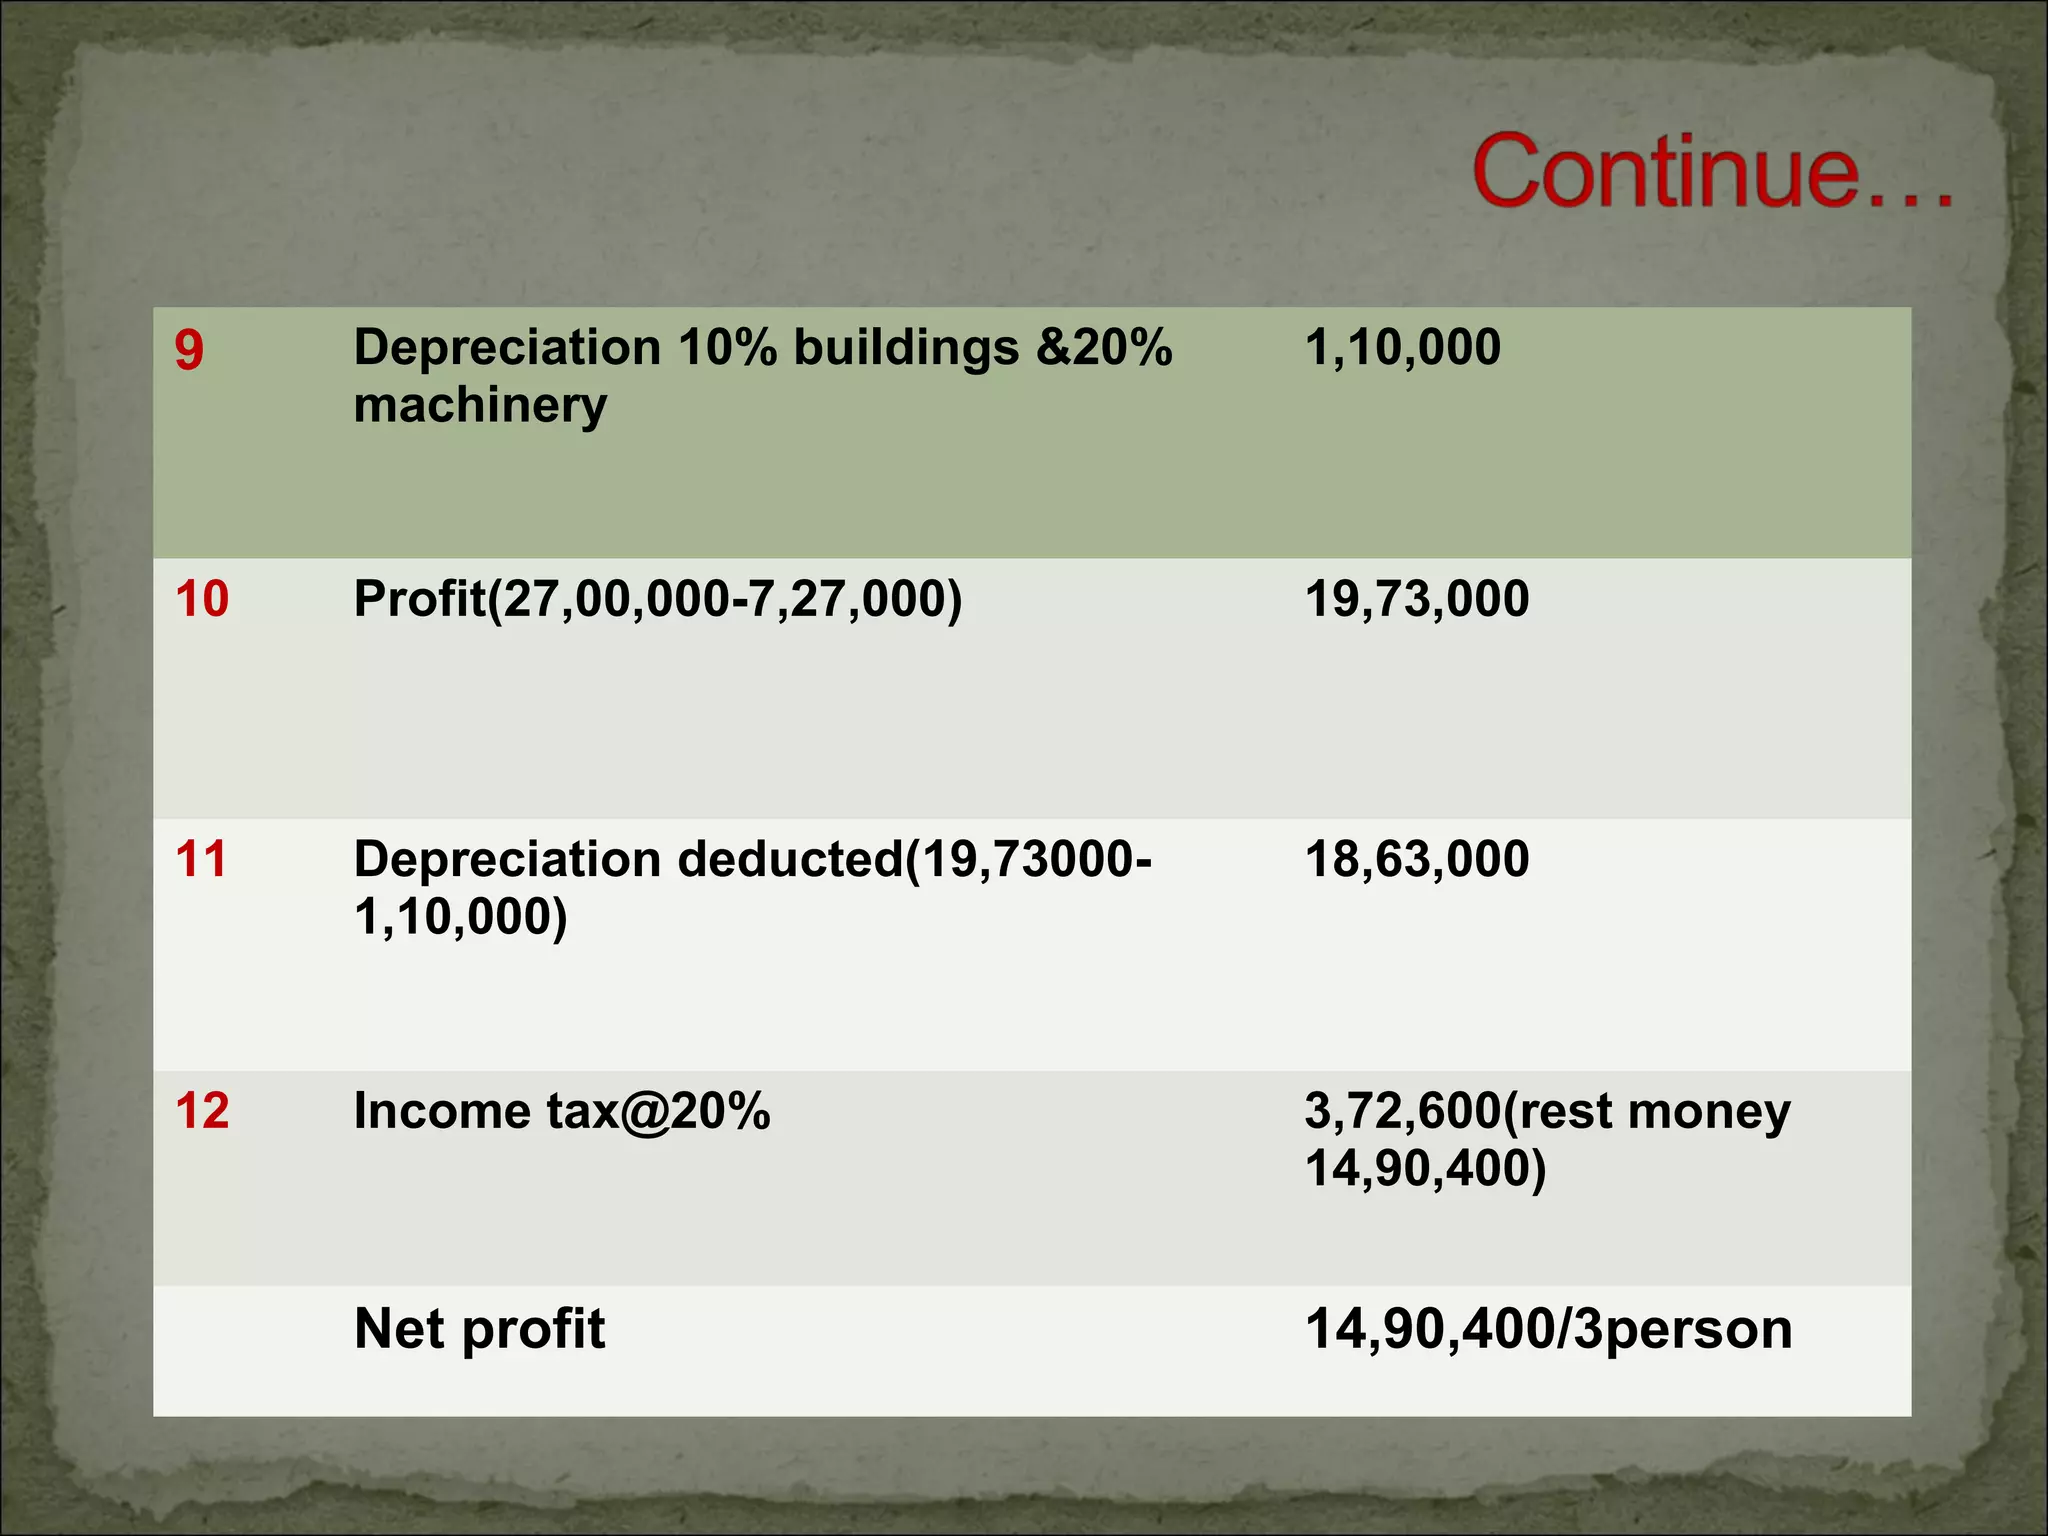
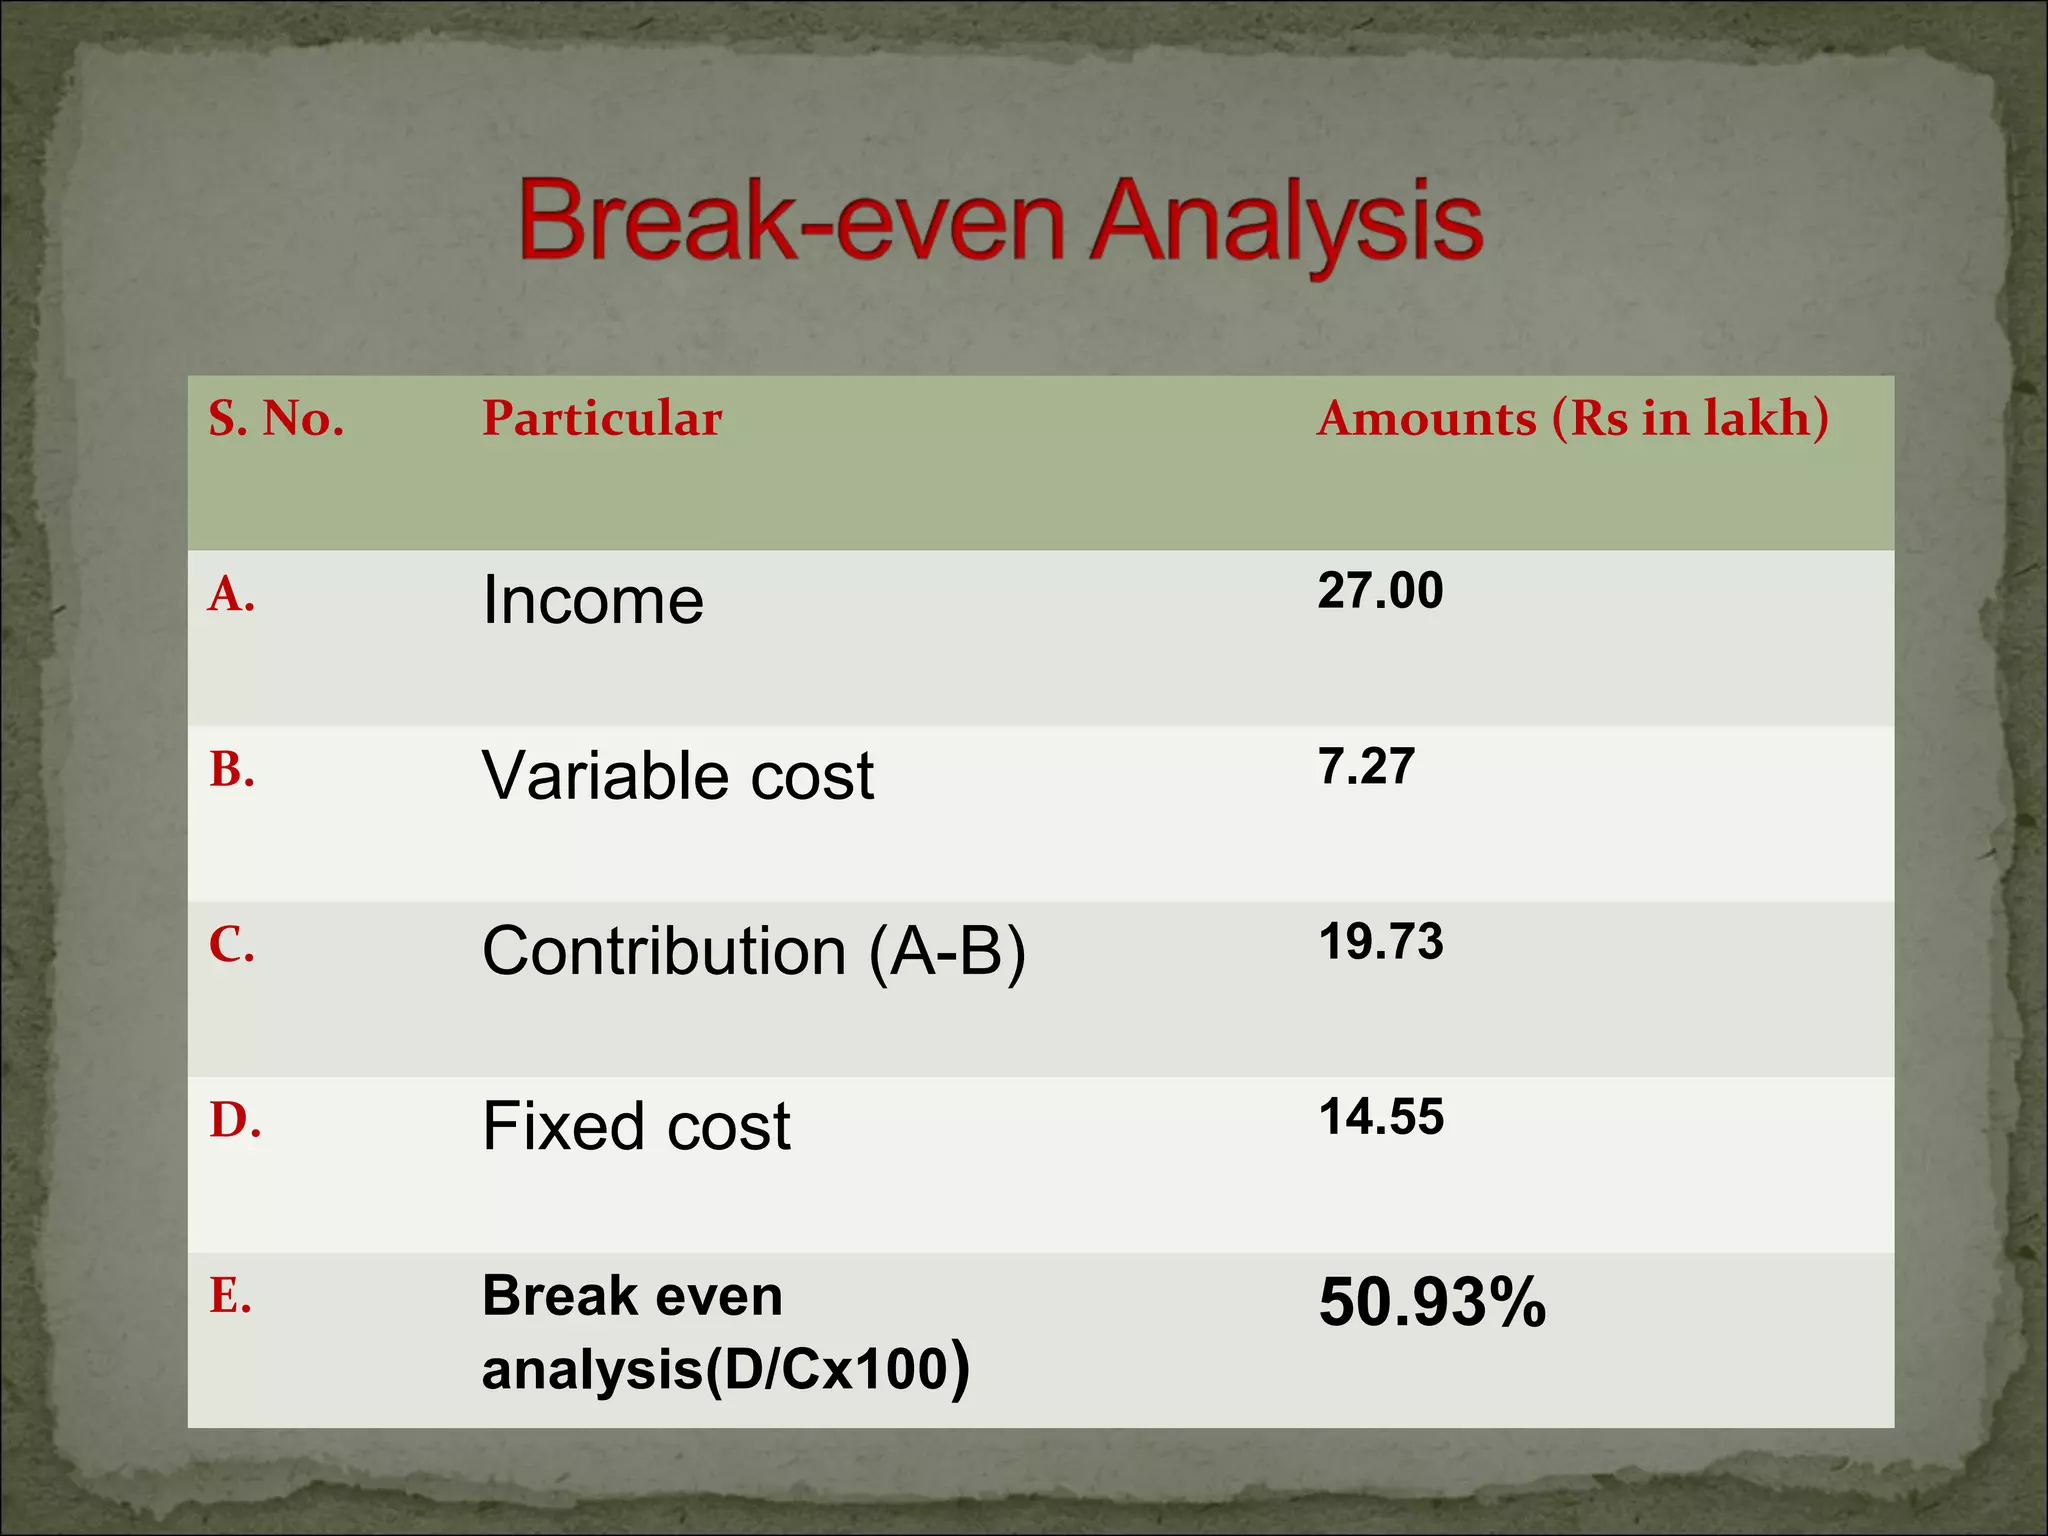


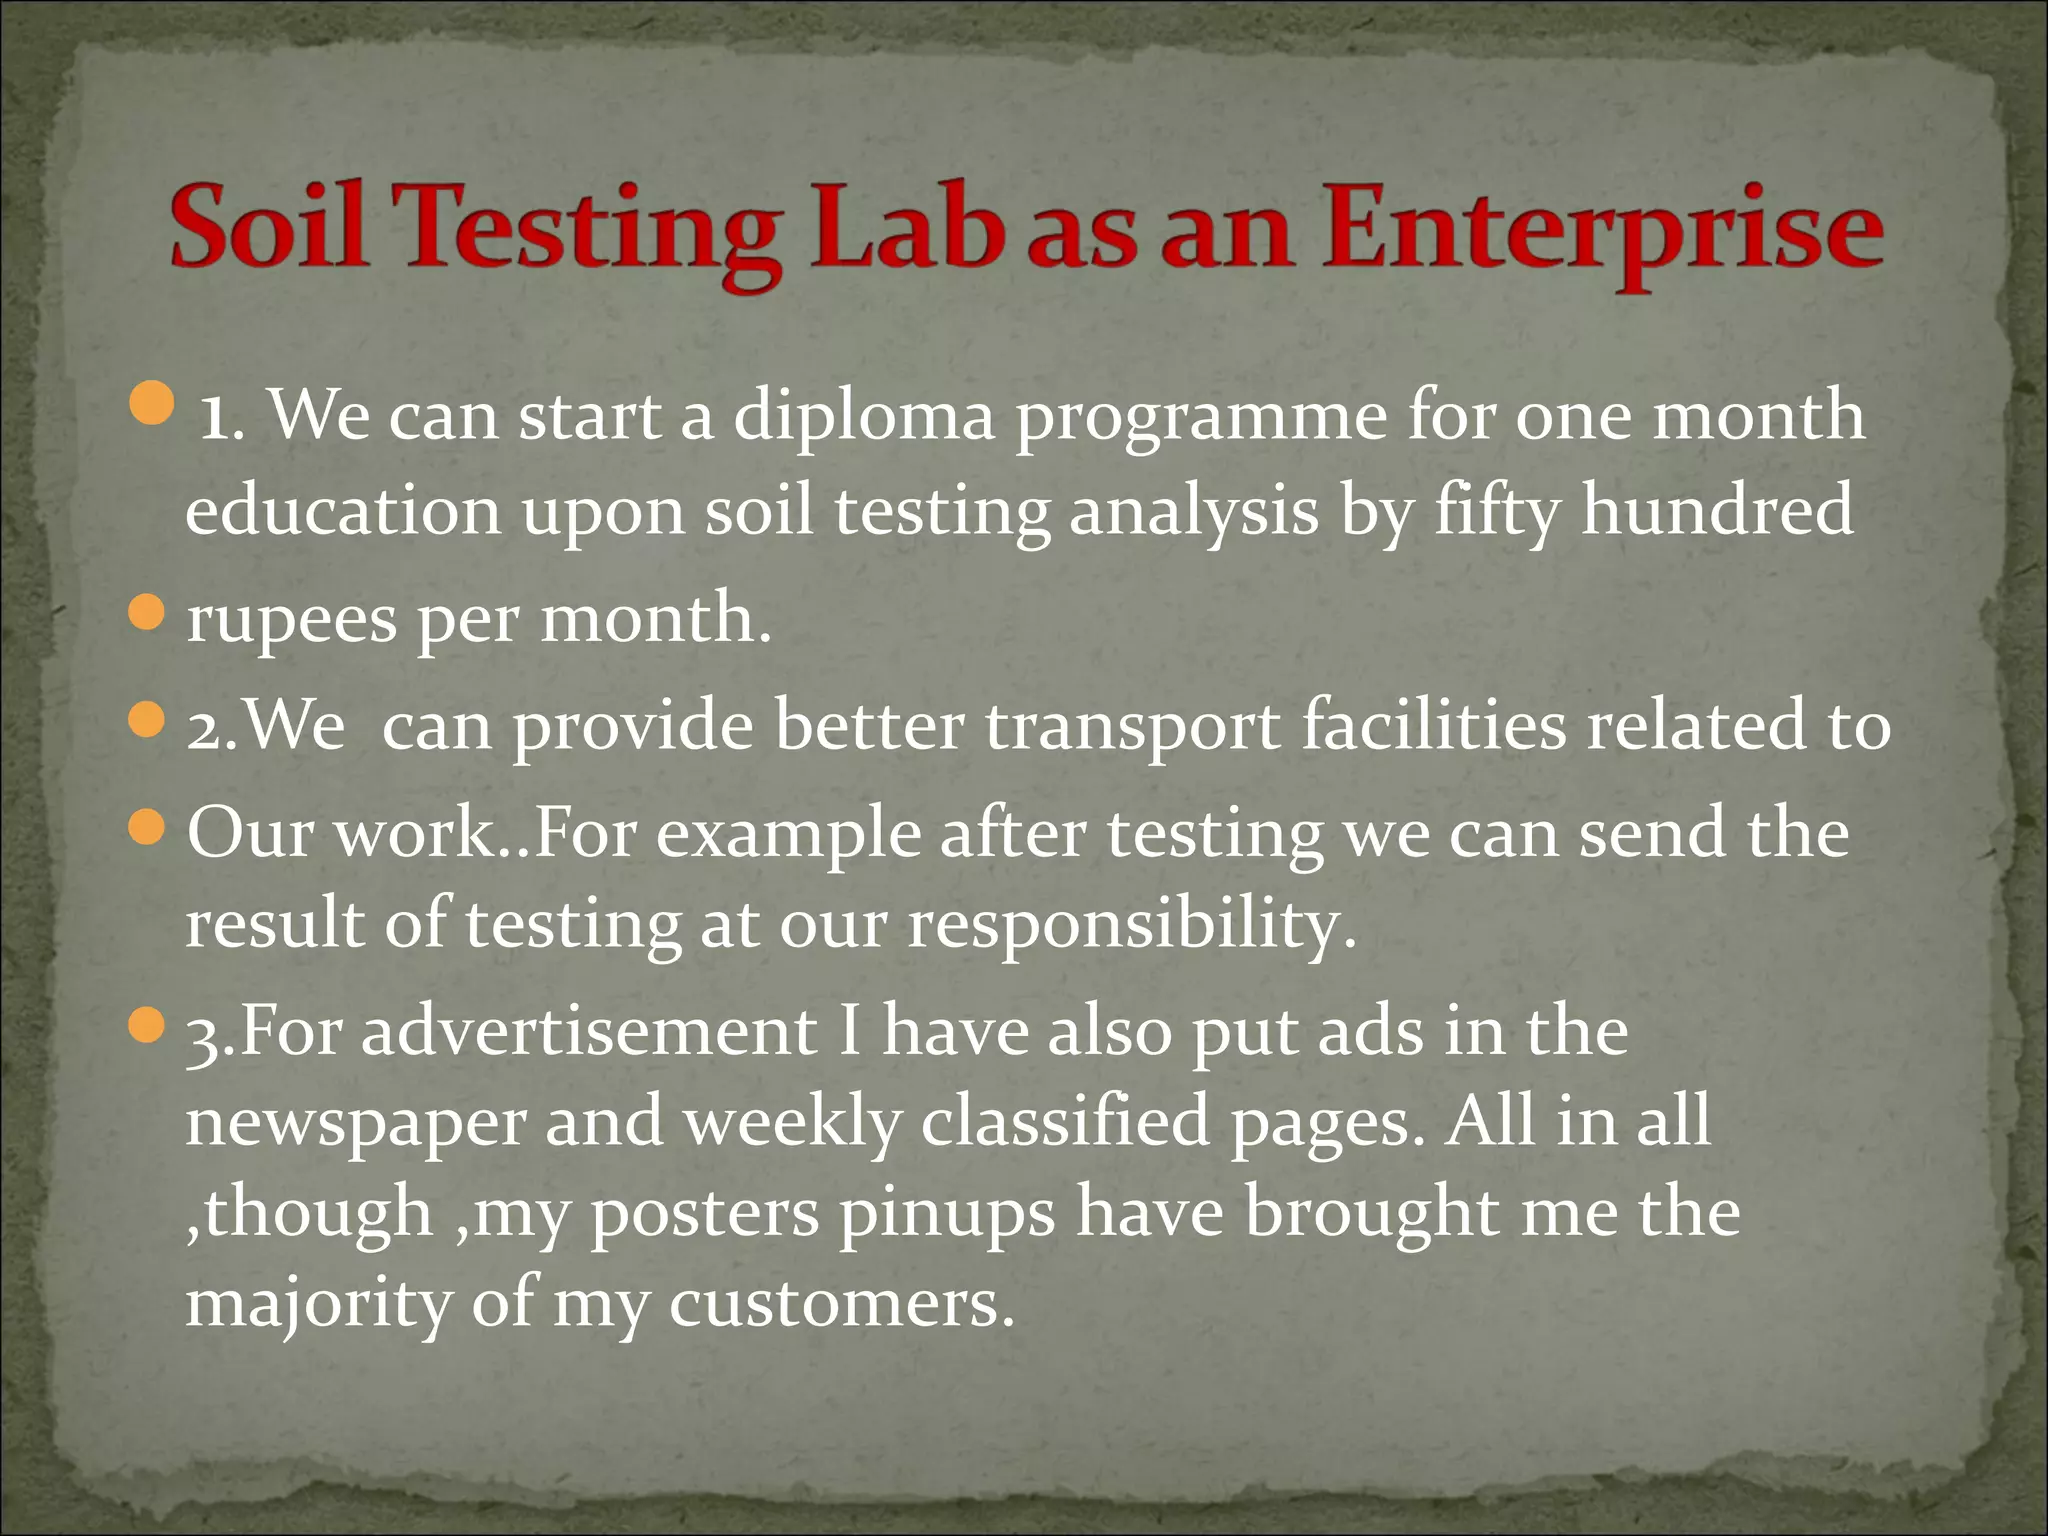
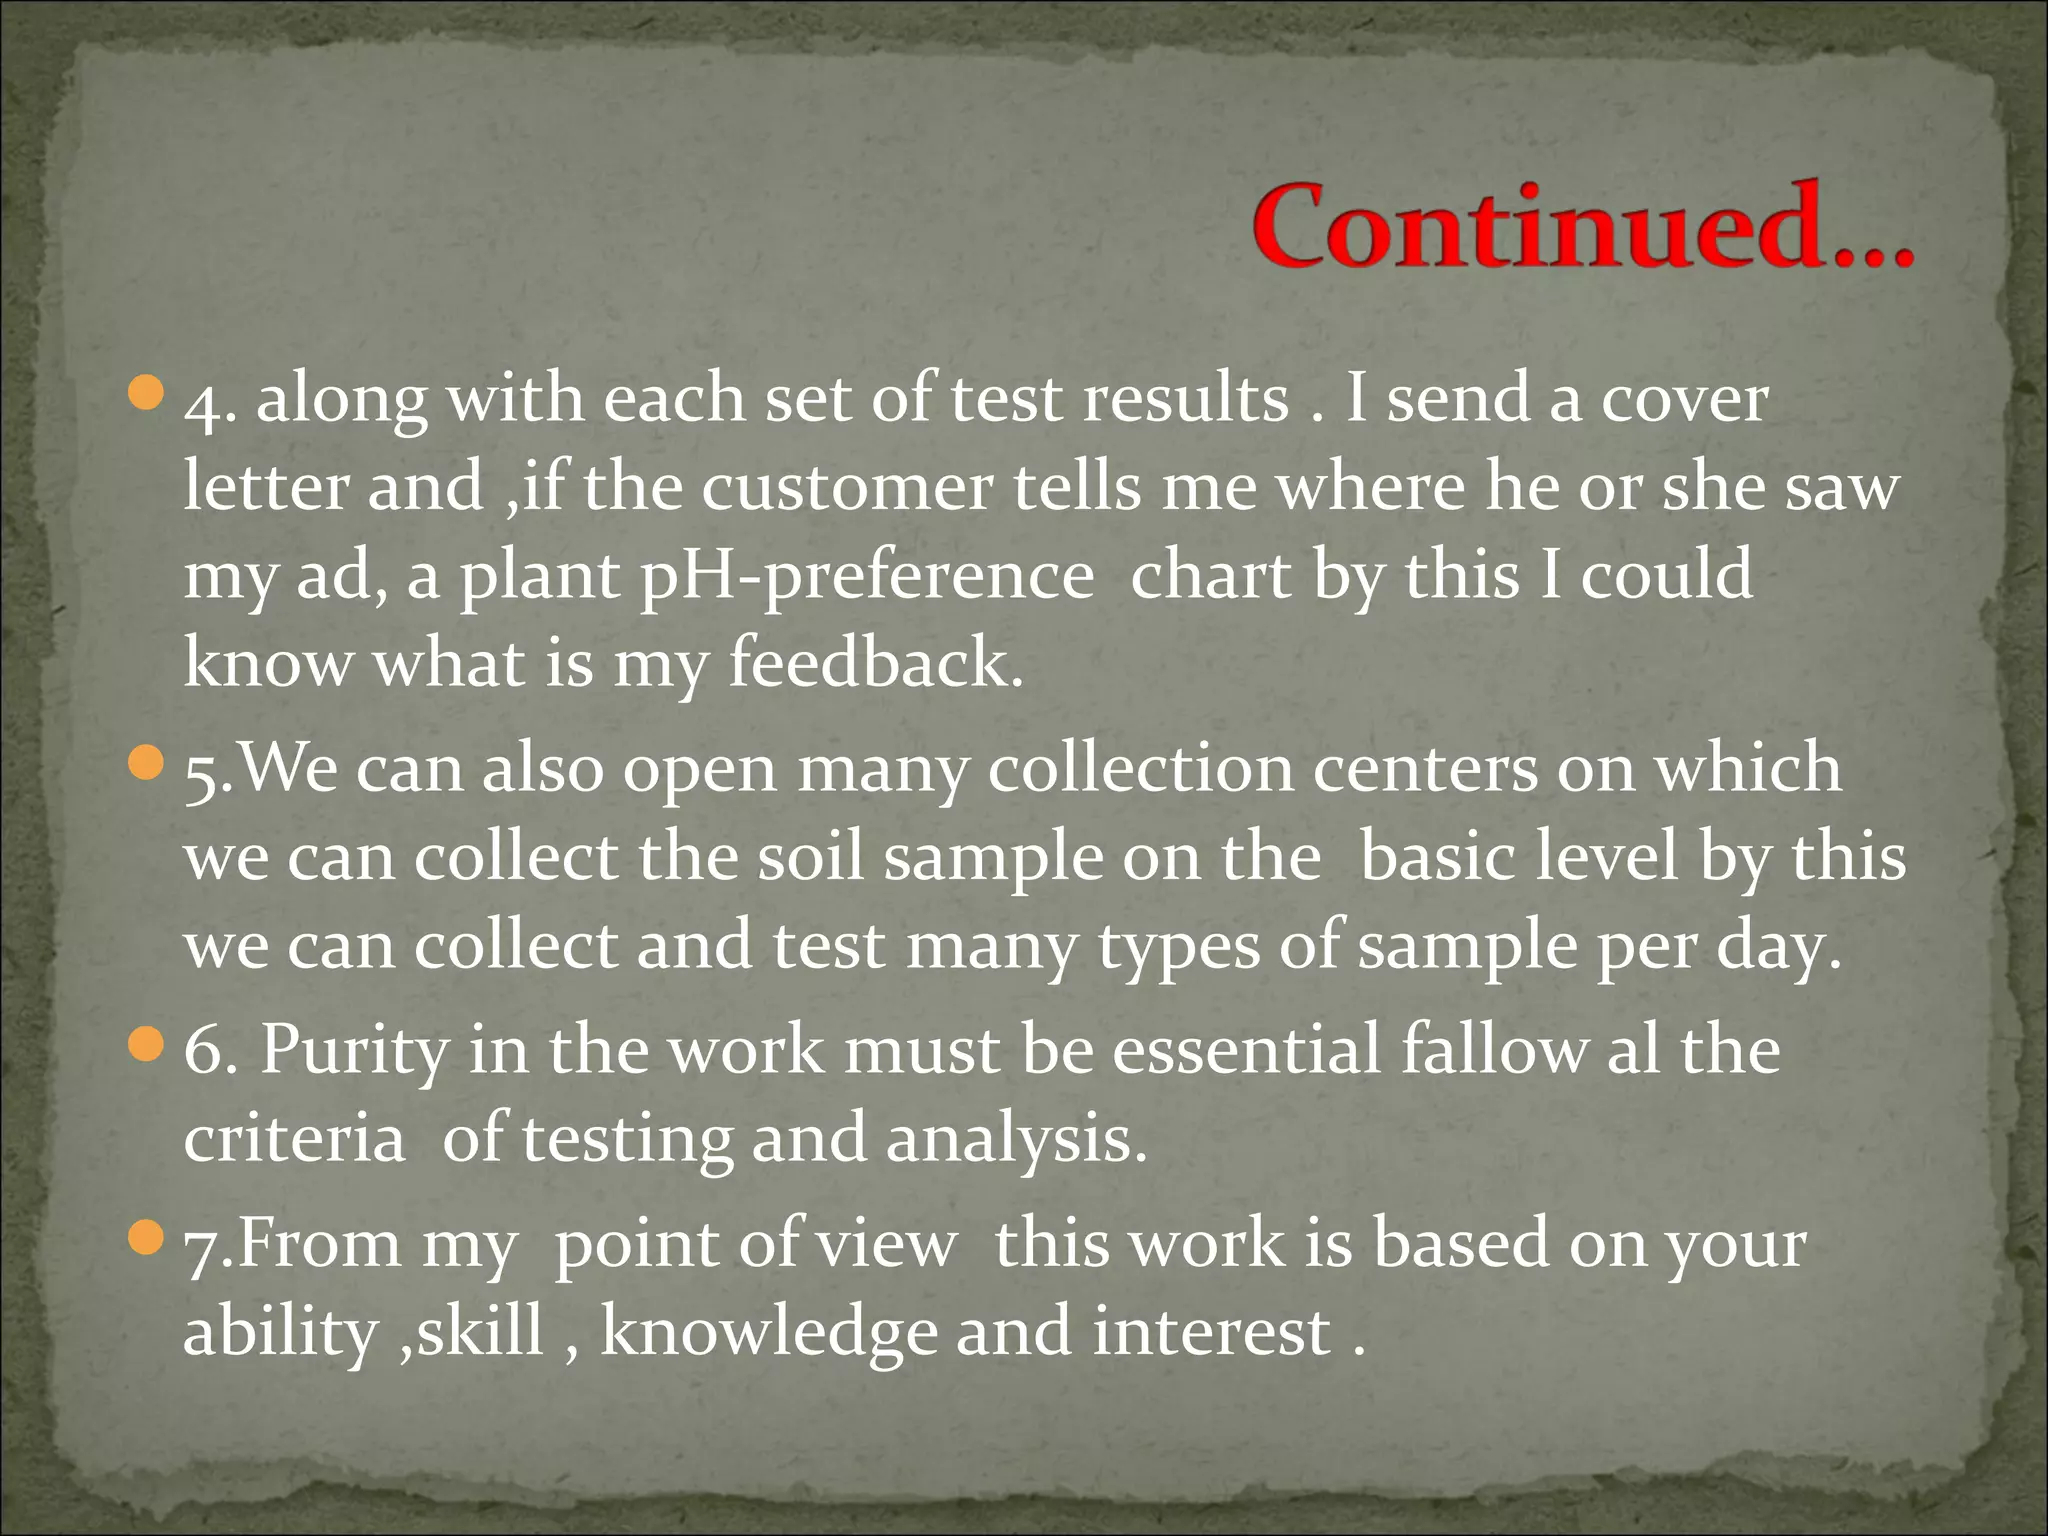
The document discusses starting a soil testing service, including details on collecting soil samples, analyzing samples for pH, electrical conductivity, organic carbon, nitrogen, phosphorus, and potassium. It also provides recommendations on fertilizer requirements for different crops based on soil test results and calculates the costs, income, and profitability of operating the soil testing service.


