Download to read offline
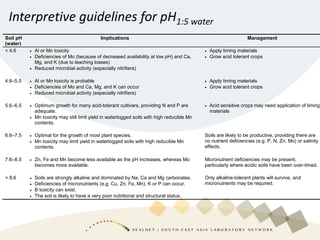
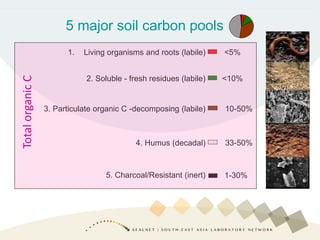
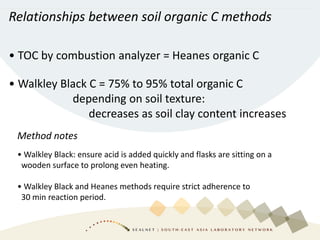
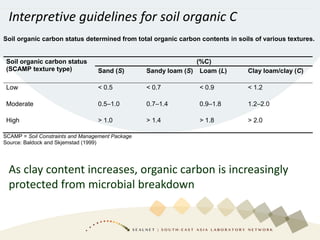
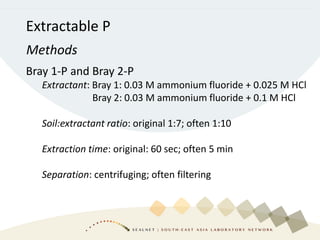
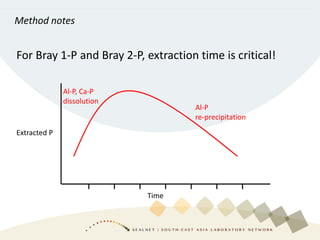
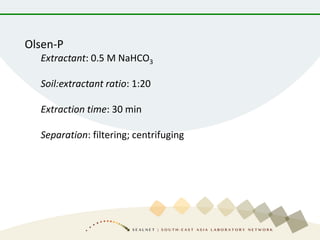
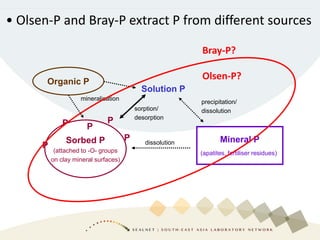
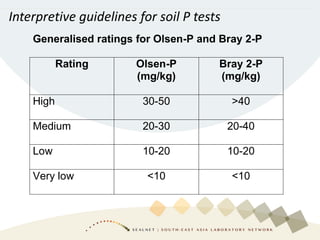
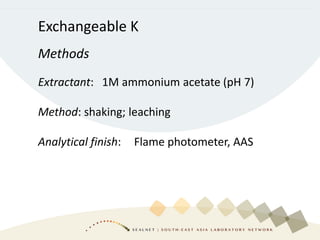
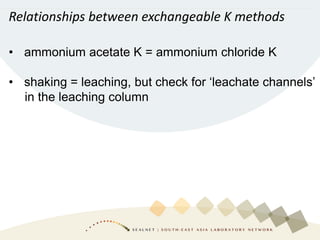
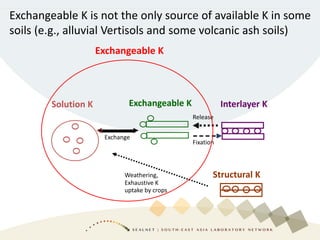
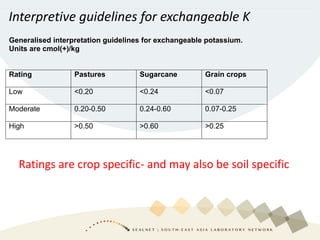


The document provides guidelines and methodologies for soil testing, emphasizing the importance of key soil tests for fertility assessment, including pH, electrical conductivity, and organic carbon levels. It outlines the implications of different pH levels on soil management and crop growth, as well as the interpretation of various extraction methods for phosphorus and potassium availability. Additionally, it stresses that soil test results may vary based on method conditions and that interpretive guidelines should be specific to soil types and crops.


