September 2021 Market Watch Report
•
0 likes•136 views

Sales in the GTA decreased 18% year-over-year in September 2021, while average home prices increased 18.3% to $1,136,280. New listings were down 34% compared to September 2020, contributing to tighter market conditions and higher prices. Demand remained strong but supply issues persisted, with many buyers unable to find suitable properties. Price growth was driven by detached and semi-detached houses as well as townhouses, while condo apartment prices also increased with more first-time buyers entering the ownership market.

Recommended
Recommended
More Related Content
What's hot
What's hot (20)
Similar to September 2021 Market Watch Report
Similar to September 2021 Market Watch Report (20)
More from Michelle Makos
More from Michelle Makos (12)
Recently uploaded
Recently uploaded (20)
September 2021 Market Watch Report
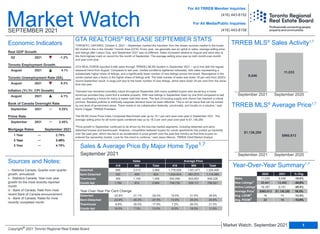
- 1. Sales New Listings Active Listings Average Price Avg. LDOM Avg. PDOM 11,033 9,046 -18.0% 20,441 13,483 -34.0% 18,167 9,191 -49.4% $960,613 $1,136,280 18.3% 16 14 -12.5% 22 19 -13.6% 2020 2021 % Chg. Year Market Watch SEPTEMBER 2021 Economic Indicators September 2021 GTA REALTORS® RELEASE SEPTEMBER STATS TORONTO, ONTARIO, October 5, 2021 – September marked the transition from the slower summer market to the busier fall market in the in the Greater Toronto Area (GTA). Every year, we generally see an uptick in sales, average selling price and listings after Labour Day, and September 2021 was no different. Sales increased relative to August and were also at the third-highest mark on record for the month of September. The average selling price was up both month-over-month and year-over-year. GTA REALTORS® reported 9,046 sales through TRREB’s MLS® System in September 2021 – up in line with the regular seasonal trend from August. Compared to last year, market conditions tightened noticeably, with sales representing a substantially higher share of listings, and a significantly lower number of new listings across the board. Resurgence in the condo market was a factor in the higher share of listings sold. The total number of sales was down 18 per cent from 2020’s record September result, in large part due to the lower number of new listings, which were down 34 per cent from the same time last year. “Demand has remained incredibly robust throughout September with many qualified buyers who would buy a home tomorrow provided they could find a suitable property. With new listings in September down by one third compared to last year, purchasing a home for many is easier said than done. The lack of housing supply and choice has reached a critical juncture. Bandaid policies to artificially suppress demand have not been effective. This is not an issue that can be solved by one level of government alone. There needs to be collaboration federally, provincially, and locally on a solution,” said Kevin Crigger, TRREB President. The MLS® Home Price Index Composite Benchmark was up by 19.1 per cent year-over-year in September 2021. The average selling price for all home types combined was up by 18.3 per cent year-over-year to $1,136,280. “Price growth in September continued to be driven by the low-rise market segments, including detached and semi- detached houses and townhouses. However, competition between buyers for condo apartments has picked up markedly over the past year, which has led to an acceleration in price growth over the past few months as first-time buyers re- entered the ownership market. Look for this trend to continue,” said Jason Mercer, TRREB Chief Market Analyst. Sources and Notes: i - Statistics Canada, Quarter-over-quarter growth, annualized ii - Statistics Canada, Year-over-year growth for the most recently reported month iii - Bank of Canada, Rate from most recent Bank of Canada announcement iv - Bank of Canada, Rates for most recently completed month For All TRREB Member Inquiries: For All Media/Public Inquiries: (416) 443-8152 (416) 443-8158 September 2020 September 2021 9,046 11,033 Detached Semi-Detached Townhouse Condo Apt 895 3,013 3,908 1,778,928 1,451,471 1,526,465 325 499 824 1,304,504 991,073 1,114,696 365 1,193 1,558 930,056 902,853 909,226 1,792 872 2,664 744,730 634,111 708,521 Sales Average Price 416 905 Total 416 905 Total Home Type Year-Over-Year Per Cent Change September 2020 September 2021 $1,136,280 $960,613 Detached Semi-Detached Townhouse Condo Apt -22.6% -31.1% -29.3% 19.5% 31.4% 28.9% -22.8% -30.2% -27.5% 13.9% 25.2% 20.8% -8.8% -20.0% -17.6% 7.2% 26.0% 21.5% 16.0% 7.3% 13.0% 8.5% 18.0% 11.6% TRREB MLS® Sales Activity1,7 TRREB MLS® Average Price1,7 Sales & Average Price By Major Home Type1,7 Year-Over-Year Summary1,7 September 2021 0.25% September 2021 2.45% 1 Year 2.79% 3 Year 3.49% 5 Year 4.79% August 2021 4.1% August 2021 9.3% August 2021 9.1% Q2 2021 -1.2% Real GDP Growth Toronto Employment Growth Toronto Unemployment Rate (SA) Inflation (Yr./Yr. CPI Growth) Bank of Canada Overnight Rate Prime Rate 1 Market Watch, September 2021 Copyright® 2021 Toronto Regional Real Estate Board September 2021 Mortgage Rates 2 3 1 5 5
- 2. Toronto Regional Real Estate Board YEAR-TO-DATE, 2021 $0 to $99,999 $100,000 to $199,999 $200,000 to $299,999 $300,000 to $399,999 $400,000 to $499,999 $500,000 to $599,999 $600,000 to $699,999 $700,000 to $799,999 $800,000 to $899,999 $900,000 to $999,999 $1,000,000 to $1,249,999 $1,250,000 to $1,499,999 $1,500,000 to $1,749,999 $1,750,000 to $1,999,999 $2,000,000+ 0 0 0 0 0 0 0 0 0 0 0 0 0 0 1 0 1 0 0 2 2 0 0 1 4 0 1 0 0 8 2 0 0 2 28 0 2 0 1 35 7 1 0 19 277 0 2 0 1 307 29 2 1 51 745 0 0 1 1 830 59 23 21 175 706 0 2 2 1 989 121 44 94 218 353 5 0 2 0 837 220 120 173 144 207 13 0 1 1 879 325 179 210 61 126 13 0 0 0 914 854 263 198 37 100 15 0 3 0 1,470 900 109 88 17 45 18 0 1 0 1,178 503 46 24 6 23 4 0 1 0 607 303 15 5 3 19 0 0 0 0 345 583 22 7 3 30 0 0 0 0 645 Detached Semi-Detached Att/Row/Twnhouse Condo Townhouse Condo Apt Link Co-Op Apt Det Condo Co-Ownership Apt Total Name $0 to $99,999 $100,000 to $199,999 $200,000 to $299,999 $300,000 to $399,999 $400,000 to $499,999 $500,000 to $599,999 $600,000 to $699,999 $700,000 to $799,999 $800,000 to $899,999 $900,000 to $999,999 $1,000,000 to $1,249,999 $1,250,000 to $1,499,999 $1,500,000 to $1,749,999 $1,750,000 to $1,999,999 $2,000,000+ 0 0 0 0 4 0 0 0 0 4 2 0 0 0 28 0 2 0 0 32 19 0 0 5 76 0 10 0 2 112 49 1 7 25 429 0 20 1 14 546 140 8 4 283 3,462 0 12 0 10 3,919 454 57 35 919 8,118 3 11 4 10 9,611 988 382 506 2,058 6,455 29 19 24 6 10,467 2,106 689 1,628 2,206 3,022 83 4 16 1 9,755 3,534 1,753 2,380 1,264 1,781 132 4 16 3 10,867 4,649 2,327 1,885 414 976 122 4 13 0 10,390 9,983 2,211 1,765 349 827 198 3 9 0 15,345 9,096 751 603 152 351 93 5 6 0 11,057 5,039 414 172 57 165 7 1 3 0 5,858 2,788 176 52 24 98 1 3 1 0 3,143 5,398 199 78 27 196 0 0 1 0 5,899 Detached Semi-Detached Att/Row/Twnhouse Condo Townhouse Condo Apt Link Co-Op Apt Det Condo Co-Ownership Apt Total Name SEPTEMBER 2021 SALES BY PRICE RANGE AND HOUSE TYPE 1,7 SALES BY PRICE RANGE AND HOUSE TYPE 1,7 Total Sales Share of Total Sales (%) Average Price ($) 3,908 824 821 737 2,664 68 8 11 5 9,046 43.2% 9.1% 9.1% 8.1% 29.4% 0.8% 0.1% 0.1% 0.1% 100.0% $1,526,465 $1,114,696 $1,016,269 $789,983 $708,521 $1,092,283 $419,875 $940,182 $560,800 $1,136,280 44,248 8,972 9,115 7,783 25,988 668 98 94 46 97,012 45.6% 9.2% 9.4% 8.0% 26.8% 0.7% 0.1% 0.1% 0.0% 100.0% $1,409,257 $1,054,319 $954,336 $755,944 $672,583 $1,000,587 $628,227 $883,419 $486,270 $1,079,381 Total Sales Share of Total Sales (%) Average Price ($)
- 3. TRREB Total 9,046 $10,278,787,564 $1,136,280 $970,000 13,483 70.6% 9,191 1.0 106% 14 19 Halton Region 835 $1,041,959,876 $1,247,856 $1,143,000 1,082 78.6% 537 0.7 105% 11 14 Burlington 279 $302,486,411 $1,084,181 $990,000 318 81.5% 147 0.7 105% 11 14 Halton Hills 81 $95,000,949 $1,172,851 $1,050,000 117 81.1% 61 0.7 107% 10 12 Milton 174 $196,357,791 $1,128,493 $1,050,000 240 78.0% 102 0.5 107% 9 12 Oakville 301 $448,114,725 $1,488,753 $1,350,000 407 76.3% 227 0.9 104% 12 16 Peel Region 1,829 $1,988,709,225 $1,087,321 $971,000 2,295 73.2% 1,239 0.8 105% 12 16 Brampton 854 $916,331,654 $1,072,988 $976,500 1,001 74.4% 399 0.6 105% 11 13 Caledon 113 $177,645,799 $1,572,087 $1,359,000 155 72.7% 109 1.0 102% 13 19 Mississauga 862 $894,731,772 $1,037,972 $902,500 1,139 72.0% 731 1.0 104% 14 19 City of Toronto 3,397 $3,703,396,553 $1,090,196 $860,000 5,946 64.3% 4,821 1.4 105% 16 22 Toronto West 819 $830,315,402 $1,013,816 $900,000 1,387 66.8% 1,086 1.2 105% 16 21 Toronto Central 1,648 $1,939,307,566 $1,176,764 $791,444 3,256 59.7% 3,023 1.8 102% 18 26 Toronto East 930 $933,773,585 $1,004,058 $960,500 1,303 72.0% 712 0.8 111% 13 17 York Region 1,695 $2,303,521,114 $1,359,010 $1,250,000 2,424 69.6% 1,715 1.2 106% 16 21 Aurora 84 $118,095,034 $1,405,893 $1,192,500 144 73.2% 88 1.0 105% 18 22 East Gwillimbury 64 $81,953,214 $1,280,519 $1,245,500 68 77.2% 43 0.9 111% 13 13 Georgina 96 $87,959,441 $916,244 $886,000 128 74.6% 90 0.9 109% 18 22 King 44 $107,440,388 $2,441,827 $2,175,500 64 63.8% 79 2.4 99% 31 42 Markham 456 $616,908,338 $1,352,869 $1,300,000 614 70.6% 376 1.1 109% 16 20 Newmarket 115 $130,984,865 $1,138,999 $1,075,000 172 76.5% 94 0.7 109% 9 11 Richmond Hill 326 $469,777,463 $1,441,035 $1,329,094 516 64.6% 411 1.5 106% 16 22 Vaughan 426 $565,843,443 $1,328,271 $1,250,000 609 67.1% 454 1.3 104% 16 21 Whitchurch-Stouffville 84 $124,558,928 $1,482,844 $1,257,900 109 73.2% 80 1.2 105% 19 22 Durham Region 1,006 $973,944,960 $968,136 $900,000 1,314 80.6% 585 0.5 115% 9 10 Ajax 140 $142,684,393 $1,019,174 $980,500 162 79.7% 53 0.4 114% 7 9 Brock 20 $17,476,500 $873,825 $814,000 31 81.3% 22 0.8 109% 14 14 Clarington 187 $175,353,588 $937,720 $860,000 237 82.8% 101 0.5 118% 8 9 Oshawa 293 $244,538,637 $834,603 $788,888 381 80.3% 172 0.5 117% 9 10 Pickering 126 $130,796,628 $1,038,068 $966,250 174 77.7% 87 0.6 111% 10 11 Scugog 35 $35,952,869 $1,027,225 $985,000 51 80.6% 38 1.0 111% 13 15 Uxbridge 20 $24,247,300 $1,212,365 $1,155,000 37 81.2% 32 1.0 107% 12 15 Whitby 185 $202,895,045 $1,096,730 $1,006,111 241 82.0% 80 0.4 117% 7 9 Dufferin County 47 $35,554,500 $756,479 $750,000 62 87.1% 32 0.5 103% 10 14 Orangeville 47 $35,554,500 $756,479 $750,000 62 87.1% 32 0.5 103% 10 14 Simcoe County 237 $231,701,336 $977,643 $899,000 360 77.3% 262 0.8 103% 15 19 Adjala-Tosorontio 11 $14,978,000 $1,361,636 $1,275,000 20 76.1% 19 1.2 101% 28 39 Bradford West Gwillimbury 45 $50,755,688 $1,127,904 $1,082,500 74 76.0% 49 0.8 104% 9 14 Essa 31 $24,959,850 $805,156 $725,000 44 84.3% 31 0.6 101% 14 16 Innisfil 75 $72,837,499 $971,167 $895,000 120 73.4% 99 1.0 103% 16 19 New Tecumseth 75 $68,170,299 $908,937 $849,800 102 80.9% 64 0.8 102% 15 20 Sub_Municipality # of Sales Dollar Volume Average Price Median Price New Listings SNLR (Trend) Active Listings Mos Inv (Trend) Avg. SP/LP Avg. LDOM Avg. PDOM Toronto Regional Real Estate Board SUMMARY OF EXISTING HOME TRANSACTIONS ALL TRREB AREAS ALL HOME TYPES, SEPTEMBER 2021 1 1 1 2 8 3 9 4 5 3 Market Watch, September 2021 Copyright® 2021 Toronto Regional Real Estate Board 5
- 4. TRREB Total 9,046 $10,278,787,564 $1,136,280 $970,000 13,483 70.6% 9,191 1.0 106% 14 19 City of Toronto Total 3,397 $3,703,396,553 $1,090,196 $860,000 5,946 64.3% 4,821 1.4 105% 16 22 Toronto West 819 $830,315,402 $1,013,816 $900,000 1,387 66.8% 1,086 1.2 105% 16 21 Toronto W01 48 $57,748,200 $1,203,088 $860,000 92 69.2% 56 0.9 105% 15 20 Toronto W02 77 $105,960,593 $1,376,112 $1,240,000 133 69.2% 80 0.8 110% 10 14 Toronto W03 66 $67,437,486 $1,021,780 $990,000 103 64.0% 70 1.1 108% 17 21 Toronto W04 72 $64,863,569 $900,883 $779,900 152 62.8% 140 1.5 105% 17 25 Toronto W05 129 $106,697,313 $827,111 $830,000 184 69.0% 150 1.2 104% 16 20 Toronto W06 137 $133,592,277 $975,126 $910,000 249 63.4% 226 1.4 104% 16 23 Toronto W07 28 $38,929,192 $1,390,328 $1,390,500 35 66.0% 20 1.2 107% 14 20 Toronto W08 146 $155,440,472 $1,064,661 $720,000 252 69.5% 197 1.2 105% 15 20 Toronto W09 43 $40,078,788 $932,065 $870,000 77 65.9% 62 1.3 107% 25 36 Toronto W10 73 $59,567,512 $815,993 $785,000 110 69.6% 85 1.1 104% 14 23 Toronto Central 1,648 $1,939,307,566 $1,176,764 $791,444 3,256 59.7% 3,023 1.8 102% 18 26 Toronto C01 528 $473,880,902 $897,502 $750,000 957 60.7% 801 1.7 103% 17 24 Toronto C02 103 $170,536,580 $1,655,695 $1,250,000 217 50.4% 233 2.6 100% 24 38 Toronto C03 66 $114,612,732 $1,736,557 $1,227,500 117 57.2% 104 1.6 102% 26 37 Toronto C04 70 $146,587,076 $2,094,101 $1,934,000 166 62.6% 131 1.4 105% 13 20 Toronto C06 31 $34,344,225 $1,107,878 $685,000 61 58.3% 65 1.5 99% 23 32 Toronto C07 90 $98,378,350 $1,093,093 $767,000 200 59.5% 208 1.8 103% 21 34 Toronto C08 199 $161,008,780 $809,089 $711,500 502 57.2% 482 1.9 102% 15 21 Toronto C09 24 $63,130,800 $2,630,450 $2,275,000 64 56.6% 67 2.3 100% 49 56 Toronto C10 82 $83,699,341 $1,020,724 $867,500 143 62.4% 134 1.6 105% 14 21 Toronto C11 39 $43,246,400 $1,108,882 $605,000 75 59.2% 62 1.5 108% 15 23 Toronto C12 25 $140,643,000 $5,625,720 $3,675,000 77 50.8% 114 3.5 95% 37 54 Toronto C13 71 $89,663,961 $1,262,873 $1,075,000 123 64.6% 112 1.4 104% 17 25 Toronto C14 156 $167,649,356 $1,074,675 $723,444 262 61.4% 245 1.7 102% 17 23 Toronto C15 164 $151,926,063 $926,378 $711,750 292 64.6% 265 1.4 105% 16 22 Toronto East 930 $933,773,585 $1,004,058 $960,500 1,303 72.0% 712 0.8 111% 13 17 Toronto E01 82 $108,944,989 $1,328,597 $1,320,250 141 68.3% 83 0.8 118% 9 13 Toronto E02 77 $107,684,567 $1,398,501 $1,265,000 124 70.3% 56 0.8 111% 10 15 Toronto E03 98 $113,651,200 $1,159,706 $1,122,500 172 64.9% 109 0.9 109% 16 21 Toronto E04 98 $80,644,592 $822,904 $840,000 135 71.5% 66 0.8 108% 15 21 Toronto E05 112 $103,311,428 $922,423 $812,500 148 71.1% 75 1.0 115% 12 16 Toronto E06 41 $43,662,716 $1,064,944 $920,000 58 66.3% 35 1.0 105% 14 19 Toronto E07 96 $86,476,467 $900,797 $834,444 120 75.3% 69 0.8 112% 15 19 Toronto E08 76 $72,604,073 $955,317 $973,950 98 73.3% 56 1.0 108% 15 19 Toronto E09 110 $90,010,757 $818,280 $687,944 142 79.4% 74 0.8 113% 12 14 Toronto E10 61 $65,898,927 $1,080,310 $1,030,000 80 73.8% 42 0.9 111% 11 16 Toronto E11 79 $60,883,869 $770,682 $751,000 85 77.8% 47 0.7 106% 16 17 Municipality # of Sales Dollar Volume Average Price Median Price New Listings SNLR (Trend) Active Listings Mos Inv (Trend) Avg. SP/LP Avg. LDOM Avg. PDOM Toronto Regional Real Estate Board ALL HOME TYPES, SEPTEMBER 2021 SUMMARY OF EXISTING HOME TRANSACTIONS CITY OF TORONTO MUNICIPAL BREAKDOWN 1 1 1 2 8 3 9 4 5 4 Market Watch, September 2021 Copyright® 2021 Toronto Regional Real Estate Board 5
- 5. TRREB Total 97,012 $104,712,909,036 $1,079,381 $929,000 139,616 106% 13 18 Halton Region 9,665 $11,702,388,141 $1,210,801 $1,070,000 12,720 105% 11 14 Burlington 2,814 $3,000,824,384 $1,066,391 $960,000 3,567 106% 12 14 Halton Hills 905 $997,926,630 $1,102,681 $985,000 1,151 107% 10 12 Milton 2,411 $2,521,829,804 $1,045,968 $965,000 3,245 106% 9 12 Oakville 3,535 $5,181,807,323 $1,465,858 $1,295,088 4,757 104% 13 17 Peel Region 19,830 $20,571,325,120 $1,037,384 $935,000 27,899 104% 11 15 Brampton 9,728 $9,903,743,415 $1,018,066 $940,000 13,661 105% 10 13 Caledon 1,099 $1,572,711,674 $1,431,039 $1,280,000 1,644 103% 12 17 Mississauga 9,003 $9,094,870,031 $1,010,204 $885,000 12,594 104% 13 18 City of Toronto 33,783 $35,382,074,215 $1,047,334 $830,000 51,689 105% 16 22 Toronto West 8,507 $8,455,007,458 $993,888 $875,000 12,713 106% 15 20 Toronto Central 16,832 $18,583,309,261 $1,104,046 $759,000 26,963 103% 18 26 Toronto East 8,444 $8,343,757,496 $988,129 $945,000 12,013 110% 12 16 York Region 17,908 $22,676,519,546 $1,266,279 $1,160,000 26,602 105% 15 20 Aurora 1,137 $1,442,029,474 $1,268,276 $1,160,000 1,623 105% 14 19 East Gwillimbury 738 $921,114,714 $1,248,123 $1,179,950 1,006 107% 14 16 Georgina 1,053 $910,104,527 $864,297 $805,000 1,484 107% 14 17 King 458 $932,715,229 $2,036,496 $1,883,750 764 99% 27 37 Markham 4,518 $5,717,387,543 $1,265,469 $1,200,000 6,539 108% 14 18 Newmarket 1,520 $1,650,424,053 $1,085,805 $1,025,000 2,107 107% 10 13 Richmond Hill 3,189 $4,262,914,982 $1,336,756 $1,238,000 5,106 105% 16 23 Vaughan 4,428 $5,689,596,808 $1,284,913 $1,195,000 6,734 104% 15 21 Whitchurch-Stouffville 867 $1,150,232,216 $1,326,681 $1,170,000 1,239 105% 17 21 Durham Region 12,002 $10,899,457,644 $908,137 $850,000 15,562 112% 9 11 Ajax 1,765 $1,691,686,299 $958,462 $905,000 2,316 112% 8 10 Brock 255 $201,801,608 $791,379 $740,000 340 105% 13 17 Clarington 2,175 $1,894,298,430 $870,942 $815,517 2,720 114% 8 10 Oshawa 3,533 $2,760,270,462 $781,282 $750,000 4,563 114% 9 11 Pickering 1,498 $1,518,708,658 $1,013,824 $915,000 2,042 109% 10 12 Scugog 304 $300,163,196 $987,379 $879,450 403 108% 15 18 Uxbridge 300 $378,039,920 $1,260,133 $1,161,500 392 106% 15 17 Whitby 2,172 $2,154,489,071 $991,938 $935,000 2,786 113% 7 9 Dufferin County 591 $464,938,572 $786,698 $767,000 717 106% 10 11 Orangeville 591 $464,938,572 $786,698 $767,000 717 106% 10 11 Simcoe County 3,233 $3,016,205,798 $932,943 $859,000 4,427 104% 13 16 Adjala-Tosorontio 180 $215,374,391 $1,196,524 $1,072,500 241 102% 18 21 Bradford West Gwillimbury 766 $807,925,013 $1,054,732 $983,333 1,083 105% 11 15 Essa 388 $315,533,188 $813,230 $738,800 486 104% 11 13 Innisfil 1,044 $939,274,936 $899,689 $830,000 1,496 103% 15 19 New Tecumseth 855 $738,098,270 $863,273 $817,500 1,121 104% 12 15 Sub_Municipality Number of Sales Dollar Volume Average Price Median Price New Listings Avg. SP/LP Avg. LDOM Avg. PDOM Toronto Regional Real Estate Board SUMMARY OF EXISTING HOME TRANSACTIONS ALL TRREB AREAS ALL HOME TYPES, YEAR-TO-DATE 2021 1 1 1 2 4 5 5 Market Watch, September 2021 Copyright® 2021 Toronto Regional Real Estate Board 5
- 6. TRREB Total 97,012 $104,712,909,036 $1,079,381 $929,000 139,616 106% 13 18 City of Toronto Total 33,783 $35,382,074,215 $1,047,334 $830,000 51,689 105% 16 22 Toronto West 8,507 $8,455,007,458 $993,888 $875,000 12,713 106% 15 20 Toronto W01 529 $678,513,547 $1,282,634 $980,000 760 109% 12 16 Toronto W02 823 $1,015,882,990 $1,234,366 $1,180,000 1,203 111% 10 14 Toronto W03 608 $611,996,364 $1,006,573 $977,500 970 110% 13 18 Toronto W04 831 $719,857,314 $866,254 $805,000 1,352 105% 17 23 Toronto W05 1,162 $949,902,285 $817,472 $850,000 1,704 105% 16 21 Toronto W06 1,548 $1,408,399,601 $909,819 $800,000 2,408 103% 16 22 Toronto W07 237 $376,675,995 $1,589,350 $1,450,000 353 107% 13 20 Toronto W08 1,631 $1,767,457,274 $1,083,665 $715,000 2,275 104% 16 21 Toronto W09 434 $407,628,384 $939,236 $915,000 659 105% 16 22 Toronto W10 704 $518,693,704 $736,781 $622,750 1,029 104% 15 20 Toronto Central 16,832 $18,583,309,261 $1,104,046 $759,000 26,963 103% 18 26 Toronto C01 5,443 $4,630,926,203 $850,804 $715,000 8,237 103% 18 26 Toronto C02 786 $1,281,211,308 $1,630,040 $1,210,000 1,549 101% 22 32 Toronto C03 486 $813,107,631 $1,673,061 $1,284,750 896 104% 15 21 Toronto C04 807 $1,774,103,255 $2,198,393 $2,004,000 1,287 102% 14 21 Toronto C06 350 $399,389,440 $1,141,113 $887,450 591 103% 15 20 Toronto C07 1,074 $1,198,099,345 $1,115,549 $789,000 1,775 103% 19 27 Toronto C08 2,486 $1,958,384,084 $787,765 $686,000 4,074 103% 19 26 Toronto C09 275 $644,465,653 $2,343,511 $1,680,000 456 100% 24 32 Toronto C10 825 $841,939,443 $1,020,533 $768,000 1,255 103% 18 27 Toronto C11 417 $491,598,983 $1,178,894 $675,000 692 104% 15 22 Toronto C12 296 $970,943,004 $3,280,213 $2,817,500 602 98% 24 36 Toronto C13 656 $810,347,077 $1,235,285 $919,000 1,039 104% 17 22 Toronto C14 1,317 $1,327,542,236 $1,008,005 $708,880 2,062 102% 18 25 Toronto C15 1,614 $1,441,251,599 $892,969 $680,500 2,448 104% 17 23 Toronto East 8,444 $8,343,757,496 $988,129 $945,000 12,013 110% 12 16 Toronto E01 817 $1,019,447,495 $1,247,794 $1,250,000 1,213 115% 9 12 Toronto E02 662 $930,293,599 $1,405,277 $1,300,000 963 112% 10 13 Toronto E03 943 $1,132,662,588 $1,201,127 $1,175,000 1,489 112% 11 15 Toronto E04 961 $822,835,143 $856,228 $881,000 1,370 108% 12 16 Toronto E05 832 $742,192,092 $892,058 $788,444 1,185 111% 13 16 Toronto E06 359 $401,055,034 $1,117,145 $992,000 572 107% 11 15 Toronto E07 894 $746,987,062 $835,556 $768,400 1,229 111% 13 16 Toronto E08 579 $555,841,491 $960,003 $925,000 828 107% 13 19 Toronto E09 1,025 $790,464,029 $771,184 $680,000 1,288 109% 13 18 Toronto E10 589 $599,879,143 $1,018,471 $1,000,000 836 109% 12 15 Toronto E11 783 $602,099,820 $768,965 $767,000 1,040 108% 13 15 Municipality Number of Sales Dollar Volume Average Price Median Price New Listings Avg. SP/LP Avg. LDOM Avg. PDOM Toronto Regional Real Estate Board SUMMARY OF EXISTING HOME TRANSACTIONS CITY OF TORONTO MUNICIPAL BREAKDOWN ALL HOME TYPES, YEAR-TO-DATE 2021 1 1 1 2 4 5 6 Market Watch, September 2021 Copyright® 2021 Toronto Regional Real Estate Board 5
- 7. TRREB Total 3,908 $5,965,423,498 $1,526,465 $1,325,506 5,811 3,744 106% 13 Halton Region 423 $673,185,179 $1,591,454 $1,443,000 590 324 105% 11 Burlington 129 $179,881,207 $1,394,428 $1,350,000 161 89 107% 11 Halton Hills 65 $81,960,250 $1,260,927 $1,177,000 93 52 107% 11 Milton 74 $105,025,241 $1,419,260 $1,360,000 118 60 105% 11 Oakville 155 $306,318,481 $1,976,248 $1,738,000 218 123 104% 12 Peel Region 818 $1,196,131,586 $1,462,264 $1,310,000 1,095 569 104% 11 Brampton 432 $566,576,799 $1,311,520 $1,215,000 550 219 105% 10 Caledon 89 $155,880,400 $1,751,465 $1,480,000 130 103 102% 13 Mississauga 297 $473,674,387 $1,594,863 $1,410,000 415 247 104% 11 City of Toronto 895 $1,592,140,538 $1,778,928 $1,390,000 1,531 1,116 106% 14 Toronto West 288 $418,096,907 $1,451,725 $1,290,000 488 320 107% 13 Toronto Central 252 $699,967,894 $2,777,650 $2,200,000 535 551 101% 20 Toronto East 355 $474,075,737 $1,335,425 $1,208,000 508 245 112% 11 York Region 907 $1,576,861,690 $1,738,547 $1,555,000 1,385 1,088 105% 17 Aurora 47 $86,967,754 $1,850,378 $1,450,000 100 70 104% 21 East Gwillimbury 49 $67,683,926 $1,381,305 $1,425,000 52 38 111% 15 Georgina 81 $77,539,341 $957,276 $925,000 108 75 109% 12 King 37 $100,544,388 $2,717,416 $2,380,000 56 74 99% 34 Markham 191 $358,447,722 $1,876,690 $1,680,000 291 205 108% 18 Newmarket 75 $96,227,177 $1,283,029 $1,225,000 119 67 107% 9 Richmond Hill 168 $323,894,007 $1,927,941 $1,702,500 284 271 105% 17 Vaughan 202 $363,375,435 $1,798,888 $1,635,000 293 226 103% 15 Whitchurch-Stouffville 57 $102,181,940 $1,792,666 $1,435,000 82 62 104% 18 Durham Region 666 $723,729,669 $1,086,681 $1,050,000 895 403 115% 9 Ajax 83 $97,773,376 $1,177,992 $1,160,000 98 35 115% 8 Brock 20 $17,476,500 $873,825 $814,000 30 21 109% 14 Clarington 131 $135,189,907 $1,031,984 $975,000 172 74 118% 8 Oshawa 185 $172,063,723 $930,074 $875,000 244 106 117% 9 Pickering 69 $89,119,426 $1,291,586 $1,175,000 103 50 112% 9 Scugog 35 $35,952,869 $1,027,225 $985,000 50 32 111% 13 Uxbridge 16 $21,694,500 $1,355,906 $1,307,500 33 30 108% 10 Whitby 127 $154,459,368 $1,216,215 $1,190,000 165 55 116% 7 Dufferin County 20 $17,561,900 $878,095 $832,250 28 19 102% 12 Orangeville 20 $17,561,900 $878,095 $832,250 28 19 102% 12 Simcoe County 179 $185,812,936 $1,038,061 $950,000 287 225 103% 15 Adjala-Tosorontio 11 $14,978,000 $1,361,636 $1,275,000 20 19 101% 28 Bradford West Gwillimbury 38 $44,307,688 $1,165,992 $1,147,500 63 44 104% 9 Essa 20 $17,374,950 $868,748 $770,500 30 28 101% 17 Innisfil 59 $57,484,499 $974,314 $920,000 103 90 103% 15 New Tecumseth 51 $51,667,799 $1,013,094 $915,000 71 44 102% 15 Municipality Number of Sales Dollar Volume Average Price Median Price New Listings Active Listings Avg. SP/LP Avg. LDOM DETACHED, SEPTEMBER 2021 Toronto Regional Real Estate Board SUMMARY OF EXISTING HOME TRANSACTIONS ALL TRREB AREAS 1 1 2 4 5 1 1 3 7 Market Watch, September 2021 Copyright® 2021 Toronto Regional Real Estate Board
- 8. TRREB Total 3,908 $5,965,423,498 $1,526,465 $1,325,506 5,811 3,744 106% 13 City of Toronto 895 $1,592,140,538 $1,778,928 $1,390,000 1,531 1,116 106% 14 Toronto West 288 $418,096,907 $1,451,725 $1,290,000 488 320 107% 13 Toronto W01 11 $22,799,000 $2,072,636 $2,000,000 23 14 108% 12 Toronto W02 32 $60,619,788 $1,894,368 $1,871,500 51 26 110% 10 Toronto W03 35 $38,000,788 $1,085,737 $1,050,000 48 30 107% 17 Toronto W04 33 $41,010,794 $1,242,751 $1,192,000 69 57 107% 12 Toronto W05 30 $37,521,500 $1,250,717 $1,176,500 48 38 105% 15 Toronto W06 27 $36,267,751 $1,343,250 $1,201,500 51 36 106% 12 Toronto W07 20 $31,276,900 $1,563,845 $1,406,500 29 14 108% 15 Toronto W08 45 $86,273,598 $1,917,191 $1,670,000 84 61 107% 9 Toronto W09 20 $26,810,288 $1,340,514 $1,277,500 45 25 110% 15 Toronto W10 35 $37,516,500 $1,071,900 $1,026,000 40 19 105% 14 Toronto Central 252 $699,967,894 $2,777,650 $2,200,000 535 551 101% 20 Toronto C01 4 $8,170,000 $2,042,500 $1,927,500 13 11 109% 17 Toronto C02 8 $29,915,800 $3,739,475 $2,882,500 24 24 100% 29 Toronto C03 31 $74,137,000 $2,391,516 $1,685,000 53 42 102% 20 Toronto C04 44 $116,344,576 $2,644,195 $2,687,500 107 80 104% 14 Toronto C06 11 $21,170,325 $1,924,575 $1,750,000 18 22 98% 32 Toronto C07 22 $45,478,000 $2,067,182 $1,865,000 62 72 101% 20 Toronto C08 2 $4,535,000 $2,267,500 $2,267,500 5 6 102% 36 Toronto C09 9 $42,976,000 $4,775,111 $3,860,000 19 15 100% 12 Toronto C10 9 $20,269,039 $2,252,115 $2,410,000 16 8 106% 12 Toronto C11 9 $24,084,000 $2,676,000 $2,588,000 16 6 112% 5 Toronto C12 19 $130,038,000 $6,844,105 $5,000,000 52 92 94% 45 Toronto C13 28 $55,295,551 $1,974,841 $1,810,000 44 46 105% 17 Toronto C14 30 $75,752,715 $2,525,091 $1,991,000 55 83 100% 23 Toronto C15 26 $51,801,888 $1,992,380 $1,574,194 51 44 104% 18 Toronto East 355 $474,075,737 $1,335,425 $1,208,000 508 245 112% 11 Toronto E01 14 $22,277,250 $1,591,232 $1,397,500 20 10 111% 13 Toronto E02 28 $54,502,500 $1,946,518 $1,750,000 38 14 109% 9 Toronto E03 56 $75,539,398 $1,348,918 $1,202,500 107 63 109% 14 Toronto E04 33 $38,289,326 $1,160,283 $1,150,000 57 28 111% 11 Toronto E05 38 $50,948,852 $1,340,759 $1,334,444 48 16 121% 8 Toronto E06 24 $28,672,583 $1,194,691 $1,145,000 25 16 106% 15 Toronto E07 31 $41,455,276 $1,337,267 $1,310,000 36 17 116% 13 Toronto E08 39 $50,182,073 $1,286,720 $1,170,000 50 24 110% 10 Toronto E09 45 $52,362,789 $1,163,618 $1,128,000 58 21 119% 7 Toronto E10 35 $46,625,189 $1,332,148 $1,218,088 53 27 111% 10 Toronto E11 12 $13,220,501 $1,101,708 $1,023,001 16 9 102% 20 Municipality Number of Sales Dollar Volume Average Price Median Price New Listings Active Listings Avg. SP/LP Avg. LDOM DETACHED, SEPTEMBER 2021 Toronto Regional Real Estate Board SUMMARY OF EXISTING HOME TRANSACTIONS CITY OF TORONTO MUNICIPAL BREAKDOWN 1 1 2 4 5 1 1 3 8 Market Watch, September 2021 Copyright® 2021 Toronto Regional Real Estate Board
- 9. TRREB Total 824 $918,509,329 $1,114,696 $1,025,000 1,105 463 111% 9 Halton Region 53 $56,159,840 $1,059,620 $1,077,500 62 18 109% 7 Burlington 13 $12,181,358 $937,028 $875,000 12 4 104% 10 Halton Hills 3 $2,275,500 $758,500 $697,500 5 2 104% 4 Milton 24 $26,453,356 $1,102,223 $1,107,500 27 6 112% 7 Oakville 13 $15,249,626 $1,173,048 $1,152,000 18 6 111% 5 Peel Region 255 $250,521,891 $982,439 $970,000 296 98 108% 9 Brampton 150 $142,843,737 $952,292 $940,000 168 48 107% 9 Caledon 6 $5,499,200 $916,533 $898,600 6 2 103% 16 Mississauga 99 $102,178,954 $1,032,111 $1,000,000 122 48 110% 8 City of Toronto 325 $423,963,767 $1,304,504 $1,178,000 515 262 112% 10 Toronto West 83 $94,212,550 $1,135,091 $1,040,000 158 92 109% 12 Toronto Central 97 $156,719,581 $1,615,666 $1,500,900 158 101 108% 12 Toronto East 145 $173,031,636 $1,193,322 $1,120,000 199 69 118% 7 York Region 108 $123,952,427 $1,147,708 $1,164,000 130 49 113% 7 Aurora 4 $4,406,000 $1,101,500 $1,109,000 5 2 125% 6 East Gwillimbury 4 $3,935,888 $983,972 $982,944 3 1 104% 9 Georgina 0 $0 $0 - 1 1 - - King 1 $910,000 $910,000 $910,000 2 1 98% 19 Markham 41 $50,303,688 $1,226,919 $1,215,000 42 11 114% 7 Newmarket 13 $11,826,500 $909,731 $910,000 20 8 110% 6 Richmond Hill 12 $14,191,388 $1,182,616 $1,168,000 22 13 114% 9 Vaughan 31 $36,263,075 $1,169,777 $1,170,000 31 8 113% 8 Whitchurch-Stouffville 2 $2,115,888 $1,057,944 $1,057,944 4 4 128% 3 Durham Region 63 $49,080,004 $779,048 $755,000 74 23 119% 7 Ajax 8 $7,034,999 $879,375 $887,500 10 4 110% 14 Brock 0 $0 $0 - 0 0 - - Clarington 7 $4,900,700 $700,100 $701,500 7 2 124% 5 Oshawa 38 $27,498,003 $723,632 $717,500 44 13 122% 6 Pickering 8 $7,726,302 $965,788 $942,500 9 1 120% 5 Scugog 0 $0 $0 - 0 0 - - Uxbridge 0 $0 $0 - 0 0 - - Whitby 2 $1,920,000 $960,000 $960,000 4 3 114% 9 Dufferin County 11 $7,554,000 $686,727 $685,000 14 5 103% 8 Orangeville 11 $7,554,000 $686,727 $685,000 14 5 103% 8 Simcoe County 9 $7,277,400 $808,600 $878,000 14 8 100% 10 Adjala-Tosorontio 0 $0 $0 - 0 0 - - Bradford West Gwillimbury 3 $2,738,000 $912,667 $900,000 5 3 99% 16 Essa 2 $1,187,400 $593,700 $593,700 2 0 99% 8 Innisfil 0 $0 $0 - 0 0 - - New Tecumseth 4 $3,352,000 $838,000 $846,000 7 5 101% 7 Municipality Number of Sales Dollar Volume Average Price Median Price New Listings Active Listings Avg. SP/LP Avg. LDOM SEMI-DETACHED, SEPTEMBER 2021 Toronto Regional Real Estate Board SUMMARY OF EXISTING HOME TRANSACTIONS ALL TRREB AREAS 1 1 2 4 5 1 1 3 9 Market Watch, September 2021 Copyright® 2021 Toronto Regional Real Estate Board
- 10. TRREB Total 824 $918,509,329 $1,114,696 $1,025,000 1,105 463 111% 9 City of Toronto 325 $423,963,767 $1,304,504 $1,178,000 515 262 112% 10 Toronto West 83 $94,212,550 $1,135,091 $1,040,000 158 92 109% 12 Toronto W01 6 $8,729,700 $1,454,950 $1,390,500 16 10 111% 10 Toronto W02 16 $21,327,463 $1,332,966 $1,387,500 32 19 113% 8 Toronto W03 21 $22,747,499 $1,083,214 $1,040,000 41 25 111% 17 Toronto W04 0 $0 $0 - 1 2 - - Toronto W05 26 $25,220,888 $970,034 $967,500 48 27 106% 11 Toronto W06 7 $9,061,000 $1,294,429 $1,255,000 7 3 106% 18 Toronto W07 1 $1,075,000 $1,075,000 $1,075,000 1 1 108% 13 Toronto W08 4 $3,971,000 $992,750 $960,500 8 3 112% 6 Toronto W09 1 $1,150,000 $1,150,000 $1,150,000 2 1 115% 6 Toronto W10 1 $930,000 $930,000 $930,000 2 1 103% 5 Toronto Central 97 $156,719,581 $1,615,666 $1,500,900 158 101 108% 12 Toronto C01 24 $39,788,504 $1,657,854 $1,533,052 40 27 108% 12 Toronto C02 18 $42,481,400 $2,360,078 $2,201,500 33 25 105% 14 Toronto C03 12 $17,299,232 $1,441,603 $1,505,000 16 6 107% 14 Toronto C04 7 $11,829,000 $1,689,857 $1,627,000 10 3 120% 5 Toronto C06 1 $932,000 $932,000 $932,000 1 2 96% 24 Toronto C07 3 $3,138,000 $1,046,000 $1,060,000 8 6 112% 10 Toronto C08 0 $0 $0 - 6 10 - - Toronto C09 2 $4,550,000 $2,275,000 $2,275,000 7 7 101% 16 Toronto C10 10 $13,942,435 $1,394,244 $1,412,500 11 3 110% 8 Toronto C11 1 $1,250,000 $1,250,000 $1,250,000 4 4 105% 7 Toronto C12 0 $0 $0 - 0 0 - - Toronto C13 6 $6,481,011 $1,080,169 $1,017,505 10 5 106% 19 Toronto C14 0 $0 $0 - 0 0 - - Toronto C15 13 $15,027,999 $1,156,000 $1,105,000 12 3 116% 6 Toronto East 145 $173,031,636 $1,193,322 $1,120,000 199 69 118% 7 Toronto E01 45 $63,739,739 $1,416,439 $1,400,000 63 27 124% 7 Toronto E02 25 $32,375,577 $1,295,023 $1,241,016 37 12 119% 5 Toronto E03 19 $22,698,000 $1,194,632 $1,120,000 38 17 112% 11 Toronto E04 9 $7,936,000 $881,778 $870,000 12 6 114% 6 Toronto E05 10 $10,091,388 $1,009,139 $1,035,000 10 2 119% 7 Toronto E06 8 $7,525,133 $940,642 $857,500 13 2 105% 8 Toronto E07 10 $9,953,800 $995,380 $990,500 10 0 120% 9 Toronto E08 0 $0 $0 - 0 0 - - Toronto E09 1 $890,000 $890,000 $890,000 0 0 119% 9 Toronto E10 6 $5,935,999 $989,333 $985,000 5 0 111% 8 Toronto E11 12 $11,886,000 $990,500 $927,500 11 3 112% 6 Municipality Number of Sales Dollar Volume Average Price Median Price New Listings Active Listings Avg. SP/LP Avg. LDOM SEMI-DETACHED, SEPTEMBER 2021 Toronto Regional Real Estate Board SUMMARY OF EXISTING HOME TRANSACTIONS CITY OF TORONTO MUNICIPAL BREAKDOWN 1 1 2 4 5 1 1 3 10 Market Watch, September 2021 Copyright® 2021 Toronto Regional Real Estate Board
- 11. TRREB Total 821 $834,356,496 $1,016,269 $953,000 1,017 429 110% 10 Halton Region 129 $133,548,522 $1,035,260 $975,000 157 53 108% 9 Burlington 20 $18,970,900 $948,545 $948,950 27 7 110% 10 Halton Hills 9 $8,293,199 $921,467 $900,200 10 2 113% 3 Milton 53 $50,104,693 $945,372 $950,000 65 21 110% 7 Oakville 47 $56,179,730 $1,195,313 $1,125,000 55 23 105% 12 Peel Region 179 $163,964,107 $916,001 $900,000 177 44 108% 9 Brampton 132 $117,685,032 $891,553 $889,950 127 32 107% 9 Caledon 17 $15,313,699 $900,806 $935,700 18 3 106% 8 Mississauga 30 $30,965,376 $1,032,179 $997,450 32 9 109% 8 City of Toronto 109 $125,186,563 $1,148,501 $1,090,000 186 142 107% 13 Toronto West 33 $36,555,763 $1,107,750 $1,125,000 54 40 105% 13 Toronto Central 33 $45,955,000 $1,392,576 $1,420,000 77 78 104% 16 Toronto East 43 $42,675,800 $992,460 $925,000 55 24 112% 10 York Region 237 $272,481,664 $1,149,712 $1,130,000 313 128 112% 11 Aurora 8 $8,129,000 $1,016,125 $1,007,500 12 3 113% 12 East Gwillimbury 11 $10,333,400 $939,400 $950,000 13 4 112% 6 Georgina 4 $2,995,000 $748,750 $737,500 9 4 111% 4 King 3 $4,123,000 $1,374,333 $1,385,000 2 0 110% 10 Markham 67 $82,715,041 $1,234,553 $1,250,000 79 37 114% 14 Newmarket 17 $16,084,688 $946,158 $952,000 19 9 117% 6 Richmond Hill 53 $64,968,088 $1,225,813 $1,200,000 81 28 112% 8 Vaughan 65 $74,695,947 $1,149,168 $1,130,000 88 39 110% 12 Whitchurch-Stouffville 9 $8,437,500 $937,500 $945,000 10 4 113% 19 Durham Region 130 $108,388,640 $833,759 $825,000 142 48 116% 7 Ajax 25 $22,259,100 $890,364 $900,000 27 8 111% 5 Brock 0 $0 $0 - 0 0 - - Clarington 25 $19,565,301 $782,612 $785,000 31 12 122% 9 Oshawa 26 $20,369,762 $783,452 $780,000 28 12 115% 8 Pickering 12 $9,656,500 $804,708 $785,000 12 4 105% 9 Scugog 0 $0 $0 - 0 5 - - Uxbridge 0 $0 $0 - 0 0 - - Whitby 42 $36,537,977 $869,952 $870,000 44 7 120% 6 Dufferin County 7 $5,275,000 $753,571 $750,000 9 5 103% 11 Orangeville 7 $5,275,000 $753,571 $750,000 9 5 103% 11 Simcoe County 30 $25,512,000 $850,400 $698,000 33 9 103% 11 Adjala-Tosorontio 0 $0 $0 - 0 0 - - Bradford West Gwillimbury 3 $2,829,000 $943,000 $950,000 5 2 109% 4 Essa 5 $3,303,500 $660,700 $662,000 7 2 102% 9 Innisfil 11 $11,964,000 $1,087,636 $810,000 11 3 102% 14 New Tecumseth 11 $7,415,500 $674,136 $665,000 10 2 102% 11 Municipality Number of Sales Dollar Volume Average Price Median Price New Listings Active Listings Avg. SP/LP Avg. LDOM ATT/ROW/TWNHOUSE, SEPTEMBER 2021 Toronto Regional Real Estate Board SUMMARY OF EXISTING HOME TRANSACTIONS ALL TRREB AREAS 1 1 2 4 5 1 1 3 11 Market Watch, September 2021 Copyright® 2021 Toronto Regional Real Estate Board
- 12. TRREB Total 821 $834,356,496 $1,016,269 $953,000 1,017 429 110% 10 City of Toronto 109 $125,186,563 $1,148,501 $1,090,000 186 142 107% 13 Toronto West 33 $36,555,763 $1,107,750 $1,125,000 54 40 105% 13 Toronto W01 0 $0 $0 - 2 2 - - Toronto W02 4 $3,910,300 $977,575 $982,500 10 8 109% 6 Toronto W03 1 $1,130,000 $1,130,000 $1,130,000 3 3 113% 10 Toronto W04 2 $1,710,000 $855,000 $855,000 1 4 96% 32 Toronto W05 7 $7,025,000 $1,003,571 $950,000 9 12 100% 25 Toronto W06 13 $15,458,488 $1,189,114 $1,260,400 15 3 108% 9 Toronto W07 1 $1,420,000 $1,420,000 $1,420,000 1 1 98% 5 Toronto W08 3 $3,811,975 $1,270,658 $1,230,000 9 4 106% 4 Toronto W09 2 $2,090,000 $1,045,000 $1,045,000 1 0 102% 16 Toronto W10 0 $0 $0 - 3 3 - - Toronto Central 33 $45,955,000 $1,392,576 $1,420,000 77 78 104% 16 Toronto C01 10 $14,472,500 $1,447,250 $1,396,750 33 35 105% 10 Toronto C02 3 $4,030,000 $1,343,333 $1,440,000 7 8 101% 41 Toronto C03 0 $0 $0 - 2 2 - - Toronto C04 0 $0 $0 - 4 7 - - Toronto C06 0 $0 $0 - 0 0 - - Toronto C07 5 $6,003,000 $1,200,600 $1,200,000 4 1 107% 14 Toronto C08 8 $11,309,500 $1,413,688 $1,348,000 15 10 100% 22 Toronto C09 1 $1,480,000 $1,480,000 $1,480,000 1 1 100% 2 Toronto C10 0 $0 $0 - 1 1 - - Toronto C11 0 $0 $0 - 0 0 - - Toronto C12 0 $0 $0 - 1 3 - - Toronto C13 3 $4,040,000 $1,346,667 $1,420,000 3 1 118% 8 Toronto C14 3 $4,620,000 $1,540,000 $1,550,000 6 9 103% 15 Toronto C15 0 $0 $0 - 0 0 - - Toronto East 43 $42,675,800 $992,460 $925,000 55 24 112% 10 Toronto E01 5 $7,069,000 $1,413,800 $1,340,000 12 10 124% 7 Toronto E02 2 $3,022,000 $1,511,000 $1,511,000 3 1 116% 6 Toronto E03 2 $2,320,000 $1,160,000 $1,160,000 3 1 119% 2 Toronto E04 10 $8,993,000 $899,300 $921,500 8 3 107% 12 Toronto E05 2 $1,956,800 $978,400 $978,400 6 4 112% 6 Toronto E06 0 $0 $0 - 0 0 - - Toronto E07 3 $2,755,000 $918,333 $905,000 3 0 117% 11 Toronto E08 4 $3,478,000 $869,500 $850,000 4 0 99% 14 Toronto E09 0 $0 $0 - 0 0 - - Toronto E10 5 $4,675,000 $935,000 $960,000 6 2 105% 14 Toronto E11 10 $8,407,000 $840,700 $813,000 10 3 114% 9 Municipality Number of Sales Dollar Volume Average Price Median Price New Listings Active Listings Avg. SP/LP Avg. LDOM ATT/ROW/TWNHOUSE, SEPTEMBER 2021 Toronto Regional Real Estate Board SUMMARY OF EXISTING HOME TRANSACTIONS CITY OF TORONTO MUNICIPAL BREAKDOWN 1 1 2 4 5 1 1 3 12 Market Watch, September 2021 Copyright® 2021 Toronto Regional Real Estate Board
- 13. TRREB Total 737 $582,217,260 $789,983 $750,000 996 594 107% 13 Halton Region 78 $63,293,335 $811,453 $761,000 92 38 105% 9 Burlington 41 $32,524,447 $793,279 $762,000 43 14 107% 9 Halton Hills 3 $1,932,000 $644,000 $640,000 6 3 110% 5 Milton 6 $4,374,000 $729,000 $735,000 7 2 108% 10 Oakville 28 $24,462,888 $873,675 $822,500 36 19 103% 10 Peel Region 231 $174,772,330 $756,590 $750,000 244 114 106% 12 Brampton 82 $57,042,498 $695,640 $685,000 73 27 105% 13 Caledon 0 $0 $0 - 0 0 - - Mississauga 149 $117,729,832 $790,133 $788,000 171 87 106% 11 City of Toronto 256 $214,283,970 $837,047 $761,250 447 342 106% 15 Toronto West 78 $57,733,399 $740,172 $712,000 144 123 105% 14 Toronto Central 83 $84,376,515 $1,016,585 $840,000 176 140 105% 14 Toronto East 95 $72,174,056 $759,727 $735,000 127 79 109% 16 York Region 93 $78,116,576 $839,963 $785,000 113 60 106% 15 Aurora 15 $11,862,280 $790,819 $779,000 19 7 104% 17 East Gwillimbury 0 $0 $0 - 0 0 - - Georgina 3 $2,099,700 $699,900 $699,900 0 0 100% 27 King 0 $0 $0 - 0 0 - - Markham 41 $35,890,088 $875,368 $860,000 43 16 107% 14 Newmarket 6 $4,606,000 $767,667 $763,000 7 5 106% 13 Richmond Hill 13 $12,138,500 $933,731 $885,000 15 14 105% 22 Vaughan 14 $10,750,008 $767,858 $738,750 23 14 107% 11 Whitchurch-Stouffville 1 $770,000 $770,000 $770,000 6 4 101% 6 Durham Region 75 $49,438,549 $659,181 $650,000 96 38 112% 10 Ajax 9 $6,510,500 $723,389 $775,000 10 2 110% 8 Brock 0 $0 $0 - 1 1 - - Clarington 4 $2,570,000 $642,500 $597,500 5 2 118% 7 Oshawa 33 $19,935,249 $604,098 $605,500 44 16 116% 10 Pickering 20 $14,304,000 $715,200 $702,500 26 12 110% 11 Scugog 0 $0 $0 - 1 1 - - Uxbridge 2 $1,186,800 $593,400 $593,400 2 1 102% 25 Whitby 7 $4,932,000 $704,571 $650,000 7 3 110% 7 Dufferin County 2 $1,092,500 $546,250 $546,250 1 0 104% 7 Orangeville 2 $1,092,500 $546,250 $546,250 1 0 104% 7 Simcoe County 2 $1,220,000 $610,000 $610,000 3 2 108% 10 Adjala-Tosorontio 0 $0 $0 - 0 0 - - Bradford West Gwillimbury 0 $0 $0 - 0 0 - - Essa 0 $0 $0 - 0 0 - - Innisfil 0 $0 $0 - 0 1 - - New Tecumseth 2 $1,220,000 $610,000 $610,000 3 1 108% 10 Municipality Number of Sales Dollar Volume Average Price Median Price New Listings Active Listings Avg. SP/LP Avg. LDOM CONDO TOWNHOUSE, SEPTEMBER 2021 Toronto Regional Real Estate Board SUMMARY OF EXISTING HOME TRANSACTIONS ALL TRREB AREAS 1 1 2 4 5 1 1 3 13 Market Watch, September 2021 Copyright® 2021 Toronto Regional Real Estate Board
- 14. TRREB Total 737 $582,217,260 $789,983 $750,000 996 594 107% 13 City of Toronto 256 $214,283,970 $837,047 $761,250 447 342 106% 15 Toronto West 78 $57,733,399 $740,172 $712,000 144 123 105% 14 Toronto W01 2 $1,950,000 $975,000 $975,000 3 1 111% 7 Toronto W02 7 $6,361,500 $908,786 $905,000 11 6 112% 8 Toronto W03 2 $1,493,199 $746,600 $746,600 3 3 111% 7 Toronto W04 11 $7,984,275 $725,843 $710,000 29 26 105% 16 Toronto W05 28 $17,109,325 $611,047 $620,000 30 24 101% 18 Toronto W06 11 $10,155,200 $923,200 $925,000 29 26 104% 11 Toronto W07 0 $0 $0 - 0 0 - - Toronto W08 5 $4,300,000 $860,000 $869,000 19 20 107% 10 Toronto W09 2 $1,470,000 $735,000 $735,000 6 5 104% 9 Toronto W10 10 $6,909,900 $690,990 $703,950 14 12 106% 16 Toronto Central 83 $84,376,515 $1,016,585 $840,000 176 140 105% 14 Toronto C01 22 $24,346,800 $1,106,673 $912,500 43 32 108% 8 Toronto C02 4 $5,938,000 $1,484,500 $1,291,500 10 12 104% 30 Toronto C03 3 $6,600,000 $2,200,000 $1,850,000 3 2 96% 17 Toronto C04 1 $1,560,000 $1,560,000 $1,560,000 1 0 130% 3 Toronto C06 0 $0 $0 - 3 3 - - Toronto C07 9 $7,161,800 $795,756 $745,000 14 15 100% 30 Toronto C08 4 $2,668,000 $667,000 $640,000 19 16 101% 7 Toronto C09 2 $2,675,000 $1,337,500 $1,337,500 4 4 98% 13 Toronto C10 0 $0 $0 - 4 3 - - Toronto C11 2 $1,225,000 $612,500 $612,500 5 4 108% 12 Toronto C12 1 $829,000 $829,000 $829,000 7 3 119% 1 Toronto C13 0 $0 $0 - 3 4 - - Toronto C14 9 $10,300,777 $1,144,531 $1,180,000 19 12 107% 12 Toronto C15 26 $21,072,138 $810,467 $774,000 41 30 106% 15 Toronto East 95 $72,174,056 $759,727 $735,000 127 79 109% 16 Toronto E01 6 $5,535,000 $922,500 $890,000 13 6 115% 3 Toronto E02 5 $5,178,000 $1,035,600 $1,050,000 9 5 103% 10 Toronto E03 1 $906,000 $906,000 $906,000 1 1 117% 3 Toronto E04 7 $5,117,166 $731,024 $665,000 9 6 107% 26 Toronto E05 21 $16,248,900 $773,757 $777,000 26 10 113% 10 Toronto E06 1 $900,000 $900,000 $900,000 3 3 129% 2 Toronto E07 8 $6,518,665 $814,833 $776,000 12 9 109% 16 Toronto E08 6 $4,523,000 $753,833 $755,000 16 14 106% 23 Toronto E09 10 $6,940,888 $694,089 $695,000 9 5 104% 30 Toronto E10 10 $6,416,549 $641,655 $685,000 11 6 113% 10 Toronto E11 20 $13,889,888 $694,494 $695,000 18 14 107% 20 Municipality Number of Sales Dollar Volume Average Price Median Price New Listings Active Listings Avg. SP/LP Avg. LDOM CONDO TOWNHOUSE, SEPTEMBER 2021 Toronto Regional Real Estate Board SUMMARY OF EXISTING HOME TRANSACTIONS CITY OF TORONTO MUNICIPAL BREAKDOWN 1 1 2 4 5 1 1 3 14 Market Watch, September 2021 Copyright® 2021 Toronto Regional Real Estate Board
- 15. TRREB Total 2,664 $1,887,500,739 $708,521 $630,000 4,420 3,882 102% 19 Halton Region 145 $108,321,400 $747,044 $625,000 175 103 101% 15 Burlington 72 $54,953,499 $763,243 $620,000 72 33 100% 14 Halton Hills 1 $540,000 $540,000 $540,000 3 2 100% 5 Milton 17 $10,400,501 $611,794 $612,501 22 12 102% 15 Oakville 55 $42,427,400 $771,407 $685,000 78 56 101% 17 Peel Region 340 $197,262,711 $580,184 $557,500 473 406 101% 20 Brampton 55 $29,175,488 $530,463 $520,000 76 67 100% 20 Caledon 0 $0 $0 - 0 1 - - Mississauga 285 $168,087,223 $589,780 $562,786 397 338 101% 20 City of Toronto 1,792 $1,334,556,214 $744,730 $650,000 3,229 2,918 102% 19 Toronto West 333 $221,631,783 $665,561 $609,000 539 505 101% 20 Toronto Central 1,176 $948,140,576 $806,242 $700,000 2,282 2,121 102% 19 Toronto East 283 $164,783,855 $582,275 $554,000 408 292 103% 18 York Region 315 $207,564,716 $658,936 $636,000 437 375 102% 22 Aurora 10 $6,730,000 $673,000 $604,500 8 6 99% 14 East Gwillimbury 0 $0 $0 - 0 0 - - Georgina 7 $3,950,400 $564,343 $579,900 10 10 100% 93 King 3 $1,863,000 $621,000 $525,000 3 3 102% 12 Markham 97 $64,524,438 $665,200 $630,000 130 97 105% 19 Newmarket 4 $2,240,500 $560,125 $540,250 7 5 101% 10 Richmond Hill 73 $46,345,600 $634,871 $625,000 105 81 101% 17 Vaughan 108 $73,182,178 $677,613 $652,000 168 167 100% 22 Whitchurch-Stouffville 13 $8,728,600 $671,431 $690,000 6 6 100% 32 Durham Region 58 $31,593,098 $544,709 $532,750 88 68 105% 12 Ajax 12 $6,958,418 $579,868 $560,000 14 4 107% 6 Brock 0 $0 $0 - 0 0 - - Clarington 13 $7,316,680 $562,822 $540,000 13 9 106% 17 Oshawa 10 $3,796,900 $379,690 $427,500 18 23 103% 15 Pickering 17 $9,990,400 $587,671 $580,000 24 20 102% 13 Scugog 0 $0 $0 - 0 0 - - Uxbridge 1 $515,000 $515,000 $515,000 1 1 98% 25 Whitby 5 $3,015,700 $603,140 $620,000 18 11 110% 4 Dufferin County 6 $3,163,600 $527,267 $450,000 8 2 103% 9 Orangeville 6 $3,163,600 $527,267 $450,000 8 2 103% 9 Simcoe County 8 $5,039,000 $629,875 $632,500 10 10 101% 36 Adjala-Tosorontio 0 $0 $0 - 0 0 - - Bradford West Gwillimbury 0 $0 $0 - 0 0 - - Essa 0 $0 $0 - 0 0 - - Innisfil 5 $3,389,000 $677,800 $649,000 6 5 101% 36 New Tecumseth 3 $1,650,000 $550,000 $575,000 4 5 99% 36 Municipality Number of Sales Dollar Volume Average Price Median Price New Listings Active Listings Avg. SP/LP Avg. LDOM CONDO APT, SEPTEMBER 2021 Toronto Regional Real Estate Board SUMMARY OF EXISTING HOME TRANSACTIONS ALL TRREB AREAS 1 1 2 4 5 1 1 3 15 Market Watch, September 2021 Copyright® 2021 Toronto Regional Real Estate Board
- 16. TRREB Total 2,664 $1,887,500,739 $708,521 $630,000 4,420 3,882 102% 19 City of Toronto 1,792 $1,334,556,214 $744,730 $650,000 3,229 2,918 102% 19 Toronto West 333 $221,631,783 $665,561 $609,000 539 505 101% 20 Toronto W01 29 $24,269,500 $836,879 $722,000 47 28 101% 18 Toronto W02 18 $13,741,542 $763,419 $752,500 29 21 104% 15 Toronto W03 7 $4,066,000 $580,857 $489,000 8 9 100% 21 Toronto W04 26 $14,158,500 $544,558 $528,500 52 51 101% 23 Toronto W05 37 $18,880,600 $510,286 $520,000 49 49 101% 18 Toronto W06 78 $62,359,838 $799,485 $706,500 144 154 101% 20 Toronto W07 6 $5,157,292 $859,549 $663,500 4 4 103% 14 Toronto W08 87 $56,228,899 $646,309 $610,000 132 109 100% 19 Toronto W09 18 $8,558,500 $475,472 $447,500 23 30 98% 41 Toronto W10 27 $14,211,112 $526,337 $525,000 51 50 102% 15 Toronto Central 1,176 $948,140,576 $806,242 $700,000 2,282 2,121 102% 19 Toronto C01 468 $387,103,098 $827,143 $720,000 824 692 102% 18 Toronto C02 69 $87,684,380 $1,270,788 $999,000 139 157 98% 25 Toronto C03 19 $16,014,000 $842,842 $774,000 40 48 98% 40 Toronto C04 17 $16,233,500 $954,912 $779,000 42 39 104% 13 Toronto C06 19 $12,241,900 $644,311 $622,500 39 38 103% 18 Toronto C07 50 $35,517,550 $710,351 $685,000 110 113 103% 21 Toronto C08 185 $142,496,280 $770,250 $700,000 454 437 102% 15 Toronto C09 9 $11,050,800 $1,227,867 $850,000 28 34 99% 111 Toronto C10 62 $48,817,867 $787,385 $712,500 110 118 103% 16 Toronto C11 27 $16,687,400 $618,052 $565,500 50 48 102% 19 Toronto C12 5 $9,776,000 $1,955,200 $2,195,000 17 16 103% 16 Toronto C13 34 $23,847,399 $701,394 $600,000 62 54 100% 17 Toronto C14 113 $76,646,364 $678,286 $655,000 182 141 104% 16 Toronto C15 99 $64,024,038 $646,707 $620,800 185 186 103% 17 Toronto East 283 $164,783,855 $582,275 $554,000 408 292 103% 18 Toronto E01 12 $10,324,000 $860,333 $761,750 33 30 104% 13 Toronto E02 16 $11,801,490 $737,593 $732,500 36 23 101% 20 Toronto E03 20 $12,187,802 $609,390 $525,000 23 27 99% 27 Toronto E04 38 $19,969,100 $525,503 $509,000 48 22 102% 17 Toronto E05 40 $22,995,488 $574,887 $580,000 56 42 104% 19 Toronto E06 8 $6,565,000 $820,625 $705,000 17 14 98% 21 Toronto E07 42 $23,778,726 $566,160 $558,500 57 43 104% 18 Toronto E08 27 $14,421,000 $534,111 $528,000 28 18 102% 20 Toronto E09 54 $29,817,080 $552,168 $545,000 75 48 104% 12 Toronto E10 4 $2,091,190 $522,798 $527,600 5 7 104% 28 Toronto E11 22 $10,832,979 $492,408 $500,000 30 18 100% 18 Municipality Number of Sales Dollar Volume Average Price Median Price New Listings Active Listings Avg. SP/LP Avg. LDOM CONDO APT, SEPTEMBER 2021 Toronto Regional Real Estate Board SUMMARY OF EXISTING HOME TRANSACTIONS CITY OF TORONTO MUNICIPAL BREAKDOWN 1 1 2 4 5 1 1 3 16 Market Watch, September 2021 Copyright® 2021 Toronto Regional Real Estate Board
- 17. TRREB Total 68 $74,275,242 $1,092,283 $1,075,000 91 31 114% 7 Halton Region 6 $6,362,600 $1,060,433 $1,020,000 5 1 108% 6 Burlington 3 $2,886,000 $962,000 $971,000 2 0 103% 7 Halton Hills 0 $0 $0 - 0 0 - - Milton 0 $0 $0 - 1 1 - - Oakville 3 $3,476,600 $1,158,867 $1,131,000 2 0 113% 6 Peel Region 4 $3,938,600 $984,650 $940,250 6 4 110% 11 Brampton 1 $890,100 $890,100 $890,100 3 3 111% 15 Caledon 1 $952,500 $952,500 $952,500 1 0 112% 6 Mississauga 2 $2,096,000 $1,048,000 $1,048,000 2 1 108% 11 City of Toronto 8 $7,752,501 $969,063 $913,751 8 3 112% 11 Toronto West 1 $940,000 $940,000 $940,000 0 0 111% 3 Toronto Central 1 $1,080,000 $1,080,000 $1,080,000 4 2 120% 15 Toronto East 6 $5,732,501 $955,417 $886,251 4 1 110% 12 York Region 32 $41,007,041 $1,281,470 $1,278,500 44 13 116% 7 Aurora 0 $0 $0 - 0 0 - - East Gwillimbury 0 $0 $0 - 0 0 - - Georgina 0 $0 $0 - 0 0 - - King 0 $0 $0 - 1 1 - - Markham 18 $23,515,361 $1,306,409 $1,319,844 28 8 120% 6 Newmarket 0 $0 $0 - 0 0 - - Richmond Hill 6 $7,589,880 $1,264,980 $1,243,440 8 4 108% 11 Vaughan 6 $7,576,800 $1,262,800 $1,316,000 6 0 112% 6 Whitchurch-Stouffville 2 $2,325,000 $1,162,500 $1,162,500 1 0 117% 8 Durham Region 12 $10,332,000 $861,000 $840,500 17 5 120% 6 Ajax 1 $765,000 $765,000 $765,000 1 0 109% 3 Brock 0 $0 $0 - 0 0 - - Clarington 7 $5,811,000 $830,143 $825,000 9 2 120% 7 Oshawa 1 $875,000 $875,000 $875,000 3 2 146% 7 Pickering 0 $0 $0 - 0 0 - - Scugog 0 $0 $0 - 0 0 - - Uxbridge 1 $851,000 $851,000 $851,000 1 0 117% 2 Whitby 2 $2,030,000 $1,015,000 $1,015,000 3 1 119% 6 Dufferin County 1 $907,500 $907,500 $907,500 2 1 121% 4 Orangeville 1 $907,500 $907,500 $907,500 2 1 121% 4 Simcoe County 5 $3,975,000 $795,000 $795,000 9 4 104% 8 Adjala-Tosorontio 0 $0 $0 - 0 0 - - Bradford West Gwillimbury 1 $881,000 $881,000 $881,000 1 0 110% 7 Essa 4 $3,094,000 $773,500 $775,000 5 1 102% 9 Innisfil 0 $0 $0 - 0 0 - - New Tecumseth 0 $0 $0 - 3 3 - - Municipality Number of Sales Dollar Volume Average Price Median Price New Listings Active Listings Avg. SP/LP Avg. LDOM LINK, SEPTEMBER 2021 Toronto Regional Real Estate Board SUMMARY OF EXISTING HOME TRANSACTIONS ALL TRREB AREAS 1 1 2 4 5 1 1 3 17 Market Watch, September 2021 Copyright® 2021 Toronto Regional Real Estate Board
- 18. TRREB Total 68 $74,275,242 $1,092,283 $1,075,000 91 31 114% 7 City of Toronto 8 $7,752,501 $969,063 $913,751 8 3 112% 11 Toronto West 1 $940,000 $940,000 $940,000 0 0 111% 3 Toronto W01 0 $0 $0 - 0 0 - - Toronto W02 0 $0 $0 - 0 0 - - Toronto W03 0 $0 $0 - 0 0 - - Toronto W04 0 $0 $0 - 0 0 - - Toronto W05 1 $940,000 $940,000 $940,000 0 0 111% 3 Toronto W06 0 $0 $0 - 0 0 - - Toronto W07 0 $0 $0 - 0 0 - - Toronto W08 0 $0 $0 - 0 0 - - Toronto W09 0 $0 $0 - 0 0 - - Toronto W10 0 $0 $0 - 0 0 - - Toronto Central 1 $1,080,000 $1,080,000 $1,080,000 4 2 120% 15 Toronto C01 0 $0 $0 - 1 1 - - Toronto C02 0 $0 $0 - 0 0 - - Toronto C03 0 $0 $0 - 0 0 - - Toronto C04 0 $0 $0 - 0 0 - - Toronto C06 0 $0 $0 - 0 0 - - Toronto C07 1 $1,080,000 $1,080,000 $1,080,000 1 0 120% 15 Toronto C08 0 $0 $0 - 0 0 - - Toronto C09 0 $0 $0 - 0 0 - - Toronto C10 0 $0 $0 - 0 0 - - Toronto C11 0 $0 $0 - 0 0 - - Toronto C12 0 $0 $0 - 0 0 - - Toronto C13 0 $0 $0 - 0 0 - - Toronto C14 0 $0 $0 - 0 0 - - Toronto C15 0 $0 $0 - 2 1 - - Toronto East 6 $5,732,501 $955,417 $886,251 4 1 110% 12 Toronto E01 0 $0 $0 - 0 0 - - Toronto E02 0 $0 $0 - 0 0 - - Toronto E03 0 $0 $0 - 0 0 - - Toronto E04 0 $0 $0 - 0 0 - - Toronto E05 1 $1,070,000 $1,070,000 $1,070,000 2 1 134% 3 Toronto E06 0 $0 $0 - 0 0 - - Toronto E07 2 $2,015,000 $1,007,500 $1,007,500 2 0 112% 4 Toronto E08 0 $0 $0 - 0 0 - - Toronto E09 0 $0 $0 - 0 0 - - Toronto E10 0 $0 $0 - 0 0 - - Toronto E11 3 $2,647,501 $882,500 $885,000 0 0 102% 19 Municipality Number of Sales Dollar Volume Average Price Median Price New Listings Active Listings Avg. SP/LP Avg. LDOM LINK, SEPTEMBER 2021 Toronto Regional Real Estate Board SUMMARY OF EXISTING HOME TRANSACTIONS CITY OF TORONTO MUNICIPAL BREAKDOWN 1 1 2 4 5 1 1 3 18 Market Watch, September 2021 Copyright® 2021 Toronto Regional Real Estate Board
- 19. TRREB Total 8 $3,359,000 $419,875 $412,000 16 16 100% 26 Halton Region 0 $0 $0 - 0 0 - - Burlington 0 $0 $0 - 0 0 - - Halton Hills 0 $0 $0 - 0 0 - - Milton 0 $0 $0 - 0 0 - - Oakville 0 $0 $0 - 0 0 - - Peel Region 0 $0 $0 - 0 0 - - Brampton 0 $0 $0 - 0 0 - - Caledon 0 $0 $0 - 0 0 - - Mississauga 0 $0 $0 - 0 0 - - City of Toronto 7 $2,709,000 $387,000 $399,000 15 16 98% 29 Toronto West 3 $1,145,000 $381,667 $425,000 3 4 96% 30 Toronto Central 2 $1,069,000 $534,500 $534,500 10 10 102% 12 Toronto East 2 $495,000 $247,500 $247,500 2 2 94% 44 York Region 1 $650,000 $650,000 $650,000 1 0 109% 10 Aurora 0 $0 $0 - 0 0 - - East Gwillimbury 0 $0 $0 - 0 0 - - Georgina 0 $0 $0 - 0 0 - - King 0 $0 $0 - 0 0 - - Markham 0 $0 $0 - 0 0 - - Newmarket 0 $0 $0 - 0 0 - - Richmond Hill 1 $650,000 $650,000 $650,000 1 0 109% 10 Vaughan 0 $0 $0 - 0 0 - - Whitchurch-Stouffville 0 $0 $0 - 0 0 - - Durham Region 0 $0 $0 - 0 0 - - Ajax 0 $0 $0 - 0 0 - - Brock 0 $0 $0 - 0 0 - - Clarington 0 $0 $0 - 0 0 - - Oshawa 0 $0 $0 - 0 0 - - Pickering 0 $0 $0 - 0 0 - - Scugog 0 $0 $0 - 0 0 - - Uxbridge 0 $0 $0 - 0 0 - - Whitby 0 $0 $0 - 0 0 - - Dufferin County 0 $0 $0 - 0 0 - - Orangeville 0 $0 $0 - 0 0 - - Simcoe County 0 $0 $0 - 0 0 - - Adjala-Tosorontio 0 $0 $0 - 0 0 - - Bradford West Gwillimbury 0 $0 $0 - 0 0 - - Essa 0 $0 $0 - 0 0 - - Innisfil 0 $0 $0 - 0 0 - - New Tecumseth 0 $0 $0 - 0 0 - - Municipality Number of Sales Dollar Volume Average Price Median Price New Listings Active Listings Avg. SP/LP Avg. LDOM CO-OP APT, SEPTEMBER 2021 Toronto Regional Real Estate Board SUMMARY OF EXISTING HOME TRANSACTIONS ALL TRREB AREAS 1 1 2 4 5 1 1 3 19 Market Watch, September 2021 Copyright® 2021 Toronto Regional Real Estate Board
- 20. TRREB Total 8 $3,359,000 $419,875 $412,000 16 16 100% 26 City of Toronto 7 $2,709,000 $387,000 $399,000 15 16 98% 29 Toronto West 3 $1,145,000 $381,667 $425,000 3 4 96% 30 Toronto W01 0 $0 $0 - 0 0 - - Toronto W02 0 $0 $0 - 0 0 - - Toronto W03 0 $0 $0 - 0 0 - - Toronto W04 0 $0 $0 - 0 0 - - Toronto W05 0 $0 $0 - 0 0 - - Toronto W06 1 $290,000 $290,000 $290,000 3 4 97% 25 Toronto W07 0 $0 $0 - 0 0 - - Toronto W08 2 $855,000 $427,500 $427,500 0 0 96% 32 Toronto W09 0 $0 $0 - 0 0 - - Toronto W10 0 $0 $0 - 0 0 - - Toronto Central 2 $1,069,000 $534,500 $534,500 10 10 102% 12 Toronto C01 0 $0 $0 - 0 0 - - Toronto C02 0 $0 $0 - 1 2 - - Toronto C03 0 $0 $0 - 1 1 - - Toronto C04 0 $0 $0 - 0 0 - - Toronto C06 0 $0 $0 - 0 0 - - Toronto C07 0 $0 $0 - 1 1 - - Toronto C08 0 $0 $0 - 0 0 - - Toronto C09 1 $399,000 $399,000 $399,000 5 5 100% 22 Toronto C10 1 $670,000 $670,000 $670,000 1 0 103% 2 Toronto C11 0 $0 $0 - 0 0 - - Toronto C12 0 $0 $0 - 0 0 - - Toronto C13 0 $0 $0 - 0 0 - - Toronto C14 0 $0 $0 - 0 0 - - Toronto C15 0 $0 $0 - 1 1 - - Toronto East 2 $495,000 $247,500 $247,500 2 2 94% 44 Toronto E01 0 $0 $0 - 0 0 - - Toronto E02 0 $0 $0 - 1 1 - - Toronto E03 0 $0 $0 - 0 0 - - Toronto E04 1 $340,000 $340,000 $340,000 1 1 92% 68 Toronto E05 0 $0 $0 - 0 0 - - Toronto E06 0 $0 $0 - 0 0 - - Toronto E07 0 $0 $0 - 0 0 - - Toronto E08 0 $0 $0 - 0 0 - - Toronto E09 0 $0 $0 - 0 0 - - Toronto E10 1 $155,000 $155,000 $155,000 0 0 97% 19 Toronto E11 0 $0 $0 - 0 0 - - Municipality Number of Sales Dollar Volume Average Price Median Price New Listings Active Listings Avg. SP/LP Avg. LDOM CO-OP APT, SEPTEMBER 2021 Toronto Regional Real Estate Board SUMMARY OF EXISTING HOME TRANSACTIONS CITY OF TORONTO MUNICIPAL BREAKDOWN 1 1 2 4 5 1 1 3 20 Market Watch, September 2021 Copyright® 2021 Toronto Regional Real Estate Board
- 21. TRREB Total 11 $10,342,000 $940,182 $835,000 12 10 109% 13 Halton Region 1 $1,089,000 $1,089,000 $1,089,000 1 0 100% 3 Burlington 1 $1,089,000 $1,089,000 $1,089,000 1 0 100% 3 Halton Hills 0 $0 $0 - 0 0 - - Milton 0 $0 $0 - 0 0 - - Oakville 0 $0 $0 - 0 0 - - Peel Region 2 $2,118,000 $1,059,000 $1,059,000 4 3 103% 18 Brampton 2 $2,118,000 $1,059,000 $1,059,000 4 3 103% 18 Caledon 0 $0 $0 - 0 0 - - Mississauga 0 $0 $0 - 0 0 - - City of Toronto 0 $0 $0 - 0 1 - - Toronto West 0 $0 $0 - 0 0 - - Toronto Central 0 $0 $0 - 0 1 - - Toronto East 0 $0 $0 - 0 0 - - York Region 2 $2,887,000 $1,443,500 $1,443,500 1 2 130% 5 Aurora 0 $0 $0 - 0 0 - - East Gwillimbury 0 $0 $0 - 0 0 - - Georgina 1 $1,375,000 $1,375,000 $1,375,000 0 0 138% 9 King 0 $0 $0 - 0 0 - - Markham 1 $1,512,000 $1,512,000 $1,512,000 1 2 123% 1 Newmarket 0 $0 $0 - 0 0 - - Richmond Hill 0 $0 $0 - 0 0 - - Vaughan 0 $0 $0 - 0 0 - - Whitchurch-Stouffville 0 $0 $0 - 0 0 - - Durham Region 2 $1,383,000 $691,500 $691,500 2 0 115% 2 Ajax 2 $1,383,000 $691,500 $691,500 2 0 115% 2 Brock 0 $0 $0 - 0 0 - - Clarington 0 $0 $0 - 0 0 - - Oshawa 0 $0 $0 - 0 0 - - Pickering 0 $0 $0 - 0 0 - - Scugog 0 $0 $0 - 0 0 - - Uxbridge 0 $0 $0 - 0 0 - - Whitby 0 $0 $0 - 0 0 - - Dufferin County 0 $0 $0 - 0 0 - - Orangeville 0 $0 $0 - 0 0 - - Simcoe County 4 $2,865,000 $716,250 $720,000 4 4 98% 23 Adjala-Tosorontio 0 $0 $0 - 0 0 - - Bradford West Gwillimbury 0 $0 $0 - 0 0 - - Essa 0 $0 $0 - 0 0 - - Innisfil 0 $0 $0 - 0 0 - - New Tecumseth 4 $2,865,000 $716,250 $720,000 4 4 98% 23 Municipality Number of Sales Dollar Volume Average Price Median Price New Listings Active Listings Avg. SP/LP Avg. LDOM DET CONDO, SEPTEMBER 2021 Toronto Regional Real Estate Board SUMMARY OF EXISTING HOME TRANSACTIONS ALL TRREB AREAS 1 1 2 4 5 1 1 3 21 Market Watch, September 2021 Copyright® 2021 Toronto Regional Real Estate Board
- 22. TRREB Total 11 $10,342,000 $940,182 $835,000 12 10 109% 13 City of Toronto 0 $0 $0 - 0 1 - - Toronto West 0 $0 $0 - 0 0 - - Toronto W01 0 $0 $0 - 0 0 - - Toronto W02 0 $0 $0 - 0 0 - - Toronto W03 0 $0 $0 - 0 0 - - Toronto W04 0 $0 $0 - 0 0 - - Toronto W05 0 $0 $0 - 0 0 - - Toronto W06 0 $0 $0 - 0 0 - - Toronto W07 0 $0 $0 - 0 0 - - Toronto W08 0 $0 $0 - 0 0 - - Toronto W09 0 $0 $0 - 0 0 - - Toronto W10 0 $0 $0 - 0 0 - - Toronto Central 0 $0 $0 - 0 1 - - Toronto C01 0 $0 $0 - 0 0 - - Toronto C02 0 $0 $0 - 0 0 - - Toronto C03 0 $0 $0 - 0 0 - - Toronto C04 0 $0 $0 - 0 0 - - Toronto C06 0 $0 $0 - 0 0 - - Toronto C07 0 $0 $0 - 0 0 - - Toronto C08 0 $0 $0 - 0 0 - - Toronto C09 0 $0 $0 - 0 1 - - Toronto C10 0 $0 $0 - 0 0 - - Toronto C11 0 $0 $0 - 0 0 - - Toronto C12 0 $0 $0 - 0 0 - - Toronto C13 0 $0 $0 - 0 0 - - Toronto C14 0 $0 $0 - 0 0 - - Toronto C15 0 $0 $0 - 0 0 - - Toronto East 0 $0 $0 - 0 0 - - Toronto E01 0 $0 $0 - 0 0 - - Toronto E02 0 $0 $0 - 0 0 - - Toronto E03 0 $0 $0 - 0 0 - - Toronto E04 0 $0 $0 - 0 0 - - Toronto E05 0 $0 $0 - 0 0 - - Toronto E06 0 $0 $0 - 0 0 - - Toronto E07 0 $0 $0 - 0 0 - - Toronto E08 0 $0 $0 - 0 0 - - Toronto E09 0 $0 $0 - 0 0 - - Toronto E10 0 $0 $0 - 0 0 - - Toronto E11 0 $0 $0 - 0 0 - - Municipality Number of Sales Dollar Volume Average Price Median Price New Listings Active Listings Avg. SP/LP Avg. LDOM DET CONDO, SEPTEMBER 2021 Toronto Regional Real Estate Board SUMMARY OF EXISTING HOME TRANSACTIONS CITY OF TORONTO MUNICIPAL BREAKDOWN 1 1 2 4 5 1 1 3 22 Market Watch, September 2021 Copyright® 2021 Toronto Regional Real Estate Board
- 23. TRREB Total 5 $2,804,000 $560,800 $562,500 15 22 98% 50 Halton Region 0 $0 $0 - 0 0 - - Burlington 0 $0 $0 - 0 0 - - Halton Hills 0 $0 $0 - 0 0 - - Milton 0 $0 $0 - 0 0 - - Oakville 0 $0 $0 - 0 0 - - Peel Region 0 $0 $0 - 0 1 - - Brampton 0 $0 $0 - 0 0 - - Caledon 0 $0 $0 - 0 0 - - Mississauga 0 $0 $0 - 0 1 - - City of Toronto 5 $2,804,000 $560,800 $562,500 15 21 98% 50 Toronto West 0 $0 $0 - 1 2 - - Toronto Central 4 $1,999,000 $499,750 $524,750 14 19 98% 51 Toronto East 1 $805,000 $805,000 $805,000 0 0 97% 49 York Region 0 $0 $0 - 0 0 - - Aurora 0 $0 $0 - 0 0 - - East Gwillimbury 0 $0 $0 - 0 0 - - Georgina 0 $0 $0 - 0 0 - - King 0 $0 $0 - 0 0 - - Markham 0 $0 $0 - 0 0 - - Newmarket 0 $0 $0 - 0 0 - - Richmond Hill 0 $0 $0 - 0 0 - - Vaughan 0 $0 $0 - 0 0 - - Whitchurch-Stouffville 0 $0 $0 - 0 0 - - Durham Region 0 $0 $0 - 0 0 - - Ajax 0 $0 $0 - 0 0 - - Brock 0 $0 $0 - 0 0 - - Clarington 0 $0 $0 - 0 0 - - Oshawa 0 $0 $0 - 0 0 - - Pickering 0 $0 $0 - 0 0 - - Scugog 0 $0 $0 - 0 0 - - Uxbridge 0 $0 $0 - 0 0 - - Whitby 0 $0 $0 - 0 0 - - Dufferin County 0 $0 $0 - 0 0 - - Orangeville 0 $0 $0 - 0 0 - - Simcoe County 0 $0 $0 - 0 0 - - Adjala-Tosorontio 0 $0 $0 - 0 0 - - Bradford West Gwillimbury 0 $0 $0 - 0 0 - - Essa 0 $0 $0 - 0 0 - - Innisfil 0 $0 $0 - 0 0 - - New Tecumseth 0 $0 $0 - 0 0 - - Municipality Number of Sales Dollar Volume Average Price Median Price New Listings Active Listings Avg. SP/LP Avg. LDOM CO-OWNERSHIP APT, SEPTEMBER 2021 Toronto Regional Real Estate Board SUMMARY OF EXISTING HOME TRANSACTIONS ALL TRREB AREAS 1 1 2 4 5 1 1 3 23 Market Watch, September 2021 Copyright® 2021 Toronto Regional Real Estate Board
- 24. TRREB Total 5 $2,804,000 $560,800 $562,500 15 22 98% 50 City of Toronto 5 $2,804,000 $560,800 $562,500 15 21 98% 50 Toronto West 0 $0 $0 - 1 2 - - Toronto W01 0 $0 $0 - 1 1 - - Toronto W02 0 $0 $0 - 0 0 - - Toronto W03 0 $0 $0 - 0 0 - - Toronto W04 0 $0 $0 - 0 0 - - Toronto W05 0 $0 $0 - 0 0 - - Toronto W06 0 $0 $0 - 0 0 - - Toronto W07 0 $0 $0 - 0 0 - - Toronto W08 0 $0 $0 - 0 0 - - Toronto W09 0 $0 $0 - 0 1 - - Toronto W10 0 $0 $0 - 0 0 - - Toronto Central 4 $1,999,000 $499,750 $524,750 14 19 98% 51 Toronto C01 0 $0 $0 - 3 3 - - Toronto C02 1 $487,000 $487,000 $487,000 3 5 100% 12 Toronto C03 1 $562,500 $562,500 $562,500 2 3 99% 103 Toronto C04 1 $620,000 $620,000 $620,000 2 2 96% 31 Toronto C06 0 $0 $0 - 0 0 - - Toronto C07 0 $0 $0 - 0 0 - - Toronto C08 0 $0 $0 - 3 3 - - Toronto C09 0 $0 $0 - 0 0 - - Toronto C10 0 $0 $0 - 0 1 - - Toronto C11 0 $0 $0 - 0 0 - - Toronto C12 0 $0 $0 - 0 0 - - Toronto C13 0 $0 $0 - 1 2 - - Toronto C14 1 $329,500 $329,500 $329,500 0 0 98% 56 Toronto C15 0 $0 $0 - 0 0 - - Toronto East 1 $805,000 $805,000 $805,000 0 0 97% 49 Toronto E01 0 $0 $0 - 0 0 - - Toronto E02 1 $805,000 $805,000 $805,000 0 0 97% 49 Toronto E03 0 $0 $0 - 0 0 - - Toronto E04 0 $0 $0 - 0 0 - - Toronto E05 0 $0 $0 - 0 0 - - Toronto E06 0 $0 $0 - 0 0 - - Toronto E07 0 $0 $0 - 0 0 - - Toronto E08 0 $0 $0 - 0 0 - - Toronto E09 0 $0 $0 - 0 0 - - Toronto E10 0 $0 $0 - 0 0 - - Toronto E11 0 $0 $0 - 0 0 - - Municipality Number of Sales Dollar Volume Average Price Median Price New Listings Active Listings Avg. SP/LP Avg. LDOM CO-OWNERSHIP APT, SEPTEMBER 2021 Toronto Regional Real Estate Board SUMMARY OF EXISTING HOME TRANSACTIONS CITY OF TORONTO MUNICIPAL BREAKDOWN 1 1 2 4 5 1 1 3 24 Market Watch, September 2021 Copyright® 2021 Toronto Regional Real Estate Board
- 25. 354.3 $1,082,400 19.09% 360.6 $1,349,000 23.54% 372.1 $1,048,200 22.60% 354.1 $762,200 18.15% 324.4 $642,400 9.08% 387.9 $1,194,800 24.13% 388.1 $1,416,200 24.15% 403.5 $1,021,300 26.61% 390.4 $752,200 22.04% 353.3 $668,600 17.38% 395.3 $1,140,500 23.61% 404.4 $1,391,900 25.01% 434.7 $1,059,800 29.03% 396.7 $741,300 22.89% 360.5 $595,100 17.43% 377.1 $1,112,300 24.74% 368.1 $1,200,600 24.86% 390.3 $869,700 25.66% 414.9 $660,600 25.05% 357.9 $546,500 18.63% 379.4 $1,154,800 27.62% 376.1 $1,385,300 26.34% 388.6 $936,800 26.21% 375.4 $643,900 21.84% 335.9 $691,100 18.23% 388.2 $1,310,900 22.65% 388.2 $1,574,100 22.38% 409.2 $1,140,700 26.57% 380.6 $864,400 20.94% 349.4 $698,000 16.86% 351.8 $997,000 19.99% 350.0 $1,239,500 23.67% 363.6 $929,100 23.55% 348.9 $737,700 16.61% 335.9 $574,400 8.92% 361.3 $920,300 22.97% 353.9 $1,042,700 24.31% 370.7 $865,700 24.35% 357.5 $646,400 18.73% 330.4 $487,300 11.55% 332.2 $1,214,000 29.11% 337.9 $1,284,500 30.46% 359.5 $888,100 23.37% 308.4 $667,600 19.72% - - - 344.7 $1,017,600 16.41% 347.2 $1,386,800 21.48% 350.9 $967,700 21.84% 345.6 $763,800 15.66% 337.0 $591,700 8.39% 336.2 $1,108,500 10.37% 343.3 $1,551,200 14.28% 360.7 $1,218,600 12.30% 339.6 $805,500 12.26% 324.0 $661,100 7.36% 352.7 $1,201,700 22.85% 364.9 $1,410,700 24.71% 362.3 $1,047,100 25.28% 317.1 $820,600 19.93% 292.7 $635,500 13.01% 344.9 $1,140,800 22.61% 347.8 $1,306,700 22.21% 366.7 $945,600 25.71% 318.0 $861,500 31.79% 293.2 $629,100 14.04% 353.4 $1,209,200 35.56% 354.8 $1,265,900 33.48% 379.3 $793,400 42.27% - - - - - - 393.2 $763,000 36.10% 402.1 $775,700 36.12% 367.4 $724,200 30.47% - - - - - - 349.4 $1,626,200 23.99% 355.3 $1,665,200 25.24% 347.6 $1,066,100 27.19% - - - 270.6 $668,900 11.31% 357.6 $1,257,000 22.17% 380.2 $1,591,800 22.80% 375.6 $1,118,100 26.38% 304.9 $822,900 18.59% 300.7 $692,600 14.81% 332.8 $980,000 27.27% 335.0 $1,129,100 27.28% 337.8 $795,600 28.88% 352.2 $728,900 30.01% 295.8 $506,200 14.47% 363.6 $1,306,400 21.16% 389.7 $1,664,600 22.66% 362.4 $1,101,800 24.66% 298.8 $757,500 13.61% 303.5 $614,100 15.01% 336.4 $1,227,800 18.70% 337.7 $1,434,800 20.61% 353.1 $1,072,000 22.31% 322.5 $891,800 12.25% 276.4 $638,300 9.55% 371.5 $1,294,200 24.33% 370.0 $1,364,800 25.42% 379.3 $946,400 24.73% 395.6 $702,200 29.49% 292.5 $585,300 12.07% 377.9 $882,300 32.18% 368.5 $961,600 32.36% 395.9 $789,600 33.39% 390.6 $614,600 31.83% 350.3 $581,300 21.55% 369.1 $910,300 30.61% 366.9 $984,300 30.90% 384.1 $828,800 31.59% 361.0 $678,300 28.61% 317.4 $509,700 19.95% 355.7 $599,900 34.68% 355.4 $605,400 34.57% 358.8 $723,700 34.23% - - - - - - 384.2 $811,500 35.23% 372.1 $896,200 34.82% 396.2 $756,900 37.76% 373.2 $602,800 30.40% 302.3 $445,500 20.73% 394.4 $750,000 33.15% 380.1 $811,200 33.32% 432.8 $724,300 34.62% 416.5 $527,900 33.28% 349.0 $394,800 18.35% 369.1 $984,500 26.71% 348.7 $1,086,300 27.12% 373.8 $872,200 26.50% 381.9 $651,600 28.03% 446.5 $841,100 24.79% 361.5 $928,100 32.42% 356.6 $945,200 33.31% 353.9 $657,900 29.63% - - - - - - 341.7 $1,138,500 29.53% 344.3 $1,189,100 29.68% 337.1 $781,700 31.27% 328.4 $598,000 30.42% 270.6 $646,200 15.89% 370.2 $961,800 32.50% 367.7 $1,057,500 32.17% 383.6 $845,100 33.19% 383.3 $644,000 37.63% 281.6 $522,800 20.19% 377.3 $832,700 22.66% 396.0 $902,500 22.75% 380.2 $712,500 24.33% 352.5 $466,000 28.37% 341.1 $500,400 7.06% 377.3 $832,700 22.66% 396.0 $902,400 22.75% 380.2 $712,500 24.33% 352.5 $466,000 28.37% 341.1 $500,400 7.06% 359.8 $786,000 32.38% 352.7 $809,200 35.50% 398.4 $744,100 40.68% 315.7 $498,400 22.74% 318.1 $503,100 17.55% 350.2 $936,300 35.63% 350.5 $938,400 35.59% - - - - - - - - - 371.4 $929,700 29.54% 349.9 $998,300 30.22% 407.9 $859,400 41.14% 344.7 $559,800 20.02% 294.8 $497,300 16.06% 385.7 $772,100 34.11% 375.1 $793,700 41.71% 410.1 $647,100 40.78% 335.0 $534,300 16.24% - - - 356.6 $703,300 32.71% 355.2 $722,100 35.06% 409.1 $625,500 34.71% 295.5 $248,500 28.81% 301.3 $592,100 14.61% - - - - - - - - - - - - - - - 339.4 $797,300 32.47% 333.8 $869,100 33.79% 374.4 $681,700 33.29% 311.9 $630,400 21.36% 339.3 $529,200 21.74% Composite Single Family Detached Single Family Attached Townhouse Apartment Index Benchmark Yr./Yr. % Chg. Index Benchmark Yr./Yr. % Chg. Index Benchmark Yr./Yr. % Chg. Index Benchmark Yr./Yr. % Chg. Index Benchmark Yr./Yr. % Chg. Toronto Regional Real Estate Board FOCUS ON THE MLS HOME PRICE INDEX ALL TRREB AREAS INDEX AND BENCHMARK PRICE, SEPTEMBER 2021 TRREB Total Halton Region Burlington Halton Hills Milton Oakville Peel Region Brampton Caledon Mississauga City of Toronto York Region Aurora East Gwillimbury Georgina King Markham Newmarket Richmond Hill Vaughan Whitchurch-Stouffville Durham Region Ajax Brock Clarington Oshawa Pickering Scugog Uxbridge Whitby Dufferin County Orangeville Simcoe County Adjala-Tosorontio Bradford West Gwillimbury Essa Innisfil Barrie New Tecumseth 25 Market Watch, September 2021 Copyright® 2021 Toronto Regional Real Estate Board
- 26. 354.3 $1,082,400 19.09% 360.6 $1,349,000 23.54% 372.1 $1,048,200 22.60% 354.1 $762,200 18.15% 324.4 $642,400 9.08% 336.2 $1,108,500 10.37% 343.3 $1,551,200 14.28% 360.7 $1,218,600 12.30% 339.6 $805,500 12.26% 324.0 $661,100 7.36% 314.6 $1,342,900 7.26% 325.3 $1,811,900 7.36% 340.8 $1,354,600 6.80% 289.4 $870,700 7.15% 306.0 $691,800 7.07% 375.9 $1,339,300 9.02% 354.1 $1,547,800 7.92% 397.9 $1,183,200 7.77% 405.8 $790,200 10.51% 362.0 $777,100 10.50% 377.1 $972,300 12.33% 386.0 $1,044,700 13.66% 384.4 $984,700 10.78% 294.1 $721,100 7.10% 355.2 $606,900 10.97% 352.7 $905,200 8.76% 337.3 $1,067,400 13.88% 329.1 $935,300 8.01% 305.3 $702,800 6.64% 380.6 $561,500 4.68% 325.4 $773,000 13.82% 331.7 $1,112,300 15.74% 318.2 $924,300 17.11% 322.0 $584,700 15.99% 332.6 $439,400 7.67% 291.4 $853,500 11.35% 384.4 $1,214,700 15.78% 355.5 $1,197,100 19.18% 359.5 $1,066,000 10.07% 235.0 $589,500 7.80% 315.0 $1,392,900 14.96% 336.7 $1,544,100 16.34% 336.9 $1,400,500 19.68% 261.7 $962,000 8.63% 181.6 $736,400 3.83% 293.7 $1,244,900 10.54% 305.7 $1,714,000 15.01% 338.6 $1,273,300 17.81% 343.4 $825,900 9.57% 276.1 $574,900 6.64% 317.8 $829,200 13.42% 328.9 $1,275,500 17.67% 347.2 $957,700 19.39% 263.3 $731,300 5.91% 317.1 $417,800 9.50% 364.7 $833,100 14.40% 345.0 $1,035,000 16.91% 347.3 $888,700 14.81% 413.1 $743,700 17.13% 375.8 $535,400 11.98% 351.6 $882,100 6.45% 409.0 $1,602,400 7.77% 403.1 $1,473,000 7.26% 336.3 $958,600 7.00% 347.0 $722,400 6.28% 317.2 $1,598,100 7.49% 304.9 $2,573,500 10.63% 322.3 $1,806,300 8.70% 312.5 $1,571,400 2.53% 313.6 $893,400 6.67% 370.4 $2,146,300 12.11% 352.3 $2,388,400 12.81% 362.5 $1,398,800 10.86% - - - 400.1 $1,046,600 11.29% 301.5 $1,944,500 10.68% 309.8 $2,267,800 10.80% 315.9 $1,477,300 12.74% - - - 263.4 $704,600 7.29% 327.9 $1,321,200 13.85% 330.3 $1,470,600 13.27% 321.9 $1,186,600 18.00% 302.7 $811,800 8.22% 326.8 $702,900 14.35% 335.5 $1,146,700 10.58% 361.7 $1,722,000 10.27% 297.1 $1,120,400 15.56% 305.0 $859,700 8.27% 325.7 $678,700 10.41% 306.7 $796,400 5.03% 334.6 $1,959,200 5.45% 345.4 $1,647,700 9.13% 334.7 $865,600 9.49% 303.2 $649,500 4.77% 254.1 $1,822,900 3.50% 267.8 $3,452,700 11.86% 275.6 $2,608,600 11.58% 289.1 $1,707,400 2.26% 235.3 $779,500 -2.73% 316.4 $1,250,600 7.04% 305.2 $1,884,300 10.10% 300.3 $1,483,600 12.68% 288.7 $967,700 4.22% 323.8 $773,200 5.96% 362.9 $1,316,500 8.07% 328.1 $2,362,300 9.59% 353.4 $1,638,700 7.88% 315.1 $545,900 20.77% 382.9 $556,000 6.45% 287.3 $2,482,000 12.71% 285.0 $3,090,100 16.18% 346.4 $1,424,200 15.24% 248.9 $995,800 13.76% 314.3 $985,400 5.43% 327.1 $1,224,900 12.83% 335.9 $1,870,000 17.00% 322.9 $1,007,000 23.53% 298.8 $863,800 11.58% 319.6 $652,900 8.45% 320.1 $1,086,600 7.63% 369.4 $2,222,200 12.79% 289.8 $1,496,300 17.47% 353.6 $952,200 10.50% 304.3 $766,300 5.37% 330.4 $1,070,000 11.25% 346.5 $1,626,900 12.54% 295.1 $959,400 16.32% 337.7 $808,300 13.25% 326.3 $751,200 9.87% 412.6 $1,284,200 10.56% 425.1 $1,497,500 10.42% 435.5 $1,373,500 11.70% 499.2 $913,000 14.26% 302.2 $676,000 2.79% 361.5 $1,349,600 10.62% 321.6 $1,455,400 12.84% 382.5 $1,280,000 10.55% 385.7 $1,110,900 12.98% 314.8 $894,500 4.34% 352.1 $1,095,300 10.07% 360.3 $1,224,700 11.20% 339.1 $1,131,800 9.74% - - - 328.5 $491,000 6.35% 353.0 $870,600 12.96% 341.6 $1,007,100 16.59% 353.4 $851,700 13.96% 308.3 $655,500 11.54% 391.1 $596,400 9.06% 318.4 $846,000 16.89% 344.8 $1,214,200 18.57% 337.6 $930,300 19.46% 340.4 $740,300 17.30% 276.9 $568,400 12.29% 349.5 $971,900 11.88% 359.9 $1,028,100 13.60% 355.6 $845,700 12.64% 329.0 $727,100 11.60% 305.3 $628,500 5.82% 353.4 $866,300 16.52% 359.2 $1,177,300 19.02% 351.9 $920,100 19.41% 352.5 $763,600 17.93% 347.1 $594,400 13.36% 353.2 $814,300 14.90% 340.7 $1,062,000 15.49% 303.1 $785,800 13.39% 325.2 $596,300 18.21% 383.1 $522,700 12.91% 346.0 $826,200 14.99% 346.9 $985,000 18.19% 334.5 $818,100 15.90% 372.7 $671,000 17.28% 342.2 $641,900 11.50% 361.5 $1,013,800 19.46% 347.9 $1,114,700 21.98% 351.6 $911,700 21.83% 409.1 $667,400 17.90% 338.0 $545,300 9.07% 372.1 $793,600 14.67% 359.6 $1,000,200 15.55% 370.8 $839,900 18.09% 297.0 $582,900 18.23% 457.1 $579,400 13.26% Composite Single Family Detached Single Family Attached Townhouse Apartment Index Benchmark Yr./Yr. % Chg. Index Benchmark Yr./Yr. % Chg. Index Benchmark Yr./Yr. % Chg. Index Benchmark Yr./Yr. % Chg. Index Benchmark Yr./Yr. % Chg. Toronto Regional Real Estate Board FOCUS ON THE MLS HOME PRICE INDEX CITY OF TORONTO INDEX AND BENCHMARK PRICE, SEPTEMBER 2021 TRREB Total City of Toronto Toronto W01 Toronto W02 Toronto W03 Toronto W04 Toronto W05 Toronto W06 Toronto W07 Toronto W08 Toronto W09 Toronto W10 Toronto C01 Toronto C02 Toronto C03 Toronto C04 Toronto C06 Toronto C07 Toronto C08 Toronto C09 Toronto C10 Toronto C11 Toronto C12 Toronto C13 Toronto C14 Toronto C15 Toronto E01 Toronto E02 Toronto E03 Toronto E04 Toronto E05 Toronto E06 Toronto E07 Toronto E08 Toronto E09 Toronto E10 Toronto E11 26 Market Watch, September 2021 Copyright® 2021 Toronto Regional Real Estate Board
- 27. 2009 86,980 $395,234 2010 85,860 $431,262 2011 89,110 $464,989 2012 85,488 $497,073 2013 87,047 $522,951 2014 92,776 $566,611 2015 101,213 $622,118 2016 113,040 $729,821 2017 92,340 $822,496 2018 78,017 $787,800 2019 87,747 $819,043 Year Sales Average Price Toronto Regional Real Estate Board January 4,546 838,087 February 7,193 910,068 March 7,942 902,788 April 2,957 820,226 May 4,594 863,563 June 8,645 931,131 July 11,033 943,594 August 10,738 951,219 September 11,033 960,613 October 10,503 968,535 November 8,728 955,889 December 7,155 932,306 January 6,888 $966,068 February 10,931 $1,044,933 March 15,629 $1,097,372 April 13,619 $1,090,541 May 11,908 $1,108,285 June 11,063 $1,089,255 July 9,348 $1,062,167 August 8,580 $1,069,669 September 9,046 $1,136,280 October - - November - - December - - Annual 95,067 $929,636 HISTORIC ANNUAL STATISTICS1,6,7 Year to Date 97,012 $1,079,381 NOTES *For historic annual sales and average price data over a longer time frame go to: http://www.torontorealestateboard.com/market_news/market_watch/historic_stats/ pdf/TREB_historic_statistics.pdf Ajax Aurora Bradford West Gwillimbury Brampton Brock Burlington C01 C02 C03 C04 C06 C07 C08 C10 C11 C12 C13 C14 C15 Caledon Clarington E01 E02 E03 E04 E06 E07 E08 E09 E10 E11 East Gwillimbury Essa Georgina Halton Hills Innisfil King Markham Milton Mississauga New Tecumseth Newmarket Oakville Oshawa Pickering Richmond Hill Scugog Uxbridge Vaughan W02 W03 W04 W05 W06 W07 W08 W09 W10 Whitchurch-Stouffville Adjala-Tosorontio Orangeville Whitby Dufferin Durham Halton Peel Simcoe Toronto York 27 Market Watch, September 2021 Copyright® 2021 Toronto Regional Real Estate Board 1 - Sales, dollar volume, average sale prices and median sale prices are based on firm transactions entered into the TRREB MLS® system between the first and last day of the month/period being reported. 2 - New listings entered into the TRREB MLS® system between the first and last day of the month/period being reported. 3 - Active listings at the end of the last day of the month/period being reported. 4 - Ratio of the average selling price to the average listing price for firm transactions entered into the TRREB MLS® system between the first and last day of the month/period being reported. 5 - Average Listing Days on Market (Avg. LDOM) refers to the average number of days sold listings were on the market. Average Property Days on Market (Avg. PDOM) refers to the average number of days a property was on the market before selling irrespective of whether the property was listed more than once by the same combination of seller and brokerage during the original listing contract period. 6 - Active listings at the end of the last day of the month/period being reported. 7 - Past monthly and year-to-date figures are revised on a monthly basis. 8 - SNLR = Sales-to-New Listings Ratio. Calculated using a 12-month moving average (sales/new listings). 9 - Mos. Inv. = Months of Inventory. Calculated using a 12-month moving average (active listings/sales). 2021 MONTHLY STATISTICS1,7 2020 MONTHLY STATISTICS1,7