Record Home Sales in Toronto Region in April 2016
•
0 likes•339 views

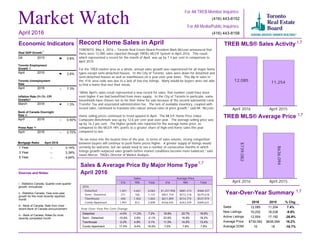
12,085 sales reported through TREB’s MLS® System in April 2016. Record Homes Sales

Recommended
More Related Content
What's hot
What's hot (16)
Viewers also liked
Viewers also liked (20)
Similar to Record Home Sales in Toronto Region in April 2016
Similar to Record Home Sales in Toronto Region in April 2016 (17)
More from Michelle Makos
More from Michelle Makos (16)
Recently uploaded
Recently uploaded (20)
Record Home Sales in Toronto Region in April 2016
- 1. Toronto Employment Growth April 2016 2.6% Month April 2016 1 Year 3 Year 5 Year 3.14% 3.39% 4.64% April 2016 1 Year 3 Year 5 Year -- -- -- Market Watch For All TREB Member Inquiries: (416) 443-8158 For All Media/Public Inquiries: (416) 443-8152 Record Home Sales in April TORONTO, May 4, 2016 – Toronto Real Estate Board President Mark McLean announced that there were 12,085 sales reported through TREB’s MLS® System in April 2016. This result, which represented a record for the month of April, was up by 7.4 per cent in comparison to April 2015. For the TREB market area as a whole, annual sales growth was experienced for all major home types except semi-detached houses. In the City of Toronto, sales were down for detached and semi-detached houses as well as townhouses on a year-over-year basis. This dip in sales in the ‘416’ area code was due to a lack of low-rise listings. Many would-be buyers were not able to find a home that met their needs. “While April’s sales result represented a new record for sales, that number could have been even higher if we had benefitted from more supply. In the City of Toronto in particular, some households have chosen not to list their home for sale because of the second substantial Land Transfer Tax and associated administration fee. The lack of available inventory, coupled with record sales, continued to translate into robust annual rates of price growth,” said Mr. McLean. Home selling prices continued to trend upward in April. The MLS® Home Price Index Composite Benchmark was up by 12.6 per cent year-over-year. The average selling price was up by 16.2 per cent. The higher growth rate reported for the average home price, as compared to the MLS® HPI, points to a greater share of high-end home sales this year compared to last. “As we move into the busiest time of the year, in terms of sales volume, strong competition between buyers will continue to push home prices higher. A greater supply of listings would certainly be welcome, but we would need to see a number of consecutive months in which listings growth outpaced sales growth before market conditions become more balanced,” said Jason Mercer, TREB’s Director of Market Analysis. TREB MLS® Sales Activity 12,085 11,254 April 2016 April 2015 TREB MLS® Average Price $739,082 $636,094 April 2016 April 2015 Year-Over-Year Summary 2016 2015 % Chg. Sales New Listings Active Listings Average Price Average DOM 12,085 11,254 7.4% 16,252 18,038 -9.9% 12,554 17,182 -26.9% $739,082 $636,094 16.2% 15 18 -16.7% Sources and Notes: i - Statistics Canada, Quarter-over-quarter growth, annualized ii - Statistics Canada, Year-over-year growth for the most recently reported month iii - Bank of Canada, Rate from most recent Bank of Canada announcement iv - Bank of Canada, Rates for most recently completed month Real GDP Growth Q4 2015 0.8% Toronto Unemployment Rate April 2016 -- 7.3% Inflation Rate (Yr./Yr. CPI Growth) March 2016 1.3% Bank of Canada Overnight Rate April 2016 -- 0.50% Prime Rate April 2016 -- 2.70% Economic Indicators Metrics Sales Average Price 416 905 Total 416 905 Total 2016 Detached Semi - Detached Townhouse Condo Apartment 1,401 4,661 6,062 $1,257,958 $881,413 $968,437 371 766 1,137 $901,159 $572,318 $679,618 440 1,402 1,842 $611,899 $514,774 $537,974 1,997 812 2,809 $436,545 $343,439 $409,631 Sales & Average Price By Major Home Type April 2016 April 2016 i ii ii iii iv Detached Semi - Detached Townhouse Condo Apartment 18.9% 20.7% 18.9% 23.8% 16.9% 18.2% 11.0% 14.8% 13.4% 7.0% 7.8% 7.6% Detached Semi - Detached Townhouse Condo Apartment -4.0% 11.2% 7.2% -10.8% 2.8% -2.1% -2.0% 4.8% 3.1% 17.4% 9.4% 15.0% 1,7 1,7 1,7 1,7 Year-Over-Year Per Cent Change Mortgage Rates
- 2. Toronto Real Estate Board Market Watch, April 2016 SALES BY PRICE RANGE AND HOUSE TYPE APRIL 2016 2 Price Range Detached Semi-Detached Att/Row/Twnhouse Condo Townhouse Condo Apt Link Co-op Apt Det Condo Co-ownership Apt Total $0 to $99,999 $100,000 to $199,999 $200,000 to $299,999 $300,000 to $399,999 $400,000 to $499,999 $500,000 to $599,999 $600,000 to $699,999 $700,000 to $799,999 $800,000 to $899,999 $900,000 to $999,999 $1,000,000 to $1,249,999 $1,250,000 to $1,499,999 $1,500,000 to $1,749,999 $1,750,000 to $1,999,999 $2,000,000+ 0 0 0 0 10 0 1 0 0 11 7 2 0 21 109 0 4 0 2 145 55 11 11 87 698 0 3 0 5 870 205 60 80 225 909 25 2 0 2 1,508 426 141 271 255 523 24 1 2 0 1,643 656 324 211 130 257 36 1 0 0 1,615 836 229 177 62 130 32 1 1 0 1,468 815 148 107 36 67 31 2 0 0 1,206 661 82 73 16 34 32 1 0 0 899 453 50 27 9 19 19 1 0 0 578 682 42 12 7 20 6 0 1 0 770 501 22 5 8 10 0 0 0 0 546 293 13 2 1 7 0 0 0 0 316 139 3 3 4 8 0 0 0 0 157 333 10 1 1 8 0 0 0 0 353 Price Range Detached Semi-Detached Att/Row/Twnhouse Condo Townhouse Condo Apt Link Co-op Apt Det Condo Co-ownership Apt Total $0 to $99,999 $100,000 to $199,999 $200,000 to $299,999 $300,000 to $399,999 $400,000 to $499,999 $500,000 to $599,999 $600,000 to $699,999 $700,000 to $799,999 $800,000 to $899,999 $900,000 to $999,999 $1,000,000 to $1,249,999 $1,250,000 to $1,499,999 $1,500,000 to $1,749,999 $1,750,000 to $1,999,999 $2,000,000+ 0 0 0 0 31 0 1 0 1 33 33 5 4 69 363 0 8 0 5 487 206 45 29 295 2,397 2 11 1 11 2,997 687 178 254 691 2,852 72 4 2 5 4,745 1,432 618 803 712 1,538 98 5 3 2 5,211 2,092 953 611 340 730 81 1 3 0 4,811 2,432 599 446 137 376 81 2 2 0 4,075 2,215 373 296 87 191 88 3 0 0 3,253 1,660 201 196 42 79 82 2 1 1 2,264 1,182 111 55 18 58 35 1 0 0 1,460 1,719 100 39 27 76 12 0 1 0 1,974 1,216 50 21 12 34 0 0 0 0 1,333 669 30 5 1 15 0 0 0 0 720 373 10 5 5 16 0 0 0 0 409 806 20 5 1 19 0 0 0 0 851 SALES BY PRICE RANGE AND HOUSE TYPE YEAR-TO-DATE, 2016 Total Sales Share of Total Sales Average Price 6,062 1,137 980 862 2,809 205 17 4 9 12,085 50.2% 9.4% 8.1% 7.1% 23.2% 1.7% 0.1% 0.0% 0.1% 100.0% $968,437 $679,618 $594,821 $473,346 $409,631 $658,274 $411,588 $686,125 $236,167 $739,082 Total Sales Share of Total Sales Average Price 16,722 3,293 2,769 2,437 8,775 551 38 13 25 34,623 48.3% 9.5% 8.0% 7.0% 25.3% 1.6% 0.1% 0.0% 0.1% 100.0% $923,221 $643,036 $587,782 $449,680 $398,838 $632,097 $376,929 $577,577 $270,684 $697,679 1,7 1,7
- 3. Toronto Real Estate Board Market Watch, April 2016 Number of Sales Dollar Volume Average Price Median Price New Listings SNLR (Trend) Active Listings Mos. Inv. (Trend) Avg. SP / LP Avg. DOM TREB Total Halton Region Burlington Halton Hills Milton Oakville Peel Region Brampton Caledon Mississauga City of Toronto Toronto West Toronto Central Toronto East York Region Aurora E. Gwillimbury Georgina King Markham Newmarket Richmond Hill Vaughan Whitchurch-Stouffville Durham Region Ajax Brock Clarington Oshawa Pickering Scugog Uxbridge Whitby Dufferin County Orangeville Simcoe County Adjala-Tosorontio Bradford West GwillimburyEssa Innisfil New Tecumseth 12,085 $8,931,801,909 739,082 $615,000 16,252 66.4% 12,554 1.6 104% 15 1,148 $904,673,664 788,043 $688,500 1,401 72.8% 1,071 1.6 101% 15 271 $180,261,954 665,173 $619,900 312 76.1% 262 1.6 100% 16 111 $66,813,600 601,924 $550,000 137 75.7% 112 1.6 99% 16 279 $177,031,540 634,522 $600,007 325 77.3% 198 1.1 101% 11 487 $480,566,570 986,790 $874,888 627 67.7% 499 1.8 101% 15 2,454 $1,505,224,689 613,376 $565,250 3,238 67.9% 2,193 1.5 102% 14 1,113 $618,161,414 555,401 $537,500 1,439 70.0% 782 1.1 101% 11 130 $94,077,790 723,675 $690,000 176 66.8% 175 2.4 101% 17 1,211 $792,985,485 654,819 $600,000 1,623 66.1% 1,236 1.7 102% 15 4,248 $3,255,975,070 766,472 $583,000 6,155 60.9% 5,677 2.0 105% 18 1,028 $669,814,792 651,571 $587,500 1,462 63.9% 1,383 1.9 104% 19 2,129 $1,860,066,807 873,681 $529,888 3,281 56.4% 3,423 2.4 104% 20 1,091 $726,093,471 665,530 $655,000 1,412 67.7% 871 1.3 108% 13 2,527 $2,391,191,048 946,257 $840,000 3,367 66.4% 2,312 1.5 105% 13 148 $146,319,902 988,648 $866,500 173 77.9% 92 1.2 105% 11 50 $36,467,200 729,344 $660,250 53 66.7% 65 2.3 101% 23 138 $73,479,909 532,463 $476,000 184 71.8% 128 1.7 101% 16 53 $58,369,690 1,101,315 $990,000 79 60.5% 101 3.5 97% 28 658 $660,231,605 1,003,391 $912,500 963 62.7% 667 1.5 107% 13 258 $194,457,585 753,712 $725,500 277 81.2% 121 0.8 104% 10 498 $548,222,292 1,100,848 $1,004,000 699 63.7% 456 1.5 106% 13 600 $555,709,453 926,182 $841,000 785 65.3% 571 1.6 104% 13 124 $117,933,412 951,076 $811,000 154 69.3% 111 1.8 100% 15 1,322 $687,702,498 520,199 $495,250 1,603 77.4% 878 1.0 104% 11 208 $117,684,368 565,790 $547,500 253 78.9% 104 0.7 106% 7 20 $8,169,900 408,495 $345,000 38 61.3% 60 4.2 97% 37 223 $99,725,711 447,200 $430,000 257 79.6% 149 1.0 104% 10 344 $148,668,741 432,177 $405,750 420 80.0% 187 0.8 106% 8 169 $105,529,842 624,437 $575,000 203 73.2% 115 1.1 103% 15 48 $26,147,800 544,746 $478,750 70 70.4% 61 2.3 99% 20 37 $27,788,880 751,051 $690,000 41 66.7% 63 2.6 100% 18 273 $153,987,256 564,056 $540,000 321 78.7% 139 0.8 105% 10 73 $32,042,026 438,932 $420,000 73 89.1% 44 1.0 100% 21 73 $32,042,026 438,932 $420,000 73 89.1% 44 1.0 100% 21 313 $154,992,914 495,185 $465,000 415 75.8% 379 1.9 99% 21 17 $10,606,400 623,906 $569,000 23 72.6% 40 3.2 98% 31 73 $45,493,567 623,200 $615,000 83 80.6% 57 1.2 100% 23 53 $21,666,900 408,809 $376,500 76 76.1% 65 1.9 99% 19 89 $40,961,747 460,244 $427,000 118 67.8% 120 2.4 98% 18 81 $36,264,300 447,707 $432,000 115 81.2% 97 1.7 101% 20 SUMMARY OF EXISTING HOME TRANSACTIONS ALL HOME TYPES, APRIL 2016 ALL TREB AREAS 3 1 1 1 2 5498 3
- 4. Toronto Real Estate Board Market Watch, April 2016 SUMMARY OF EXISTING HOME TRANSACTIONS ALL HOME TYPES, APRIL 2016 CITY OF TORONTO MUNICIPAL BREAKDOWN 4 Number of Sales Dollar Volume Average Price Median Price New Listings SNLR (Trend) Active Listings Mos. Inv. (Trend) Avg. SP / LP Avg. DOM TREB Total City of Toronto Total Toronto West Toronto W01 Toronto W02 Toronto W03 Toronto W04 Toronto W05 Toronto W06 Toronto W07 Toronto W08 Toronto W09 Toronto W10 Toronto Central Toronto C01 Toronto C02 Toronto C03 Toronto C04 Toronto C06 Toronto C07 Toronto C08 Toronto C09 Toronto C10 Toronto C11 Toronto C12 Toronto C13 Toronto C14 Toronto C15 Toronto East Toronto E01 Toronto E02 Toronto E03 Toronto E04 Toronto E05 Toronto E06 Toronto E07 Toronto E08 Toronto E09 Toronto E10 Toronto E11 12,085 $8,931,801,909 $739,082 $615,000 16,252 66.4% 12,554 1.6 104% 15 4,248 $3,255,975,070 $766,472 $583,000 6,155 60.9% 5,677 2.0 105% 18 1,028 $669,814,792 $651,571 $587,500 1,462 63.9% 1,383 1.9 104% 19 59 $43,135,300 $731,107 $625,000 83 61.0% 82 2.0 104% 22 97 $94,668,977 $975,969 $895,000 117 72.8% 74 1.1 110% 10 93 $58,358,708 $627,513 $622,500 131 67.8% 82 1.3 107% 13 81 $51,167,351 $631,696 $625,000 134 64.0% 131 1.8 104% 15 127 $58,506,677 $460,682 $465,000 198 65.8% 202 2.0 101% 22 167 $93,486,430 $559,799 $547,000 250 52.2% 304 3.0 103% 25 43 $38,861,970 $903,767 $780,000 59 64.0% 37 1.5 104% 14 222 $167,218,442 $753,236 $650,000 284 64.8% 286 2.0 101% 21 48 $27,126,017 $565,125 $693,750 80 70.9% 75 1.5 105% 15 91 $37,284,920 $409,724 $375,000 126 69.5% 110 1.5 100% 17 2,129 $1,860,066,807 $873,681 $529,888 3,281 56.4% 3,423 2.4 104% 20 642 $350,025,944 $545,212 $438,000 1,095 53.0% 1,318 2.8 101% 24 97 $109,866,744 $1,132,647 $860,000 167 48.2% 199 3.4 102% 21 57 $70,907,617 $1,243,993 $905,000 91 57.7% 91 2.3 105% 20 116 $201,070,234 $1,733,364 $1,545,000 148 63.5% 104 1.7 106% 16 47 $40,740,400 $866,817 $950,000 52 59.3% 46 2.3 107% 19 164 $148,058,377 $902,795 $575,900 237 58.8% 237 2.2 106% 18 209 $106,470,340 $509,427 $432,400 335 58.4% 339 2.3 99% 20 47 $87,788,284 $1,867,836 $1,650,000 66 61.5% 77 2.1 100% 20 72 $71,862,144 $998,085 $763,500 112 58.7% 97 1.8 108% 18 56 $42,539,173 $759,628 $419,750 67 66.9% 50 1.5 112% 12 67 $163,098,816 $2,434,311 $2,300,000 97 55.2% 106 3.2 100% 19 104 $107,016,990 $1,029,010 $662,500 136 68.3% 110 1.5 111% 14 256 $213,188,343 $832,767 $464,500 370 54.8% 342 2.5 103% 23 195 $147,433,401 $756,069 $508,000 308 57.2% 307 2.3 107% 20 1,091 $726,093,471 $665,530 $655,000 1,412 67.7% 871 1.3 108% 13 111 $93,329,134 $840,803 $812,900 120 68.8% 56 1.0 110% 8 78 $77,451,448 $992,967 $844,500 102 68.3% 54 1.1 109% 11 107 $89,098,284 $832,694 $800,000 108 70.7% 46 0.9 112% 11 128 $71,479,459 $558,433 $631,000 162 68.6% 101 1.2 107% 13 139 $92,384,229 $664,635 $600,000 191 67.0% 121 1.3 109% 13 48 $33,912,838 $706,517 $685,500 56 62.3% 25 1.4 106% 11 104 $59,460,894 $571,739 $590,500 158 62.5% 129 1.7 106% 17 77 $47,933,900 $622,518 $650,000 90 70.7% 54 1.3 104% 12 123 $59,139,186 $480,806 $530,000 184 68.6% 141 1.4 104% 15 71 $46,837,867 $659,688 $624,000 107 63.4% 77 1.5 104% 14 105 $55,066,232 $524,440 $529,800 134 71.9% 67 1.1 106% 12 1 1 1 2 8 3 9 4 5
- 5. Toronto Real Estate Board Market Watch, April 2016 SUMMARY OF EXISTING HOME TRANSACTIONS ALL HOME TYPES, YEAR-TO-DATE 2016 ALL TREB AREAS 5 Number of Sales Dollar Volume Average Price Median Price New Listings Avg. SP / LP Avg. DOM TREB Total Halton Region Burlington Halton Hills Milton Oakville Peel Region Brampton Caledon Mississauga City of Toronto Toronto West Toronto Central Toronto East York Region Aurora E. Gwillimbury Georgina King Markham Newmarket Richmond Hill Vaughan Whitchurch-Stouffville Durham Region Ajax Brock Clarington Oshawa Pickering Scugog Uxbridge Whitby Dufferin County Orangeville Simcoe County Adjala-Tosorontio Bradford West GwillimburyEssa Innisfil New Tecumseth 34,623 $24,155,747,801 $697,679 $578,900 51,199 102% 19 3,140 $2,414,816,479 $769,050 $665,000 4,419 100% 18 696 $455,115,706 $653,902 $609,200 967 99% 21 350 $211,360,314 $603,887 $555,500 462 99% 22 816 $501,692,734 $614,820 $573,500 1,076 101% 13 1,278 $1,246,647,725 $975,468 $852,250 1,914 100% 19 7,301 $4,252,799,933 $582,496 $539,000 10,326 100% 17 3,399 $1,858,784,770 $546,862 $525,000 4,576 100% 14 333 $243,234,885 $730,435 $680,000 523 99% 22 3,569 $2,150,780,278 $602,628 $545,000 5,227 100% 19 12,348 $8,874,290,016 $718,682 $551,500 19,855 103% 22 3,045 $1,876,087,019 $616,121 $555,000 4,784 102% 23 6,152 $5,051,146,897 $821,058 $510,000 10,693 102% 24 3,151 $1,947,056,100 $617,917 $616,000 4,378 105% 17 6,897 $6,182,993,132 $896,476 $800,000 10,161 103% 17 427 $383,485,366 $898,092 $810,000 544 104% 15 116 $81,006,880 $698,335 $641,250 179 100% 24 374 $177,226,181 $473,867 $449,950 519 100% 20 144 $161,734,481 $1,123,156 $1,017,500 237 96% 40 1,865 $1,738,256,825 $932,041 $850,000 2,864 105% 17 626 $462,732,024 $739,189 $716,500 799 103% 11 1,399 $1,443,446,636 $1,031,770 $930,000 2,119 104% 16 1,638 $1,461,141,662 $892,028 $810,000 2,467 102% 17 308 $273,963,077 $889,491 $756,500 433 100% 21 3,834 $1,896,459,556 $494,643 $470,000 4,913 103% 14 628 $346,508,053 $551,764 $530,000 784 104% 11 66 $23,626,600 $357,979 $293,500 114 97% 44 654 $284,415,941 $434,887 $415,000 822 103% 13 992 $404,229,863 $407,490 $390,500 1,234 104% 11 519 $298,167,369 $574,504 $535,100 664 102% 16 131 $67,061,650 $511,921 $476,500 187 99% 24 109 $72,596,694 $666,025 $630,480 165 99% 27 735 $399,853,386 $544,018 $530,000 943 104% 11 225 $95,930,326 $426,357 $405,000 273 100% 18 225 $95,930,326 $426,357 $405,000 273 100% 18 878 $438,458,359 $499,383 $465,000 1,252 99% 23 57 $32,872,322 $576,707 $530,000 81 98% 46 267 $161,670,659 $605,508 $565,000 336 99% 18 123 $48,168,500 $391,614 $365,500 186 98% 26 223 $101,371,408 $454,580 $423,000 345 98% 22 208 $94,375,470 $453,728 $427,700 304 100% 23 1 1 1 2 4 5
- 6. Toronto Real Estate Board Market Watch, April 2016 SUMMARY OF EXISTING HOME TRANSACTIONS ALL HOME TYPES, YEAR-TO-DATE 2016 CITY OF TORONTO MUNICIPAL BREAKDOWN 6 Number of Sales Dollar Volume Average Price Median Price New Listings Avg. SP / LP Avg. DOM TREB Total City of Toronto Total Toronto West Toronto W01 Toronto W02 Toronto W03 Toronto W04 Toronto W05 Toronto W06 Toronto W07 Toronto W08 Toronto W09 Toronto W10 Toronto Central Toronto C01 Toronto C02 Toronto C03 Toronto C04 Toronto C06 Toronto C07 Toronto C08 Toronto C09 Toronto C10 Toronto C11 Toronto C12 Toronto C13 Toronto C14 Toronto C15 Toronto East Toronto E01 Toronto E02 Toronto E03 Toronto E04 Toronto E05 Toronto E06 Toronto E07 Toronto E08 Toronto E09 Toronto E10 Toronto E11 34,623 $24,155,747,801 $697,679 $578,900 51,199 102% 19 12,348 $8,874,290,016 $718,682 $551,500 19,855 103% 22 3,045 $1,876,087,019 $616,121 $555,000 4,784 102% 23 197 $148,028,847 $751,415 $615,000 289 104% 26 283 $231,055,212 $816,450 $750,000 393 106% 14 235 $139,688,405 $594,419 $590,000 336 103% 16 259 $150,501,014 $581,085 $575,000 438 102% 21 382 $171,318,596 $448,478 $450,050 612 100% 28 501 $268,173,828 $535,277 $475,000 887 101% 30 120 $112,245,226 $935,377 $831,500 183 104% 18 623 $450,551,854 $723,197 $540,500 969 101% 23 157 $86,537,514 $551,194 $621,000 247 102% 18 288 $117,986,523 $409,675 $436,500 430 100% 21 6,152 $5,051,146,897 $821,058 $510,000 10,693 102% 24 1,909 $1,010,947,314 $529,569 $433,500 3,636 100% 27 274 $325,074,545 $1,186,403 $905,400 566 101% 23 189 $240,428,225 $1,272,107 $848,000 315 102% 24 309 $503,170,319 $1,628,383 $1,550,000 467 105% 17 149 $112,986,900 $758,301 $485,000 184 105% 30 481 $382,448,478 $795,111 $490,000 793 103% 22 590 $298,914,922 $506,635 $435,500 1,040 99% 26 109 $184,060,955 $1,688,633 $1,506,500 202 100% 23 196 $169,009,552 $862,294 $616,500 354 106% 18 160 $117,416,761 $733,855 $394,500 227 107% 17 187 $419,301,264 $2,242,253 $1,950,000 327 98% 27 293 $291,815,472 $995,957 $675,000 447 109% 17 728 $585,657,743 $804,475 $459,950 1,162 101% 28 578 $409,914,447 $709,195 $473,500 973 105% 23 3,151 $1,947,056,100 $617,917 $616,000 4,378 105% 17 318 $256,141,245 $805,476 $756,730 428 108% 11 244 $214,864,277 $880,591 $750,500 315 107% 16 306 $233,199,051 $762,088 $753,000 385 109% 15 365 $188,045,125 $515,192 $588,000 510 105% 17 357 $216,527,570 $606,520 $520,000 513 107% 16 124 $89,763,960 $723,903 $668,000 171 104% 15 333 $173,085,996 $519,778 $455,000 495 104% 21 212 $121,192,655 $571,663 $613,000 284 103% 17 381 $173,782,294 $456,122 $402,000 559 103% 20 212 $137,250,067 $647,406 $630,000 324 103% 17 299 $143,203,860 $478,943 $470,000 394 103% 16 1 1 1 2 4 5
- 7. Toronto Real Estate Board Market Watch, April 2016 SUMMARY OF EXISTING HOME TRANSACTIONS DETACHED HOUSES, APRIL 2016 ALL TREB AREAS 7 Sales Dollar Volume Average Price Median Price New Listings Active Listings Avg. SP / LP Avg. DOM TREB Total Halton Region Burlington Halton Hills Milton Oakville Peel Region Brampton Caledon Mississauga City of Toronto Toronto West Toronto Central Toronto East York Region Aurora E. Gwillimbury Georgina King Markham Newmarket Richmond Hill Vaughan Whitchurch-Stouffville Durham Region Ajax Brock Clarington Oshawa Pickering Scugog Uxbridge Whitby Dufferin County Orangeville Simcoe County Adjala-Tosorontio Bradford West GwillimburyEssa Innisfil New Tecumseth 6,062 $5,870,662,621 $968,437 $800,000 7,805 5,089 104% 13 694 $667,282,641 $961,502 $842,550 857 683 101% 15 156 $129,280,154 $828,719 $750,000 184 158 100% 16 82 $55,102,350 $671,980 $632,500 115 106 99% 17 142 $108,768,155 $765,973 $735,500 185 139 101% 13 314 $374,131,982 $1,191,503 $1,052,450 373 280 102% 14 1,185 $943,490,538 $796,195 $726,000 1,577 1,026 101% 12 582 $384,128,746 $660,015 $643,750 795 441 101% 11 111 $83,859,790 $755,494 $726,000 151 163 100% 19 492 $475,502,002 $966,467 $837,750 631 422 102% 12 1,401 $1,762,398,657 $1,257,958 $970,000 1,869 1,137 107% 12 426 $402,323,780 $944,422 $800,000 602 418 105% 12 464 $920,198,702 $1,983,187 $1,730,000 613 398 107% 12 511 $439,876,175 $860,814 $780,000 654 321 108% 10 1,556 $1,807,399,761 $1,161,568 $1,060,000 1,976 1,206 105% 12 104 $120,170,690 $1,155,487 $1,014,000 117 60 105% 11 42 $32,090,300 $764,055 $687,450 47 59 101% 24 120 $65,866,265 $548,886 $507,500 162 112 101% 15 40 $51,337,290 $1,283,432 $1,245,000 63 80 96% 27 334 $455,538,091 $1,363,887 $1,269,000 447 231 108% 10 181 $152,328,325 $841,593 $800,000 193 83 103% 11 309 $436,444,912 $1,412,443 $1,260,000 397 210 106% 11 328 $390,855,389 $1,191,632 $1,073,000 433 281 104% 12 98 $102,768,499 $1,048,658 $850,000 117 90 99% 17 932 $535,761,058 $574,851 $550,100 1,159 689 104% 11 130 $84,028,118 $646,370 $612,500 158 62 105% 8 19 $7,975,400 $419,758 $365,000 36 55 97% 37 145 $71,700,394 $494,485 $475,100 177 118 103% 12 265 $124,014,870 $467,981 $440,000 323 149 105% 8 98 $75,695,141 $772,399 $712,450 135 83 102% 16 47 $25,652,800 $545,804 $476,500 67 57 99% 20 32 $25,559,980 $798,749 $728,500 35 56 99% 20 196 $121,134,355 $618,032 $593,500 228 109 105% 10 50 $24,541,251 $490,825 $468,250 52 38 100% 26 50 $24,541,251 $490,825 $468,250 52 38 100% 26 244 $129,788,715 $531,921 $496,600 315 310 99% 21 16 $10,351,400 $646,963 $576,950 22 40 98% 33 54 $37,041,168 $685,948 $660,000 64 52 100% 25 37 $16,740,200 $452,438 $429,900 43 42 99% 24 79 $37,663,747 $476,756 $437,000 109 115 98% 19 58 $27,992,200 $482,624 $469,500 77 61 101% 15 1 2 3 4 51 1 1
- 8. Toronto Real Estate Board Market Watch, April 2016 SUMMARY OF EXISTING HOME TRANSACTIONS DETACHED HOUSES, APRIL 2016 CITY OF TORONTO MUNICIPAL BREAKDOWN 8 Sales Dollar Volume Average Price Median Price New Listings Active Listings Avg. SP / LP Avg. DOM TREB Total City of Toronto Total Toronto West Toronto W01 Toronto W02 Toronto W03 Toronto W04 Toronto W05 Toronto W06 Toronto W07 Toronto W08 Toronto W09 Toronto W10 Toronto Central Toronto C01 Toronto C02 Toronto C03 Toronto C04 Toronto C06 Toronto C07 Toronto C08 Toronto C09 Toronto C10 Toronto C11 Toronto C12 Toronto C13 Toronto C14 Toronto C15 Toronto East Toronto E01 Toronto E02 Toronto E03 Toronto E04 Toronto E05 Toronto E06 Toronto E07 Toronto E08 Toronto E09 Toronto E10 Toronto E11 6,062 $5,870,662,621 $968,437 $800,000 7,805 5,089 104% 13 1,401 $1,762,398,657 $1,257,958 $970,000 1,869 1,137 107% 12 426 $402,323,780 $944,422 $800,000 602 418 105% 12 12 $16,865,300 $1,405,442 $1,355,000 21 18 108% 11 43 $57,266,527 $1,331,780 $1,215,000 45 24 110% 8 57 $38,013,539 $666,904 $645,000 80 45 107% 12 49 $38,560,617 $786,951 $730,000 74 65 105% 11 27 $20,232,001 $749,333 $730,000 47 37 102% 15 48 $38,200,329 $795,840 $740,500 60 33 108% 10 27 $30,030,282 $1,112,233 $1,000,000 40 24 105% 16 97 $116,789,221 $1,204,013 $1,020,000 133 115 102% 16 26 $21,826,444 $839,479 $813,472 42 28 107% 8 40 $24,539,520 $613,488 $595,000 60 29 101% 13 464 $920,198,702 $1,983,187 $1,730,000 613 398 107% 12 10 $15,280,852 $1,528,085 $1,452,500 23 12 110% 23 11 $17,381,990 $1,580,181 $1,450,000 22 20 106% 10 30 $52,853,600 $1,761,787 $1,745,000 49 36 105% 8 88 $178,916,316 $2,033,140 $1,727,500 100 56 106% 13 24 $31,650,000 $1,318,750 $1,197,500 28 14 110% 9 59 $97,811,477 $1,657,822 $1,530,789 68 30 109% 10 3 $4,810,000 $1,603,333 $1,525,000 3 2 97% 25 15 $44,976,014 $2,998,401 $3,100,000 23 30 102% 18 18 $33,558,001 $1,864,333 $1,620,000 23 16 110% 10 16 $24,685,875 $1,542,867 $1,434,050 16 14 117% 7 45 $141,356,000 $3,141,244 $3,200,000 69 64 100% 18 41 $78,976,890 $1,926,266 $1,608,000 51 21 115% 10 62 $123,760,499 $1,996,137 $1,885,000 78 47 105% 17 42 $74,181,188 $1,766,219 $1,535,694 60 36 112% 7 511 $439,876,175 $860,814 $780,000 654 321 108% 10 27 $31,437,265 $1,164,343 $1,125,000 30 15 111% 8 28 $37,337,298 $1,333,475 $1,222,625 40 15 105% 14 63 $59,699,496 $947,611 $855,000 66 24 112% 10 65 $46,662,860 $717,890 $695,000 78 42 109% 11 57 $56,494,776 $991,136 $988,000 77 34 112% 9 39 $29,904,488 $766,782 $717,000 43 17 106% 10 36 $31,474,088 $874,280 $854,450 47 31 109% 10 48 $38,906,900 $810,560 $717,700 56 25 105% 10 59 $39,198,318 $664,378 $665,000 84 42 107% 10 46 $37,771,777 $821,126 $760,000 79 50 104% 11 43 $30,988,909 $720,672 $710,000 54 26 106% 10 1 1 1 1 2 3 4 5
- 9. Toronto Real Estate Board Market Watch, April 2016 SUMMARY OF EXISTING HOME TRANSACTIONS SEMI-DETACHED HOUSES, APRIL 2016 ALL TREB AREAS 9 Sales Dollar Volume Average Price Median Price New Listings Active Listings Avg. SP / LP Avg. DOM TREB Total Halton Region Burlington Halton Hills Milton Oakville Peel Region Brampton Caledon Mississauga City of Toronto Toronto West Toronto Central Toronto East York Region Aurora E. Gwillimbury Georgina King Markham Newmarket Richmond Hill Vaughan Whitchurch-Stouffville Durham Region Ajax Brock Clarington Oshawa Pickering Scugog Uxbridge Whitby Dufferin County Orangeville Simcoe County Adjala-Tosorontio Bradford West GwillimburyEssa Innisfil New Tecumseth 1,137 $772,725,148 $679,618 $610,000 1,376 546 107% 9 70 $41,859,245 $597,989 $587,560 75 25 103% 7 16 $9,527,900 $595,494 $568,500 12 3 101% 10 3 $1,267,000 $422,333 $415,000 4 1 101% 10 34 $19,427,645 $571,401 $573,750 38 14 103% 6 17 $11,636,700 $684,512 $688,000 21 7 106% 5 423 $233,568,941 $552,172 $547,000 495 177 103% 9 235 $119,116,678 $506,879 $505,000 260 89 102% 9 8 $4,535,000 $566,875 $577,500 10 5 102% 6 180 $109,917,263 $610,651 $602,500 225 83 103% 9 371 $334,329,911 $901,159 $785,800 492 231 110% 10 103 $74,387,669 $722,210 $653,000 142 88 108% 15 126 $147,347,629 $1,169,426 $975,640 157 68 110% 9 142 $112,594,613 $792,920 $740,000 193 75 113% 7 175 $124,579,325 $711,882 $705,000 208 78 107% 8 8 $4,970,600 $621,325 $595,050 15 7 108% 5 2 $1,300,500 $650,250 $650,250 0 0 109% 8 2 $922,900 $461,450 $461,450 3 1 100% 15 0 - - - 0 0 - - 48 $37,899,346 $789,570 $754,000 58 24 109% 8 29 $17,418,360 $600,633 $610,000 31 12 106% 9 14 $10,434,800 $745,343 $737,000 26 14 105% 10 62 $45,345,206 $731,374 $722,500 63 15 107% 7 10 $6,287,613 $628,761 $624,000 12 5 106% 7 74 $30,344,951 $410,067 $388,950 87 30 109% 6 13 $6,439,250 $495,327 $515,000 21 9 108% 5 1 $194,500 $194,500 $194,500 0 0 97% 40 8 $2,855,101 $356,888 $361,300 11 4 106% 5 33 $11,181,300 $338,827 $355,000 41 13 111% 6 14 $7,327,300 $523,379 $515,500 8 2 108% 7 0 - - - 1 1 - - 0 - - - 0 1 - - 5 $2,347,500 $469,500 $425,000 5 0 109% 6 14 $4,726,775 $337,627 $337,750 9 1 101% 14 14 $4,726,775 $337,627 $337,750 9 1 101% 14 10 $3,316,000 $331,600 $320,000 10 4 98% 25 1 $255,000 $255,000 $255,000 1 0 102% 13 3 $1,280,000 $426,667 $470,000 6 3 97% 35 2 $450,000 $225,000 $225,000 2 0 100% 10 0 - - - 0 0 - - 4 $1,331,000 $332,750 $338,500 1 1 99% 29 1 1 1 1 2 3 4 5
- 10. Toronto Real Estate Board Market Watch, April 2016 SUMMARY OF EXISTING HOME TRANSACTIONS SEMI-DETACHED HOUSES, APRIL 2016 CITY OF TORONTO MUNICIPAL BREAKDOWN 10 Sales Dollar Volume Average Price Median Price New Listings Active Listings Avg. SP / LP Avg. DOM TREB Total City of Toronto Total Toronto West Toronto W01 Toronto W02 Toronto W03 Toronto W04 Toronto W05 Toronto W06 Toronto W07 Toronto W08 Toronto W09 Toronto W10 Toronto Central Toronto C01 Toronto C02 Toronto C03 Toronto C04 Toronto C06 Toronto C07 Toronto C08 Toronto C09 Toronto C10 Toronto C11 Toronto C12 Toronto C13 Toronto C14 Toronto C15 Toronto East Toronto E01 Toronto E02 Toronto E03 Toronto E04 Toronto E05 Toronto E06 Toronto E07 Toronto E08 Toronto E09 Toronto E10 Toronto E11 1,137 $772,725,148 $679,618 $610,000 1,376 546 107% 9 371 $334,329,911 $901,159 $785,800 492 231 110% 10 103 $74,387,669 $722,210 $653,000 142 88 108% 15 10 $9,294,000 $929,400 $915,500 12 6 108% 23 26 $22,964,500 $883,250 $889,500 32 13 114% 6 21 $14,003,669 $666,841 $691,500 31 26 108% 20 8 $5,217,000 $652,125 $615,000 9 5 104% 17 27 $15,982,300 $591,937 $570,000 42 31 103% 18 5 $3,417,700 $683,540 $635,000 7 3 103% 11 1 $576,000 $576,000 $576,000 1 0 116% 7 2 $1,332,500 $666,250 $666,250 4 2 114% 9 1 $508,000 $508,000 $508,000 1 2 102% 13 2 $1,092,000 $546,000 $546,000 3 0 98% 17 126 $147,347,629 $1,169,426 $975,640 157 68 110% 9 24 $27,927,700 $1,163,654 $1,149,000 39 18 110% 10 19 $34,945,700 $1,839,247 $1,410,000 21 10 104% 11 8 $6,486,617 $810,827 $738,000 15 9 118% 7 7 $9,037,500 $1,291,071 $1,275,000 8 2 120% 6 0 - - - 0 0 - - 8 $6,234,500 $779,313 $745,000 10 4 106% 9 6 $6,646,071 $1,107,679 $1,100,000 9 6 99% 27 7 $13,987,000 $1,998,143 $1,665,000 7 1 106% 5 10 $12,561,333 $1,256,133 $1,285,000 9 2 124% 8 6 $6,331,208 $1,055,201 $1,068,000 4 0 117% 4 1 $818,000 $818,000 $818,000 1 0 114% 6 7 $4,620,000 $660,000 $650,000 5 4 108% 12 0 - - - 1 1 - - 23 $17,752,000 $771,826 $780,500 28 11 111% 6 142 $112,594,613 $792,920 $740,000 193 75 113% 7 39 $33,923,364 $869,830 $828,000 44 14 115% 6 33 $30,025,573 $909,866 $811,000 44 16 115% 6 30 $24,279,788 $809,326 $761,000 28 7 116% 6 8 $5,213,900 $651,738 $629,000 20 7 105% 9 5 $3,533,888 $706,778 $690,000 16 10 105% 8 0 - - - 2 2 - - 7 $4,811,000 $687,286 $688,000 13 8 109% 10 2 $1,075,000 $537,500 $537,500 2 1 99% 26 6 $3,245,000 $540,833 $542,500 7 2 104% 8 2 $1,160,100 $580,050 $580,050 4 2 105% 8 10 $5,327,000 $532,700 $518,000 13 6 105% 10 1 1 1 1 2 3 4 5
- 11. Toronto Real Estate Board Market Watch, April 2016 SUMMARY OF EXISTING HOME TRANSACTIONS CONDOMINIUM TOWNHOUSES, APRIL 2016 ALL TREB AREAS 11 Sales Dollar Volume Average Price Median Price New Listings Active Listings Avg. SP / LP Avg. DOM TREB Total Halton Region Burlington Halton Hills Milton Oakville Peel Region Brampton Caledon Mississauga City of Toronto Toronto West Toronto Central Toronto East York Region Aurora E. Gwillimbury Georgina King Markham Newmarket Richmond Hill Vaughan Whitchurch-Stouffville Durham Region Ajax Brock Clarington Oshawa Pickering Scugog Uxbridge Whitby Dufferin County Orangeville Simcoe County Adjala-Tosorontio Bradford West GwillimburyEssa Innisfil New Tecumseth 862 $408,023,866 $473,346 $434,400 1,055 724 103% 15 79 $34,284,850 $433,985 $410,000 94 73 101% 15 32 $13,244,600 $413,894 $404,500 38 26 100% 17 12 $4,071,250 $339,271 $357,500 9 2 101% 10 4 $1,560,000 $390,000 $397,500 5 5 105% 6 31 $15,409,000 $497,065 $459,000 42 40 100% 17 295 $121,821,133 $412,953 $410,000 349 227 102% 14 72 $25,070,697 $348,204 $335,000 109 83 101% 14 0 - - - 1 1 - - 223 $96,750,436 $433,858 $430,000 239 143 102% 14 310 $169,649,507 $547,256 $488,000 399 297 104% 16 83 $35,918,526 $432,753 $420,000 100 80 101% 22 121 $84,290,926 $696,619 $570,000 159 134 103% 16 106 $49,440,055 $466,416 $453,000 140 83 105% 12 101 $58,175,075 $575,991 $555,000 119 74 103% 13 8 $4,568,000 $571,000 $493,750 12 6 102% 12 0 - - - 0 0 - - 0 - - - 0 0 - - 0 - - - 1 1 - - 42 $24,792,175 $590,290 $589,400 48 29 104% 11 14 $6,629,400 $473,529 $424,500 15 8 105% 10 15 $9,180,500 $612,033 $584,000 22 15 101% 12 21 $12,654,000 $602,571 $573,000 19 14 101% 18 1 $351,000 $351,000 $351,000 2 1 100% 14 72 $22,671,301 $314,879 $327,500 86 49 105% 11 13 $4,992,500 $384,038 $362,500 16 10 106% 11 0 - - - 2 5 - - 4 $1,006,400 $251,600 $244,000 4 1 108% 11 24 $5,578,600 $232,442 $222,700 27 11 106% 10 15 $5,512,400 $367,493 $350,000 18 11 103% 11 0 - - - 0 2 - - 2 $824,900 $412,450 $412,450 2 4 99% 8 14 $4,756,501 $339,750 $335,050 17 5 107% 11 4 $1,071,000 $267,750 $269,000 6 3 104% 8 4 $1,071,000 $267,750 $269,000 6 3 104% 8 1 $351,000 $351,000 $351,000 2 1 110% 5 0 - - - 0 0 - - 1 $351,000 $351,000 $351,000 1 0 110% 5 0 - - - 0 0 - - 0 - - - 0 0 - - 0 - - - 1 1 - - 1 1 1 1 2 3 4 5
- 12. Toronto Real Estate Board Market Watch, April 2016 SUMMARY OF EXISTING HOME TRANSACTIONS CONDOMINIUM TOWNHOUSES, APRIL 2016 CITY OF TORONTO MUNICIPAL BREAKDOWN 12 Sales Dollar Volume Average Price Median Price New Listings Active Listings Avg. SP / LP Avg. DOM TREB Total City of Toronto Total Toronto West Toronto W01 Toronto W02 Toronto W03 Toronto W04 Toronto W05 Toronto W06 Toronto W07 Toronto W08 Toronto W09 Toronto W10 Toronto Central Toronto C01 Toronto C02 Toronto C03 Toronto C04 Toronto C06 Toronto C07 Toronto C08 Toronto C09 Toronto C10 Toronto C11 Toronto C12 Toronto C13 Toronto C14 Toronto C15 Toronto East Toronto E01 Toronto E02 Toronto E03 Toronto E04 Toronto E05 Toronto E06 Toronto E07 Toronto E08 Toronto E09 Toronto E10 Toronto E11 862 $408,023,866 $473,346 $434,400 1,055 724 103% 15 310 $169,649,507 $547,256 $488,000 399 297 104% 16 83 $35,918,526 $432,753 $420,000 100 80 101% 22 10 $4,830,000 $483,000 $442,500 5 1 100% 15 8 $4,476,000 $559,500 $569,250 11 7 108% 7 2 $1,162,000 $581,000 $581,000 3 1 105% 6 2 $802,000 $401,000 $401,000 6 6 101% 13 30 $9,812,376 $327,079 $326,444 38 30 100% 24 13 $7,396,500 $568,962 $596,000 10 10 99% 48 0 - - - 0 0 - - 10 $4,875,750 $487,575 $535,000 9 3 104% 9 1 $510,000 $510,000 $510,000 8 8 105% 1 7 $2,053,900 $293,414 $351,000 10 14 98% 24 121 $84,290,926 $696,619 $570,000 159 134 103% 16 25 $16,137,088 $645,484 $587,000 33 34 105% 13 8 $10,597,000 $1,324,625 $1,259,500 12 8 104% 15 1 $950,000 $950,000 $950,000 3 4 106% 10 0 - - - 3 5 - - 1 $469,800 $469,800 $469,800 0 1 99% 50 11 $7,002,500 $636,591 $525,000 15 22 109% 11 3 $2,003,500 $667,833 $545,000 4 4 100% 7 2 $2,948,000 $1,474,000 $1,474,000 2 2 96% 43 1 $998,000 $998,000 $998,000 3 1 100% 14 2 $802,000 $401,000 $401,000 4 3 109% 5 11 $11,267,200 $1,024,291 $925,000 10 13 97% 26 2 $1,278,000 $639,000 $639,000 2 2 103% 29 15 $8,545,300 $569,687 $516,500 22 11 105% 15 39 $21,292,538 $545,963 $508,000 46 24 104% 17 106 $49,440,055 $466,416 $453,000 140 83 105% 12 14 $9,515,805 $679,700 $669,200 9 6 103% 10 5 $3,594,177 $718,835 $558,000 2 4 102% 19 2 $694,000 $347,000 $347,000 1 1 99% 16 13 $5,397,000 $415,154 $451,000 13 5 106% 7 28 $13,384,577 $478,021 $484,500 41 23 108% 10 0 - - - 0 0 - - 8 $3,559,518 $444,940 $437,400 18 7 104% 12 9 $3,241,000 $360,111 $380,000 8 3 109% 5 6 $1,717,888 $286,315 $243,750 10 8 100% 18 8 $3,026,990 $378,374 $388,500 11 11 100% 34 13 $5,309,100 $408,392 $420,000 27 15 113% 9 1 1 1 1 2 3 4 5
- 13. Toronto Real Estate Board Market Watch, April 2016 SUMMARY OF EXISTING HOME TRANSACTIONS CONDOMINIUM APARTMENT, APRIL 2016 ALL TREB AREAS 13 Sales Dollar Volume Average Price Median Price New Listings Active Listings Avg. SP / LP Avg. DOM TREB Total Halton Region Burlington Halton Hills Milton Oakville Peel Region Brampton Caledon Mississauga City of Toronto Toronto West Toronto Central Toronto East York Region Aurora E. Gwillimbury Georgina King Markham Newmarket Richmond Hill Vaughan Whitchurch-Stouffville Durham Region Ajax Brock Clarington Oshawa Pickering Scugog Uxbridge Whitby Dufferin County Orangeville Simcoe County Adjala-Tosorontio Bradford West GwillimburyEssa Innisfil New Tecumseth 2,809 $1,150,652,385 $409,631 $355,000 4,541 5,514 99% 25 96 $39,782,840 $414,405 $342,250 148 192 98% 31 40 $13,962,900 $349,073 $284,500 45 60 99% 24 2 $639,000 $319,500 $319,500 0 1 97% 41 13 $4,209,540 $323,811 $342,000 13 10 99% 30 41 $20,971,400 $511,498 $436,000 90 121 97% 37 339 $98,792,182 $291,422 $277,000 563 661 98% 25 72 $18,105,127 $251,460 $236,500 102 103 99% 22 0 - - - 2 2 - - 267 $80,687,055 $302,199 $285,000 459 556 98% 26 1,997 $871,780,322 $436,545 $379,900 3,189 3,880 99% 25 375 $130,294,629 $347,452 $317,500 573 767 99% 26 1,365 $661,318,326 $484,482 $415,000 2,281 2,765 99% 25 257 $80,167,367 $311,935 $285,000 335 348 99% 21 310 $121,048,415 $390,479 $363,200 564 725 98% 29 8 $3,359,390 $419,924 $394,750 2 7 100% 36 1 $251,000 $251,000 $251,000 0 0 98% 19 1 $172,500 $172,500 $172,500 3 3 96% 20 9 $3,635,400 $403,933 $329,000 8 13 96% 42 104 $40,876,303 $393,041 $364,500 234 307 98% 32 8 $2,843,000 $355,375 $352,500 9 5 106% 9 79 $27,911,500 $353,310 $335,000 137 158 98% 29 100 $41,999,322 $419,993 $397,000 170 226 98% 26 0 - - - 1 6 - - 59 $17,107,126 $289,951 $276,000 69 45 101% 19 13 $3,347,400 $257,492 $267,000 17 9 100% 13 0 - - - 0 0 - - 8 $2,175,500 $271,938 $253,500 7 11 105% 11 5 $962,326 $192,465 $205,000 7 5 105% 12 23 $7,275,900 $316,343 $305,000 23 12 99% 26 0 - - - 1 1 - - 0 - - - 0 0 - - 10 $3,346,000 $334,600 $308,000 14 7 102% 20 1 $230,000 $230,000 $230,000 1 0 98% 14 1 $230,000 $230,000 $230,000 1 0 98% 14 7 $1,911,500 $273,071 $256,000 7 11 97% 77 0 - - - 0 0 - - 2 $490,000 $245,000 $245,000 0 0 98% 69 0 - - - 0 0 - - 0 - - - 0 1 - - 5 $1,421,500 $284,300 $305,000 7 10 97% 80 1 1 1 1 2 3 4 5
- 14. Toronto Real Estate Board Market Watch, April 2016 SUMMARY OF EXISTING HOME TRANSACTIONS CONDOMINIUM APARTMENT, APRIL 2016 CITY OF TORONTO MUNICIPAL BREAKDOWN 14 Sales Dollar Volume Average Price Median Price New Listings Active Listings Avg. SP / LP Avg. DOM TREB Total City of Toronto Total Toronto West Toronto W01 Toronto W02 Toronto W03 Toronto W04 Toronto W05 Toronto W06 Toronto W07 Toronto W08 Toronto W09 Toronto W10 Toronto Central Toronto C01 Toronto C02 Toronto C03 Toronto C04 Toronto C06 Toronto C07 Toronto C08 Toronto C09 Toronto C10 Toronto C11 Toronto C12 Toronto C13 Toronto C14 Toronto C15 Toronto East Toronto E01 Toronto E02 Toronto E03 Toronto E04 Toronto E05 Toronto E06 Toronto E07 Toronto E08 Toronto E09 Toronto E10 Toronto E11 2,809 $1,150,652,385 $409,631 $355,000 4,541 5,514 99% 25 1,997 $871,780,322 $436,545 $379,900 3,189 3,880 99% 25 375 $130,294,629 $347,452 $317,500 573 767 99% 26 26 $11,396,000 $438,308 $421,500 41 52 98% 29 15 $6,336,500 $422,433 $408,000 24 28 99% 27 12 $4,444,500 $370,375 $403,750 16 9 102% 8 19 $4,817,834 $253,570 $222,500 43 55 99% 24 36 $9,134,000 $253,722 $270,000 65 100 98% 27 92 $37,577,501 $408,451 $353,250 162 252 98% 31 10 $5,136,750 $513,675 $493,750 12 10 100% 16 105 $38,258,471 $364,366 $325,000 131 161 99% 26 19 $4,048,573 $213,083 $161,000 26 34 98% 27 41 $9,144,500 $223,037 $240,000 53 66 99% 20 1,365 $661,318,326 $484,482 $415,000 2,281 2,765 99% 25 572 $279,009,280 $487,778 $420,000 980 1,239 99% 25 52 $39,260,054 $755,001 $685,000 106 156 99% 30 16 $9,167,400 $572,963 $559,250 21 37 100% 41 18 $10,787,418 $599,301 $525,000 32 34 102% 32 22 $8,620,600 $391,845 $377,500 24 31 98% 28 86 $37,009,900 $430,348 $405,050 141 178 99% 25 192 $88,476,869 $460,817 $418,000 310 322 99% 20 17 $21,716,770 $1,277,457 $708,000 31 39 95% 24 42 $24,394,810 $580,829 $510,000 76 76 99% 18 31 $9,390,090 $302,906 $295,000 41 32 99% 16 10 $9,657,616 $965,762 $757,500 16 28 98% 19 45 $17,000,100 $377,780 $349,900 70 78 100% 16 173 $74,344,744 $429,738 $397,000 261 279 98% 27 89 $32,482,675 $364,974 $327,000 172 236 97% 31 257 $80,167,367 $311,935 $285,000 335 348 99% 21 18 $8,311,200 $461,733 $434,400 24 16 100% 12 9 $4,609,400 $512,156 $541,000 13 17 102% 19 10 $3,085,000 $308,500 $230,750 10 12 98% 35 33 $8,519,699 $258,173 $253,000 43 44 100% 21 44 $15,574,388 $353,963 $326,400 46 47 99% 21 8 $3,528,100 $441,013 $451,650 10 6 102% 16 43 $12,864,600 $299,177 $290,000 62 74 99% 26 17 $4,095,000 $240,882 $194,000 21 20 98% 21 52 $14,977,980 $288,038 $278,500 82 87 98% 22 3 $413,000 $137,667 $150,000 3 9 102% 12 20 $4,189,000 $209,450 $209,000 21 16 98% 23 1 1 1 1 2 3 4 5
- 15. Toronto Real Estate Board Market Watch, April 2016 SUMMARY OF EXISTING HOME TRANSACTIONS LINK, APRIL 2016 ALL TREB AREAS 15 Sales Dollar Volume Average Price Median Price New Listings Active Listings Avg. SP / LP Avg. DOM TREB Total Halton Region Burlington Halton Hills Milton Oakville Peel Region Brampton Caledon Mississauga City of Toronto Toronto West Toronto Central Toronto East York Region Aurora E. Gwillimbury Georgina King Markham Newmarket Richmond Hill Vaughan Whitchurch-Stouffville Durham Region Ajax Brock Clarington Oshawa Pickering Scugog Uxbridge Whitby Dufferin County Orangeville Simcoe County Adjala-Tosorontio Bradford West GwillimburyEssa Innisfil New Tecumseth 205 $134,946,253 $658,274 $641,000 264 107 107% 8 26 $15,974,000 $614,385 $607,500 26 9 105% 7 9 $4,828,500 $536,500 $532,000 10 4 103% 9 1 $371,000 $371,000 $371,000 0 0 106% 6 3 $1,687,000 $562,333 $592,000 7 5 99% 8 13 $9,087,500 $699,038 $665,000 9 0 106% 7 20 $11,821,300 $591,065 $571,000 26 12 103% 8 7 $3,687,500 $526,786 $515,000 11 7 100% 9 2 $1,120,000 $560,000 $560,000 3 1 108% 6 11 $7,013,800 $637,618 $620,000 12 4 103% 7 13 $9,107,988 $700,614 $690,000 22 12 107% 10 1 $625,500 $625,500 $625,500 0 0 116% 6 2 $1,725,000 $862,500 $862,500 3 1 116% 2 10 $6,757,488 $675,749 $679,500 19 11 105% 12 87 $71,766,500 $824,902 $839,800 118 47 109% 8 1 $778,000 $778,000 $778,000 2 1 111% 6 0 - - - 0 0 - - 0 - - - 0 1 - - 1 $790,000 $790,000 $790,000 0 0 101% 14 57 $48,644,500 $853,412 $855,000 85 34 110% 7 2 $1,025,000 $512,500 $512,500 1 1 99% 16 11 $9,104,000 $827,636 $799,000 10 4 107% 11 14 $10,790,000 $770,714 $782,500 20 6 108% 6 1 $635,000 $635,000 $635,000 0 0 97% 21 45 $20,424,966 $453,888 $440,000 48 13 107% 7 4 $2,020,500 $505,125 $510,000 4 2 117% 5 0 - - - 0 0 - - 21 $8,553,066 $407,289 $399,900 23 7 104% 6 4 $1,529,900 $382,475 $374,950 3 1 106% 14 2 $1,017,000 $508,500 $508,500 2 1 109% 9 1 $495,000 $495,000 $495,000 1 0 103% 7 2 $1,038,000 $519,000 $519,000 3 1 105% 5 11 $5,771,500 $524,682 $530,100 12 1 109% 6 0 - - - 0 0 - - 0 - - - 0 0 - - 14 $5,851,499 $417,964 $389,550 24 14 102% 8 0 - - - 0 0 - - 5 $2,533,999 $506,800 $499,999 6 2 103% 7 4 $1,425,400 $356,350 $337,700 12 10 99% 9 1 $360,000 $360,000 $360,000 3 2 100% 14 4 $1,532,100 $383,025 $384,500 3 0 104% 7 1 1 1 1 2 3 4 5
- 16. Toronto Real Estate Board Market Watch, April 2016 SUMMARY OF EXISTING HOME TRANSACTIONS LINK, APRIL 2016 CITY OF TORONTO MUNICIPAL BREAKDOWN 16 Sales Dollar Volume Average Price Median Price New Listings Active Listings Avg. SP / LP Avg. DOM TREB Total City of Toronto Total Toronto West Toronto W01 Toronto W02 Toronto W03 Toronto W04 Toronto W05 Toronto W06 Toronto W07 Toronto W08 Toronto W09 Toronto W10 Toronto Central Toronto C01 Toronto C02 Toronto C03 Toronto C04 Toronto C06 Toronto C07 Toronto C08 Toronto C09 Toronto C10 Toronto C11 Toronto C12 Toronto C13 Toronto C14 Toronto C15 Toronto East Toronto E01 Toronto E02 Toronto E03 Toronto E04 Toronto E05 Toronto E06 Toronto E07 Toronto E08 Toronto E09 Toronto E10 Toronto E11 205 $134,946,253 $658,274 $641,000 264 107 107% 8 13 $9,107,988 $700,614 $690,000 22 12 107% 10 1 $625,500 $625,500 $625,500 0 0 116% 6 0 - - - 0 0 - - 0 - - - 0 0 - - 0 - - - 0 0 - - 0 - - - 0 0 - - 1 $625,500 $625,500 $625,500 0 0 116% 6 0 - - - 0 0 - - 0 - - - 0 0 - - 0 - - - 0 0 - - 0 - - - 0 0 - - 0 - - - 0 0 - - 2 $1,725,000 $862,500 $862,500 3 1 116% 2 0 - - - 0 0 - - 0 - - - 0 0 - - 0 - - - 0 0 - - 0 - - - 0 0 - - 0 - - - 0 0 - - 0 - - - 1 1 - - 0 - - - 0 0 - - 0 - - - 0 0 - - 0 - - - 0 0 - - 0 - - - 0 0 - - 0 - - - 0 0 - - 0 - - - 0 0 - - 0 - - - 0 0 - - 2 $1,725,000 $862,500 $862,500 2 0 116% 2 10 $6,757,488 $675,749 $679,500 19 11 105% 12 0 - - - 0 0 - - 0 - - - 0 0 - - 0 - - - 0 0 - - 0 - - - 0 0 - - 1 $756,800 $756,800 $756,800 5 4 120% 8 0 - - - 0 0 - - 8 $5,425,688 $678,211 $679,500 11 4 102% 14 0 - - - 0 1 - - 0 - - - 0 0 - - 0 - - - 0 0 - - 1 $575,000 $575,000 $575,000 3 2 120% 7 1 1 1 1 2 3 4 5
- 17. Toronto Real Estate Board Market Watch, April 2016 SUMMARY OF EXISTING HOME TRANSACTIONS ATTACHED/ROW/TOWNHOUSE, APRIL 2016 ALL TREB AREAS 17 Sales Dollar Volume Average Price Median Price New Listings Active Listings Avg. SP / LP Avg. DOM TREB Total Halton Region Burlington Halton Hills Milton Oakville Peel Region Brampton Caledon Mississauga City of Toronto Toronto West Toronto Central Toronto East York Region Aurora E. Gwillimbury Georgina King Markham Newmarket Richmond Hill Vaughan Whitchurch-Stouffville Durham Region Ajax Brock Clarington Oshawa Pickering Scugog Uxbridge Whitby Dufferin County Orangeville Simcoe County Adjala-Tosorontio Bradford West GwillimburyEssa Innisfil New Tecumseth 980 $582,924,636 $594,821 $555,550 1,173 519 105% 9 182 $104,265,088 $572,885 $533,250 201 88 102% 9 18 $9,417,900 $523,217 $510,000 23 10 102% 11 11 $5,363,000 $487,545 $490,000 9 2 100% 11 83 $41,379,200 $498,545 $499,900 77 25 103% 7 70 $48,104,988 $687,214 $655,500 92 51 102% 11 192 $95,730,595 $498,597 $485,500 222 84 103% 9 145 $68,052,666 $469,329 $475,000 161 58 102% 10 9 $4,563,000 $507,000 $515,000 9 3 102% 9 38 $23,114,929 $608,288 $610,000 52 23 105% 9 130 $99,586,185 $766,048 $710,500 162 84 106% 9 36 $25,514,688 $708,741 $737,500 43 25 103% 11 34 $37,641,724 $1,107,110 $960,500 51 29 107% 10 60 $36,429,773 $607,163 $619,000 68 30 108% 7 298 $208,221,972 $698,731 $686,500 382 182 107% 9 19 $12,473,222 $656,485 $650,000 25 11 108% 7 5 $2,825,400 $565,080 $559,000 6 6 103% 18 15 $6,518,244 $434,550 $428,434 16 11 103% 22 3 $2,607,000 $869,000 $907,000 7 7 106% 6 73 $52,481,190 $718,920 $700,000 91 42 108% 8 24 $14,213,500 $592,229 $585,000 28 12 106% 8 70 $55,146,580 $787,808 $791,250 107 55 107% 8 75 $54,065,536 $720,874 $700,786 80 29 106% 8 14 $7,891,300 $563,664 $560,000 22 9 106% 7 140 $61,393,096 $438,522 $437,000 154 52 108% 6 35 $16,856,600 $481,617 $480,000 37 12 108% 5 0 - - - 0 0 - - 37 $13,435,250 $363,115 $350,000 35 8 108% 6 13 $5,401,745 $415,519 $427,000 19 8 110% 5 17 $8,702,101 $511,888 $524,000 17 6 105% 6 0 - - - 0 0 - - 1 $366,000 $366,000 $366,000 1 1 105% 5 37 $16,631,400 $449,497 $456,000 45 17 108% 6 4 $1,473,000 $368,250 $382,750 5 2 103% 9 4 $1,473,000 $368,250 $382,750 5 2 103% 9 34 $12,254,700 $360,432 $342,500 47 27 100% 10 0 - - - 0 0 - - 8 $3,797,400 $474,675 $484,950 6 0 100% 9 10 $3,051,300 $305,130 $306,500 19 13 100% 9 9 $2,938,000 $326,444 $320,000 6 2 99% 13 7 $2,468,000 $352,571 $345,000 16 12 100% 7 1 1 1 1 2 3 4 5
- 18. Toronto Real Estate Board Market Watch, April 2016 SUMMARY OF EXISTING HOME TRANSACTIONS ATTACHED/ROW/TOWNHOUSE, APRIL 2016 CITY OF TORONTO MUNICIPAL BREAKDOWN 18 Sales Dollar Volume Average Price Median Price New Listings Active Listings Avg. SP / LP Avg. DOM TREB Total City of Toronto Total Toronto West Toronto W01 Toronto W02 Toronto W03 Toronto W04 Toronto W05 Toronto W06 Toronto W07 Toronto W08 Toronto W09 Toronto W10 Toronto Central Toronto C01 Toronto C02 Toronto C03 Toronto C04 Toronto C06 Toronto C07 Toronto C08 Toronto C09 Toronto C10 Toronto C11 Toronto C12 Toronto C13 Toronto C14 Toronto C15 Toronto East Toronto E01 Toronto E02 Toronto E03 Toronto E04 Toronto E05 Toronto E06 Toronto E07 Toronto E08 Toronto E09 Toronto E10 Toronto E11 980 $582,924,636 $594,821 $555,550 1,173 519 105% 9 130 $99,586,185 $766,048 $710,500 162 84 106% 9 36 $25,514,688 $708,741 $737,500 43 25 103% 11 1 $750,000 $750,000 $750,000 4 5 117% 7 5 $3,625,450 $725,090 $750,000 5 2 111% 5 1 $735,000 $735,000 $735,000 1 1 98% 12 3 $1,769,900 $589,967 $580,000 2 0 97% 12 5 $2,618,000 $523,600 $509,000 6 4 100% 20 9 $6,894,400 $766,044 $799,000 11 5 103% 13 4 $2,883,938 $720,985 $720,025 6 3 102% 5 7 $5,783,000 $826,143 $780,000 5 3 101% 10 0 - - - 3 2 - - 1 $455,000 $455,000 $455,000 0 0 104% 3 34 $37,641,724 $1,107,110 $960,500 51 29 107% 10 10 $10,902,024 $1,090,202 $1,059,500 19 14 110% 8 5 $7,090,000 $1,418,000 $1,430,000 3 2 107% 16 1 $1,270,000 $1,270,000 $1,270,000 0 0 98% 53 1 $1,875,000 $1,875,000 $1,875,000 3 2 99% 6 0 - - - 0 0 - - 0 - - - 1 1 - - 5 $4,533,900 $906,780 $870,000 9 5 105% 4 0 - - - 0 0 - - 0 - - - 0 0 - - 1 $1,330,000 $1,330,000 $1,330,000 2 1 106% 2 0 - - - 0 0 - - 5 $4,103,000 $820,600 $845,000 7 2 101% 11 6 $6,537,800 $1,089,633 $960,500 7 2 114% 6 0 - - - 0 0 - - 60 $36,429,773 $607,163 $619,000 68 30 108% 7 13 $10,141,500 $780,115 $725,500 13 5 110% 7 2 $1,536,000 $768,000 $768,000 3 2 119% 6 2 $1,340,000 $670,000 $670,000 3 2 106% 3 9 $5,686,000 $631,778 $650,000 8 3 108% 7 4 $2,639,800 $659,950 $660,500 6 3 103% 12 1 $480,250 $480,250 $480,250 1 0 102% 4 2 $1,326,000 $663,000 $663,000 7 5 121% 6 1 $616,000 $616,000 $616,000 3 4 103% 17 0 - - - 1 2 - - 8 $3,987,000 $498,375 $477,000 7 2 104% 7 18 $8,677,223 $482,068 $460,912 16 2 108% 7 1 1 1 1 2 3 4 5
- 19. Toronto Real Estate Board Market Watch, April 2016 SUMMARY OF EXISTING HOME TRANSACTIONS CO-OP APARTMENT, APRIL 2016 ALL TREB AREAS 19 Sales Dollar Volume Average Price Median Price New Listings Active Listings Avg. SP / LP Average DOM TREB Total Halton Region Burlington Halton Hills Milton Oakville Peel Region Brampton Caledon Mississauga City of Toronto Toronto West Toronto Central Toronto East York Region Aurora E. Gwillimbury Georgina King Markham Newmarket Richmond Hill Vaughan Whitchurch-Stouffville Durham Region Ajax Brock Clarington Oshawa Pickering Scugog Uxbridge Whitby Dufferin County Orangeville Simcoe County Adjala-Tosorontio Bradford West GwillimburyEssa Innisfil New Tecumseth 17 $6,997,000 $411,588 $349,000 17 24 100% 28 0 - - - 0 1 - - 0 - - - 0 1 - - 0 - - - 0 0 - - 0 - - - 0 0 - - 0 - - - 0 0 - - 0 - - - 3 3 - - 0 - - - 0 0 - - 0 - - - 0 0 - - 0 - - - 3 3 - - 17 $6,997,000 $411,588 $349,000 14 20 100% 28 3 $647,500 $215,833 $233,000 2 5 99% 26 9 $5,521,500 $613,500 $662,500 9 12 100% 31 5 $828,000 $165,600 $122,000 3 3 98% 24 0 - - - 0 0 - - 0 - - - 0 0 - - 0 - - - 0 0 - - 0 - - - 0 0 - - 0 - - - 0 0 - - 0 - - - 0 0 - - 0 - - - 0 0 - - 0 - - - 0 0 - - 0 - - - 0 0 - - 0 - - - 0 0 - - 0 - - - 0 0 - - 0 - - - 0 0 - - 0 - - - 0 0 - - 0 - - - 0 0 - - 0 - - - 0 0 - - 0 - - - 0 0 - - 0 - - - 0 0 - - 0 - - - 0 0 - - 0 - - - 0 0 - - 0 - - - 0 0 - - 0 - - - 0 0 - - 0 - - - 0 0 - - 0 - - - 0 0 - - 0 - - - 0 0 - - 0 - - - 0 0 - - 0 - - - 0 0 - - 0 - - - 0 0 - - 1 1 1 1 2 3 4 5
- 20. Toronto Real Estate Board Market Watch, April 2016 SUMMARY OF EXISTING HOME TRANSACTIONS CO-OP APARTMENT, APRIL 2016 CITY OF TORONTO MUNICIPAL BREAKDOWN 20 Sales Dollar Volume Average Price Median Price New Listings Active Listings Avg. SP / LP Avg. DOM TREB Total City of Toronto Total Toronto West Toronto W01 Toronto W02 Toronto W03 Toronto W04 Toronto W05 Toronto W06 Toronto W07 Toronto W08 Toronto W09 Toronto W10 Toronto Central Toronto C01 Toronto C02 Toronto C03 Toronto C04 Toronto C06 Toronto C07 Toronto C08 Toronto C09 Toronto C10 Toronto C11 Toronto C12 Toronto C13 Toronto C14 Toronto C15 Toronto East Toronto E01 Toronto E02 Toronto E03 Toronto E04 Toronto E05 Toronto E06 Toronto E07 Toronto E08 Toronto E09 Toronto E10 Toronto E11 17 $6,997,000 $411,588 $349,000 17 24 100% 28 17 $6,997,000 $411,588 $349,000 14 20 100% 28 3 $647,500 $215,833 $233,000 2 5 99% 26 0 - - - 0 0 - - 0 - - - 0 0 - - 0 - - - 0 0 - - 0 - - - 0 0 - - 0 - - - 0 0 - - 0 - - - 0 1 - - 1 $235,000 $235,000 $235,000 0 0 96% 5 1 $179,500 $179,500 $179,500 2 2 97% 69 1 $233,000 $233,000 $233,000 0 1 104% 5 0 - - - 0 1 - - 9 $5,521,500 $613,500 $662,500 9 12 100% 31 1 $769,000 $769,000 $769,000 1 1 99% 98 2 $592,000 $296,000 $296,000 3 3 99% 9 0 - - - 1 2 - - 0 - - - 0 0 - - 0 - - - 0 0 - - 0 - - - 1 1 - - 0 - - - 0 0 - - 6 $4,160,500 $693,417 $682,750 3 5 100% 27 0 - - - 0 0 - - 0 - - - 0 0 - - 0 - - - 0 0 - - 0 - - - 0 0 - - 0 - - - 0 0 - - 0 - - - 0 0 - - 5 $828,000 $165,600 $122,000 3 3 98% 24 0 - - - 0 0 - - 1 $349,000 $349,000 $349,000 0 0 97% 27 0 - - - 0 0 - - 0 - - - 0 0 - - 0 - - - 0 0 - - 0 - - - 0 0 - - 0 - - - 0 0 - - 0 - - - 0 0 - - 0 - - - 0 0 - - 4 $479,000 $119,750 $117,000 3 3 99% 23 0 - - - 0 0 - - 1 1 1 1 2 3 4 5
- 21. Toronto Real Estate Board Market Watch, April 2016 SUMMARY OF EXISTING HOME TRANSACTIONS DETACHED CONDOMINIUM, APRIL 2016 ALL TREB AREAS 21 Sales Dollar Volume Average Price Median Price New Listings Active Listings Avg. SP / LP Avg. DOM TREB Total Halton Region Burlington Halton Hills Milton Oakville Peel Region Brampton Caledon Mississauga City of Toronto Toronto West Toronto Central Toronto East York Region Aurora E. Gwillimbury Georgina King Markham Newmarket Richmond Hill Vaughan Whitchurch-Stouffville Durham Region Ajax Brock Clarington Oshawa Pickering Scugog Uxbridge Whitby Dufferin County Orangeville Simcoe County Adjala-Tosorontio Bradford West GwillimburyEssa Innisfil New Tecumseth 4 $2,744,500 $686,125 $544,750 14 16 96% 46 1 $1,225,000 $1,225,000 $1,225,000 0 0 94% 37 0 - - - 0 0 - - 0 - - - 0 0 - - 0 - - - 0 0 - - 1 $1,225,000 $1,225,000 $1,225,000 0 0 94% 37 0 - - - 3 3 - - 0 - - - 1 1 - - 0 - - - 0 0 - - 0 - - - 2 2 - - 0 - - - 1 1 - - 0 - - - 0 0 - - 0 - - - 1 1 - - 0 - - - 0 0 - - 0 - - - 0 0 - - 0 - - - 0 0 - - 0 - - - 0 0 - - 0 - - - 0 0 - - 0 - - - 0 0 - - 0 - - - 0 0 - - 0 - - - 0 0 - - 0 - - - 0 0 - - 0 - - - 0 0 - - 0 - - - 0 0 - - 0 - - - 0 0 - - 0 - - - 0 0 - - 0 - - - 0 0 - - 0 - - - 0 0 - - 0 - - - 0 0 - - 0 - - - 0 0 - - 0 - - - 0 0 - - 0 - - - 0 0 - - 0 - - - 0 0 - - 0 - - - 0 0 - - 0 - - - 0 0 - - 3 $1,519,500 $506,500 $484,500 10 12 97% 49 0 - - - 0 0 - - 0 - - - 0 0 - - 0 - - - 0 0 - - 0 - - - 0 0 - - 3 $1,519,500 $506,500 $484,500 10 12 97% 49 1 1 1 1 2 3 4 5
- 22. Toronto Real Estate Board Market Watch, April 2016 SUMMARY OF EXISTING HOME TRANSACTIONS DETACHED CONDOMINIUM, APRIL 2016 CITY OF TORONTO MUNICIPAL BREAKDOWN 22 Sales Dollar Volume Average Price Median Price New Listings Active Listings Avg. SP / LP Avg. DOM TREB Total City of Toronto Total Toronto West Toronto W01 Toronto W02 Toronto W03 Toronto W04 Toronto W05 Toronto W06 Toronto W07 Toronto W08 Toronto W09 Toronto W10 Toronto Central Toronto C01 Toronto C02 Toronto C03 Toronto C04 Toronto C06 Toronto C07 Toronto C08 Toronto C09 Toronto C10 Toronto C11 Toronto C12 Toronto C13 Toronto C14 Toronto C15 Toronto East Toronto E01 Toronto E02 Toronto E03 Toronto E04 Toronto E05 Toronto E06 Toronto E07 Toronto E08 Toronto E09 Toronto E10 Toronto E11 4 $2,744,500 $686,125 $544,750 14 16 96% 46 0 - - - 1 1 - - 0 - - - 0 0 - - 0 - - - 0 0 - - 0 - - - 0 0 - - 0 - - - 0 0 - - 0 - - - 0 0 - - 0 - - - 0 0 - - 0 - - - 0 0 - - 0 - - - 0 0 - - 0 - - - 0 0 - - 0 - - - 0 0 - - 0 - - - 0 0 - - 0 - - - 1 1 - - 0 - - - 0 0 - - 0 - - - 0 0 - - 0 - - - 0 0 - - 0 - - - 0 0 - - 0 - - - 0 0 - - 0 - - - 0 0 - - 0 - - - 0 0 - - 0 - - - 0 0 - - 0 - - - 0 0 - - 0 - - - 0 0 - - 0 - - - 1 1 - - 0 - - - 0 0 - - 0 - - - 0 0 - - 0 - - - 0 0 - - 0 - - - 0 0 - - 0 - - - 0 0 - - 0 - - - 0 0 - - 0 - - - 0 0 - - 0 - - - 0 0 - - 0 - - - 0 0 - - 0 - - - 0 0 - - 0 - - - 0 0 - - 0 - - - 0 0 - - 0 - - - 0 0 - - 0 - - - 0 0 - - 0 - - - 0 0 - - 1 1 1 1 2 3 4 5
- 23. Toronto Real Estate Board Market Watch, April 2016 SUMMARY OF EXISTING HOME TRANSACTIONS CO-OWNERSHIP APARTMENT, APRIL 2016 ALL TREB AREAS 23 Sales Dollar Volume Average Price Median Price New Listings Active Listings Avg. SP / LP Avg. DOM TREB Total Halton Region Burlington Halton Hills Milton Oakville Peel Region Brampton Caledon Mississauga City of Toronto Toronto West Toronto Central Toronto East York Region Aurora E. Gwillimbury Georgina King Markham Newmarket Richmond Hill Vaughan Whitchurch-Stouffville Durham Region Ajax Brock Clarington Oshawa Pickering Scugog Uxbridge Whitby Dufferin County Orangeville Simcoe County Adjala-Tosorontio Bradford West GwillimburyEssa Innisfil New Tecumseth 9 $2,125,500 $236,167 $235,000 7 15 97% 73 0 - - - 0 0 - - 0 - - - 0 0 - - 0 - - - 0 0 - - 0 - - - 0 0 - - 0 - - - 0 0 - - 0 - - - 0 0 - - 0 - - - 0 0 - - 0 - - - 0 0 - - 0 - - - 0 0 - - 9 $2,125,500 $236,167 $235,000 7 15 97% 73 1 $102,500 $102,500 $102,500 0 0 92% 105 8 $2,023,000 $252,875 $238,750 7 15 98% 69 0 - - - 0 0 - - 0 - - - 0 0 - - 0 - - - 0 0 - - 0 - - - 0 0 - - 0 - - - 0 0 - - 0 - - - 0 0 - - 0 - - - 0 0 - - 0 - - - 0 0 - - 0 - - - 0 0 - - 0 - - - 0 0 - - 0 - - - 0 0 - - 0 - - - 0 0 - - 0 - - - 0 0 - - 0 - - - 0 0 - - 0 - - - 0 0 - - 0 - - - 0 0 - - 0 - - - 0 0 - - 0 - - - 0 0 - - 0 - - - 0 0 - - 0 - - - 0 0 - - 0 - - - 0 0 - - 0 - - - 0 0 - - 0 - - - 0 0 - - 0 - - - 0 0 - - 0 - - - 0 0 - - 0 - - - 0 0 - - 0 - - - 0 0 - - 0 - - - 0 0 - - 1 1 1 1 2 3 4 5
- 24. Toronto Real Estate Board Market Watch, April 2016 SUMMARY OF EXISTING HOME TRANSACTIONS CO-OWNERSHIP APARTMENT, APRIL 2016 CITY OF TORONTO MUNICIPAL BREAKDOWN 24 Sales Dollar Volume Average Price Median Price New Listings Active Listings Avg. SP / LP Avg. DOM TREB Total City of Toronto Total Toronto West Toronto W01 Toronto W02 Toronto W03 Toronto W04 Toronto W05 Toronto W06 Toronto W07 Toronto W08 Toronto W09 Toronto W10 Toronto Central Toronto C01 Toronto C02 Toronto C03 Toronto C04 Toronto C06 Toronto C07 Toronto C08 Toronto C09 Toronto C10 Toronto C11 Toronto C12 Toronto C13 Toronto C14 Toronto C15 Toronto East Toronto E01 Toronto E02 Toronto E03 Toronto E04 Toronto E05 Toronto E06 Toronto E07 Toronto E08 Toronto E09 Toronto E10 Toronto E11 9 $2,125,500 $236,167 $235,000 7 15 97% 73 9 $2,125,500 $236,167 $235,000 7 15 97% 73 1 $102,500 $102,500 $102,500 0 0 92% 105 0 - - - 0 0 - - 0 - - - 0 0 - - 0 - - - 0 0 - - 0 - - - 0 0 - - 1 $102,500 $102,500 $102,500 0 0 92% 105 0 - - - 0 0 - - 0 - - - 0 0 - - 0 - - - 0 0 - - 0 - - - 0 0 - - 0 - - - 0 0 - - 8 $2,023,000 $252,875 $238,750 7 15 98% 69 0 - - - 0 0 - - 0 - - - 0 0 - - 1 $180,000 $180,000 $180,000 2 3 97% 99 2 $454,000 $227,000 $227,000 2 5 98% 39 0 - - - 0 0 - - 0 - - - 0 0 - - 0 - - - 0 0 - - 0 - - - 0 0 - - 1 $350,000 $350,000 $350,000 1 2 95% 243 0 - - - 0 0 - - 0 - - - 0 0 - - 4 $1,039,000 $259,750 $242,500 1 3 99% 34 0 - - - 1 2 - - 0 - - - 0 0 - - 0 - - - 0 0 - - 0 - - - 0 0 - - 0 - - - 0 0 - - 0 - - - 0 0 - - 0 - - - 0 0 - - 0 - - - 0 0 - - 0 - - - 0 0 - - 0 - - - 0 0 - - 0 - - - 0 0 - - 0 - - - 0 0 - - 0 - - - 0 0 - - 0 - - - 0 0 - - 1 1 1 1 2 3 4 5
- 25. Toronto Real Estate Board Market Watch, April 2016 FOCUS ON THE MLS HOME PRICE INDEX INDEX AND BENCHMARK PRICE, APRIL 2016 ALL TREB AREAS 25 Composite Single-Family Detached Single-Family Attached Townhouse Apartment Index Benchmark Yr./Yr. % Chg. Index Benchmark Yr./Yr. % Chg. Index Benchmark Yr./Yr. % Chg. Index Benchmark Yr./Yr. % Chg. Index Benchmark Yr./Yr. % Chg. TREB Total Halton Region Burlington Halton Hills Milton Oakville Peel Region Brampton Caledon Mississauga City of Toronto York Region Aurora East Gwillimbury Georgina King Markham Newmarket Richmond Hill Vaughan Whitchurch-Stouffville Durham Region Ajax Brock Clarington Oshawa Pickering Scugog Uxbridge Whitby Dufferin County Orangeville Simcoe County Adjala-Tosorontio Bradford West GwillimburyEssa Innisfil New Tecumseth 201.4 $614,700 12.64% 208.8 $776,900 14.47% 213.4 $603,300 14.00% 193.1 $422,100 12.20% 171.5 $344,700 6.85% 211.4 $691,500 12.51% 209.5 $777,300 12.82% 216.2 $560,900 14.94% 187.8 $370,700 4.62% - - - 210.0 $622,000 10.88% 207.6 $730,800 10.07% 206.0 $491,300 9.57% 189.5 $378,400 3.84% - - - 192.1 $559,300 12.01% 196.0 $627,100 15.23% 212.5 $523,400 17.40% 174.9 $315,300 3.19% - - - 205.1 $566,400 15.22% 194.2 $673,400 15.46% 213.7 $533,500 17.74% 177.1 $324,700 6.43% - - - 220.7 $813,800 11.30% 220.6 $914,300 11.92% 224.1 $606,500 12.05% 192.4 $424,900 4.96% - - - 191.8 $525,000 12.62% 194.7 $659,800 12.61% 198.8 $507,100 13.08% 193.7 $400,800 11.84% 160.9 $277,200 10.21% 188.5 $481,100 14.38% 187.5 $548,400 13.77% 192.0 $452,400 14.70% 182.5 $338,900 14.92% 146.7 $229,600 9.48% 174.2 $621,700 11.38% 173.9 $639,800 10.34% 196.0 $484,500 15.91% - - - - - - 195.8 $547,800 11.31% 207.3 $773,900 11.75% 207.4 $566,600 11.33% 197.5 $424,200 11.08% 163.5 $286,800 10.25% 197.3 $646,900 9.86% 213.1 $924,000 12.28% 216.2 $718,400 11.27% 196.1 $474,000 11.80% 173.7 $358,900 6.43% 228.6 $785,000 16.69% 233.3 $917,300 18.31% 235.5 $682,500 17.11% 204.0 $518,800 14.93% 172.4 $373,900 6.62% 221.8 $714,000 20.67% 221.3 $822,100 20.14% 228.1 $589,900 20.69% 183.0 $463,500 25.00% 179.2 $370,600 12.99% 195.5 $633,600 20.98% 199.2 $656,600 22.36% 206.6 $437,400 21.32% - - - - - - 190.4 $395,300 16.95% 200.8 $413,800 18.12% 204.9 $403,900 13.71% - - - - - - 200.6 $850,300 15.15% 201.7 $851,200 15.19% 213.3 $499,500 6.76% - - - - - - 238.6 $822,900 16.05% 250.4 $1,029,400 18.34% 244.7 $728,700 16.52% 212.6 $530,000 14.36% 171.3 $394,800 5.03% 210.3 $620,200 17.35% 212.9 $716,600 19.81% 218.8 $515,900 18.21% 208.0 $420,000 19.82% 183.7 $309,400 15.53% 242.4 $878,900 17.27% 260.4 $1,107,000 18.74% 245.6 $744,700 16.29% 186.7 $522,800 10.87% 170.3 $354,700 8.06% 220.6 $797,700 15.32% 214.4 $892,500 16.71% 230.5 $701,400 16.77% 211.5 $575,300 11.85% 174.1 $386,300 5.77% 232.3 $875,800 17.86% 231.0 $886,300 17.62% 209.3 $574,900 17.78% - - - - - - 189.9 $446,800 16.57% 188.9 $492,500 16.75% 200.4 $401,600 17.47% 174.5 $285,100 18.14% 160.8 $289,100 2.36% 202.8 $501,100 18.18% 201.2 $538,800 17.59% 213.0 $458,200 18.99% 189.7 $346,800 21.60% 151.2 $256,700 1.00% 152.7 $288,600 13.45% 153.6 $290,900 13.44% - - - - - - - - - 183.3 $387,900 13.92% 180.5 $433,700 17.44% 192.5 $367,500 15.69% 164.3 $294,100 1.05% 163.8 $231,800 4.20% 186.8 $357,700 20.59% 186.1 $396,400 20.14% 198.2 $332,000 21.37% 152.3 $203,800 17.15% 154.4 $208,300 2.18% 191.5 $517,800 12.51% 192.2 $600,600 12.27% 199.5 $465,000 12.08% 192.8 $346,100 20.58% 169.1 $331,100 2.61% 169.4 $442,000 11.74% 174.2 $451,000 11.81% 167.0 $349,500 16.05% - - - - - - 176.6 $540,000 15.35% 176.4 $546,300 14.99% 170.0 $417,200 16.36% - - - - - - 190.4 $497,700 14.98% 192.1 $551,900 15.10% 196.7 $433,300 15.57% 181.2 $329,100 23.35% 153.9 $300,300 1.12% 189.9 $435,300 18.39% 198.2 $451,700 18.90% 184.0 $344,800 17.12% - - - - - - 189.9 $435,300 18.39% 198.2 $451,700 18.90% 184.0 $344,800 17.12% - - - - - - 183.7 $391,600 17.31% 178.2 $394,900 17.55% 192.9 $370,200 17.84% - - - - - - 153.6 $545,100 11.79% 153.6 $545,100 11.79% - - - - - - - - - 211.7 $526,100 22.51% 193.0 $591,200 23.72% 216.9 $450,900 23.17% - - - - - - 178.5 $418,000 15.01% 174.9 $442,300 13.65% 176.7 $301,100 12.98% - - - - - - 178.4 $330,000 16.75% 178.5 $330,800 16.82% 197.0 $306,500 17.26% - - - - - - 165.8 $383,000 13.25% 162.1 $417,600 13.28% 173.8 $331,800 14.34% - - - - - -
- 26. Toronto Real Estate Board Market Watch, April 2016 FOCUS ON THE MLS HOME PRICE INDEX INDEX AND BENCHMARK PRICE, APRIL 2016 CITY OF TORONTO 26 Composite Single-Family Detached Single-Family Attached Townhouse Apartment Index Benchmark Yr./Yr. % Chg. Index Benchmark Yr./Yr. % Chg. Index Benchmark Yr./Yr. % Chg. Index Benchmark Yr./Yr. % Chg. Index Benchmark Yr./Yr. % Chg. TREB Total City of Toronto Toronto W01 Toronto W02 Toronto W03 Toronto W04 Toronto W05 Toronto W06 Toronto W07 Toronto W08 Toronto W09 Toronto W10 Toronto C01 Toronto C02 Toronto C03 Toronto C04 Toronto C06 Toronto C07 Toronto C08 Toronto C09 Toronto C10 Toronto C11 Toronto C12 Toronto C13 Toronto C14 Toronto C15 Toronto E01 Toronto E02 Toronto E03 Toronto E04 Toronto E05 Toronto E06 Toronto E07 Toronto E08 Toronto E09 Toronto E10 Toronto E11 201 $614,700 12.64% 209 $776,900 14.47% 213 $603,300 14.00% 193 $422,100 12.20% 172 $344,700 6.85% 197 $646,900 9.86% 213 $924,000 12.28% 216 $718,400 11.27% 196 $474,000 11.80% 174 $358,900 6.43% 179 $728,300 8.64% 193 $994,200 9.85% 211 $814,000 11.88% 196 $404,000 12.89% 152 $354,200 6.97% 216 $776,700 9.39% 223 $916,600 8.35% 256 $782,600 11.04% 172 $475,000 15.79% 150 $610,000 9.94% 215 $557,500 11.86% 222 $604,700 12.84% 221 $566,200 10.72% 135 $326,300 5.40% 154 $293,700 13.07% 189 $494,200 11.26% 199 $626,500 11.77% 195 $567,400 10.66% 183 $445,200 8.98% 158 $232,300 7.06% 179 $425,100 14.40% 196 $654,100 13.34% 182 $531,700 13.12% 177 $291,500 17.51% 150 $197,100 18.66% 169 $491,500 7.05% 216 $684,900 8.99% 184 $557,600 10.45% 196 $578,000 21.26% 127 $316,200 4.89% 188 $803,000 6.50% 199 $859,200 7.93% 188 $772,400 9.28% 142 $520,500 5.20% 112 $455,400 0.72% 167 $677,700 7.21% 182 $951,500 6.81% 186 $704,500 7.16% 167 $409,000 14.35% 150 $302,800 7.20% 184 $472,000 9.16% 196 $733,600 9.07% 177 $496,400 5.23% 189 $487,300 6.32% 157 $201,000 8.14% 178 $413,100 11.18% 198 $582,700 12.12% 189 $512,100 10.12% 165 $296,600 18.16% 144 $219,600 7.07% 202 $499,600 6.22% 206 $726,100 8.32% 227 $789,700 13.06% 193 $575,200 2.93% 197 $410,800 5.28% 204 $967,600 3.56% 194 $1,540,800 5.82% 227 $1,192,900 9.10% 210 $980,100 16.06% 184 $514,300 -4.70% 220 $1,134,400 8.95% 214 $1,287,400 7.50% 229 $847,800 9.31% - - - 226 $597,900 13.95% 199 $1,233,000 10.49% 208 $1,451,800 11.31% 208 $995,400 13.28% 168 $629,100 4.73% 153 $364,200 2.89% 213 $848,500 13.87% 227 $972,000 16.58% 199 $744,400 15.27% - - - 196 $433,100 10.74% 201 $689,400 13.07% 252 $1,153,700 21.21% 197 $702,800 15.30% 169 $496,200 13.73% 161 $379,300 3.80% 186 $477,700 5.40% 163 $507,200 6.32% 200 $833,600 5.94% 193 $586,000 10.34% 186 $409,900 5.57% 142 $1,053,000 8.16% 130 $1,636,800 6.63% 147 $1,197,800 5.90% 175 $902,300 6.39% 150 $495,600 9.28% 208 $810,200 6.40% 217 $1,328,700 11.48% 213 $1,052,000 11.23% 249 $571,400 11.40% 201 $480,400 2.30% 190 $681,800 9.24% 188 $1,260,100 10.08% 211 $933,800 11.84% 127 $203,200 11.85% 194 $276,500 8.67% 186 $1,597,400 12.70% 180 $1,932,300 12.73% 213 $915,900 16.10% 212 $719,100 19.20% 191 $601,000 7.66% 198 $730,400 16.20% 223 $1,194,300 20.29% 205 $658,000 17.94% 195 $556,200 18.44% 166 $329,300 9.83% 201 $682,700 10.45% 255 $1,384,500 15.89% 221 $1,077,100 13.70% 239 $808,600 6.40% 176 $441,900 7.40% 206 $687,000 11.50% 257 $1,205,300 20.76% 231 $752,100 18.22% 213 $525,300 9.73% 155 $362,700 2.31% 238 $740,000 11.05% 239 $806,000 11.97% 248 $780,400 8.84% 217 $438,800 9.60% 209 $496,000 10.87% 217 $807,100 10.80% 194 $855,700 8.43% 228 $763,500 11.20% 222 $711,600 11.38% 215 $588,000 11.36% 215 $663,400 16.31% 225 $755,300 18.82% 208 $677,900 12.00% - - - 158 $235,800 7.65% 202 $506,300 9.80% 212 $626,300 10.53% 203 $491,300 10.29% 186 $401,900 5.20% 189 $286,200 7.64% 205 $546,800 14.57% 231 $815,000 14.65% 224 $617,400 13.75% 213 $463,100 16.90% 163 $320,300 8.67% 213 $600,100 11.90% 215 $614,500 13.16% 213 $506,700 15.20% 198 $489,200 8.32% 194 $426,900 5.97% 215 $530,400 10.77% 246 $806,500 11.85% 234 $611,700 9.91% 226 $490,400 17.86% 180 $307,600 9.31% 192 $472,500 7.19% 208 $650,000 8.10% 186 $478,900 19.79% 182 $371,700 4.78% 158 $252,800 7.69% 192 $463,200 10.61% 218 $620,400 12.37% 197 $483,200 10.93% 194 $358,100 14.03% 161 $301,900 7.91% 212 $599,300 11.89% 214 $685,700 11.85% 204 $531,400 11.40% 214 $374,000 12.96% 142 $228,600 2.09% 200 $441,200 13.44% 223 $618,400 14.09% 215 $487,000 13.59% 161 $317,200 7.82% 169 $252,000 16.01%
- 27. Toronto Real Estate Board Market Watch, April 2016 HISTORIC ANNUAL STATISTICS 27 Year Sales Average Price 2004 2005 2006 2007 2008 2009 2010 2011 2012 2013 2014 83,501 $315,231 84,145 $335,907 83,084 $351,941 93,193 $376,236 74,552 $379,347 87,308 $395,460 85,545 $431,276 89,096 $465,014 85,496 $497,130 87,049 $522,958 92,782 $566,624 2015 MONTHLY STATISTICS NOTES 1 - Sales, dollar volume, average sale prices and median sale prices are based on firm transactions entered into the TREB MLS® system between the first and last day of the month/period being reported. 2 - New listings entered into the TREB MLS® system between the first and last day of the month/period being reported. 3 - Active listings at the end of the last day of the month/period being reported. 4 - Ratio of the average selling price to the average listing price for firm transactions entered into the TREB MLS® system between the first and last day of the month/period being reported. 5 - Average number of days on the market for firm transactions entered into the TREB MLS® system between the first and last day of the month/period being reported. 6 - Due to past changes to TREB's service area, caution should be exercised when making historical comparisons. 7 - Past monthly and year-to-date figures are revised on a monthly basis. 8 - SNLR = Sales-to-New Listings Ratio. Calculated using a 12-month moving average (sales/new listings). 9 - Mos. Inv. = Months of Inventory. Calculated using a 12-month moving average (active listings/sales). 2016 MONTHLY STATISTICS *For historic annual sales and average price data over a longer time frame go to: January February March April May June July August September October November December Year to Date 4,642 $630,527 7,592 $686,058 10,304 $687,936 12,085 $739,082 - - - - - - - - - - - - - - - - 34,623 $685,900 January February March April May June July August September October November December Annual 4,318 $552,925 6,294 $596,320 8,886 $613,818 11,254 $636,094 11,640 $649,648 11,905 $639,309 9,813 $608,875 7,943 $603,534 8,149 $627,818 8,759 $630,254 7,336 $632,800 4,916 $608,753 101,213 $622,121 1,6,7 1,7 1,7 http://www.torontorealestateboard.com/market_news/market_watch/historic_stats/p df/TREB_historic_statistics.pdf Copyright® 2016 Toronto Real Estate Board $697,67934,623