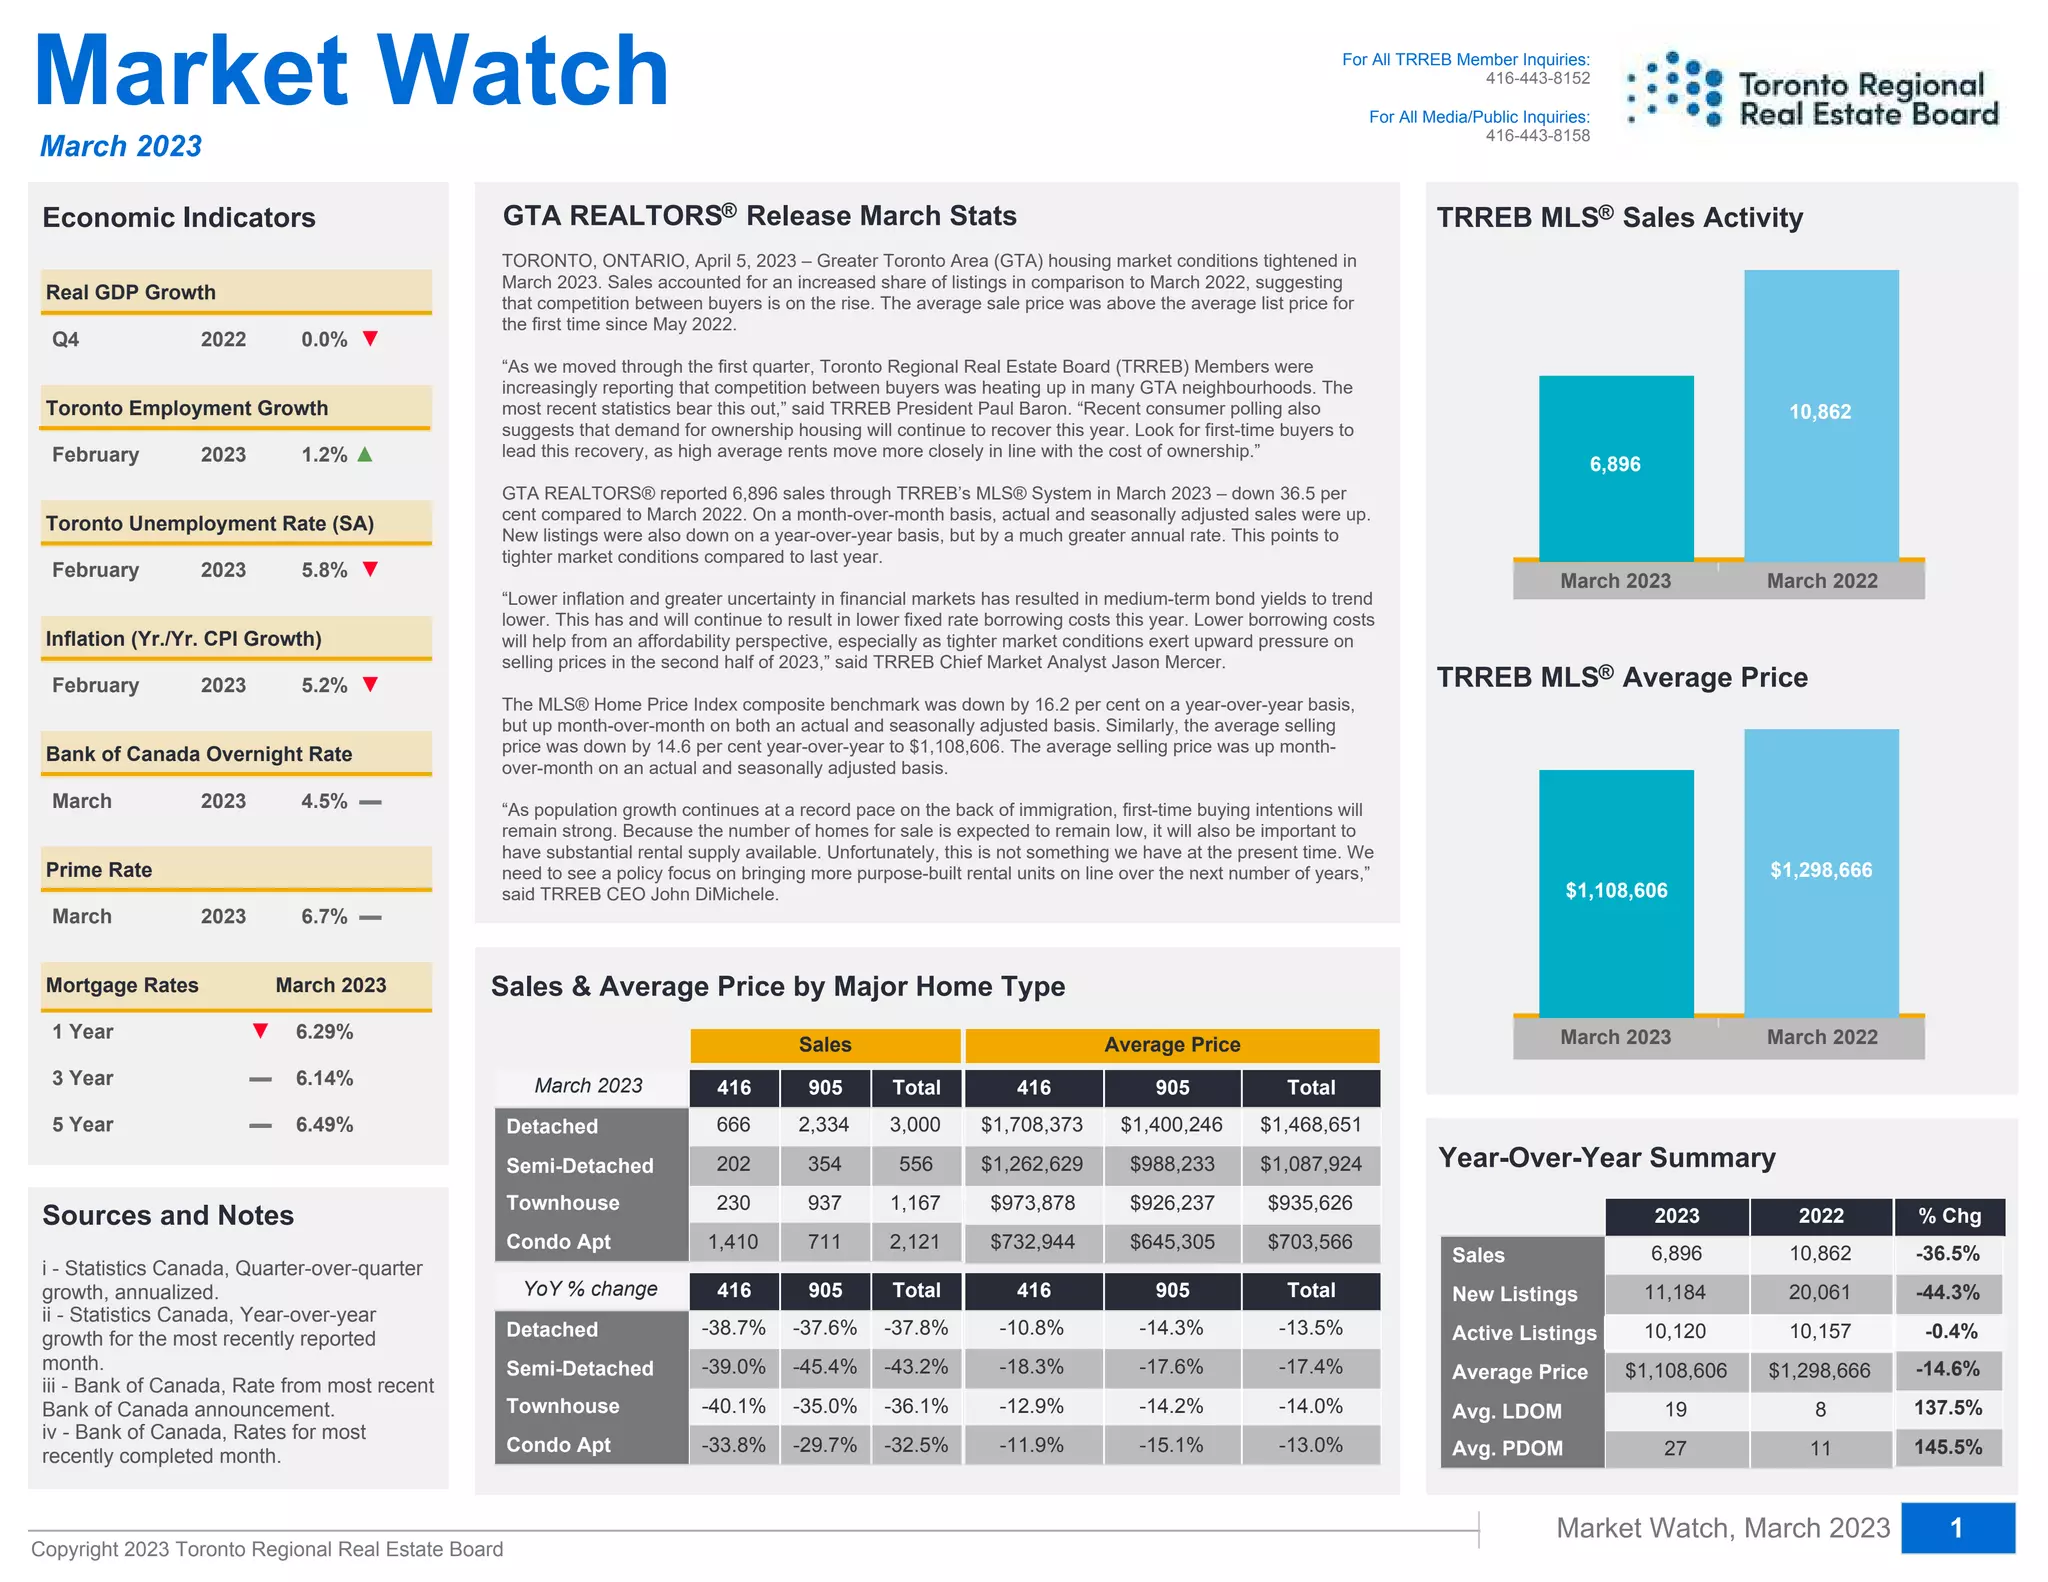
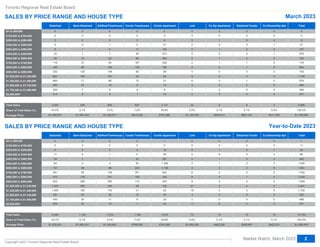
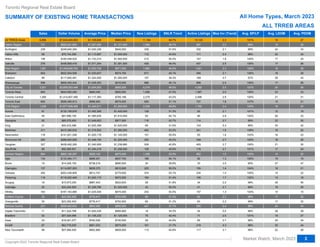
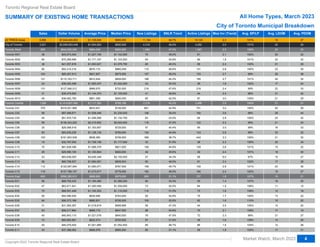
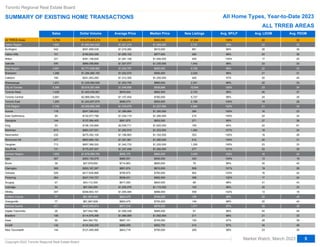
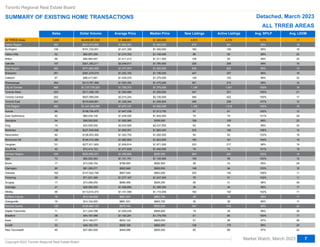
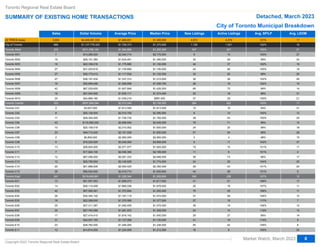
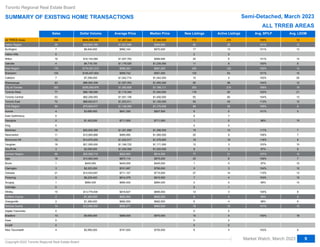
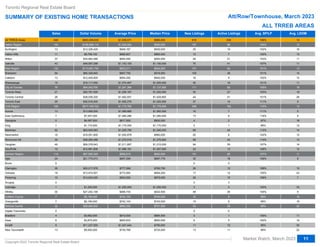
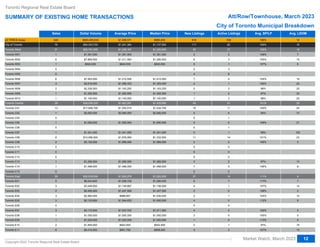
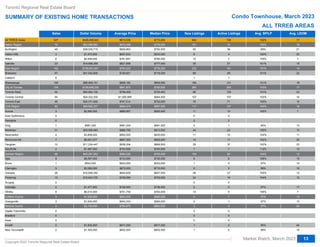
The document provides real estate market statistics for the Greater Toronto Area (GTA) in March 2023. It summarizes that housing market conditions tightened in March compared to the previous year, with sales accounting for an increased share of listings, suggesting rising competition among buyers. The average sale price was above the average list price for the first time since May 2022. Overall home sales were down 36.5% year-over-year while new listings declined by a greater rate, pointing to tighter market conditions. The average selling price declined by 14.6% over the same period.
TORONTO REAL ESTATE BOARD'S JUNE 2017 MARKET STATSShawn Venasse
"Recent Ipsos survey results suggest that home buying activity in the GTA will remain strong moving forward. The year-over-year dip in home sales we have experienced over the last two months seem to be the result of would-be buyers putting their decision to purchase temporarily on hold while they monitor the impact of the Fair Housing Plan. On the supply side of the market, it certainly looks as though buyers will benefit from more choice in the second half of 2017 compared to the same period in 2016,"said Jason Mercer, TREB's Director of Market Analysis and Service Channels.
TORONTO REAL ESTATE SALES - APRIL 2018 (TREB)Shawn Venasse
TORONTO, May 3, 2018 -- Toronto Real Estate Board President Tim Syrianos announced that Greater Toronto Area REALTORS® reported 7,792 sales through TREB's MLS® System in April 2018. The average selling price was $804,584. On a year-over-year basis, sales were down by 32.1 per cent and the average selling price was down by 12.4 per cent.
TORONTO REGIONAL REAL ESTATE BOARD'S - MARKET WATCH - FOR AUGUEST 2021Shawn Venasse
This is the monthly stats report on all sales and listings within the MLS system run by the Toronto real estate board. This is the definitive AUGUST 2021 sales guide.
The Palm Beach real estate market has been on a tear in recent years, but there are signs that it is starting to cool off. Closed sales and cash sales are both down, and median sale price is up, but not as much as it was in previous quarters. Dollar volume is also down, and median percent of original list price received is down. Median time to contract and median time to sale are both up, which suggests that homes are taking longer to sell.
TORONTO REAL ESTATE BOARD's - MARKET WATCH - MAY 2017 REPORTShawn Venasse
The Toronto Real Estate Board's (TREB) Market Watch report provides the latest real estate prices and sales volume each and every month.
In the May 2017 MARKET WATCH, TREB reports that Toronto's selling prices continued to increase strongly compared to the same month in 2016. The MLS® HPI Composite Benchmark price was up by 29 per cent year-over-year. The average selling price for all home types combined for the TREB Market Area as a whole was up by 14.9 per cent to $863,910. Year-over-year price increases were greater for condominium apartments compared to low-rise home types. This likely reflects the fact that the low-rise market segments benefited most from the increase in listings."
Annie Williams Real Estate Report-May 2023Annie Williams
The median sales price for single-family, re-sale was down 7.5% in April from March. It was down 23.4% year-over-year. The average sales price for single-family, re-sale homes was down 5.8% month-over-month. Year-over-year, it was down 12.8%.
TORONTO REGIONAL REAL ESTATE BOARD's - MARKET WATCH - FOR DECEMBER 2019 & YEA...Shawn Venasse
Toronto Real Estate Board President Michael Collins reported that December 2019 residential sales reported through TREB’s MLS® System by Greater Toronto Area REALTORS® were up by 17.4 per cent year-over-year to 4,399. Total sales for calendar year 2019 amounted to 87,825 – up by 12.6 per cent compared to the decade low 78,015 sales reported in 2018. On an annual basis, 2019 sales were in line with the median annual sales result for the past decade.
Stay in the know! For all of those moving to, from or within the Las Vegas NV Metropolitan area; including Nellis AFB, Creech AFB, North Las Vegas NV, Henderson NV, Boulder City and other areas in Southern Nevada.
IZZY is a retired Veteran, member of the Veterans Association of Real Estate Professionals (VAREP), a designated Military Relocation Professional (MRP), Military Relocation Specialist (MRS) and a Military/Veteran Housing Certified (MVHC) professional). Serving those who serve is his passion!
Green Homes, Islamabad Presentation .pdfticktoktips
Green Homes Islamabad offers beautifully designed 5, 8, and 10 Marla homes near the airport and motorway. Enjoy luxury, convenience, and high rental returns in a prime location.
Omaxe Sports City Dwarka stands out as a premier residential and recreational destination, offering a blend of luxury and sports-centric living. Located in the thriving area of Dwarka, this project by Omaxe Limited is designed to cater to modern lifestyle needs while promoting a healthy, active living environment.
Brigade Insignia offers meticulously designed apartments with modern architecture and premium finishes. The project features spacious 3,3.5,4 and 5 BHK units, each thoughtfully planned to provide maximum comfort, natural light, and ventilation.
https://www.newprojectbangalore.com/brigade-insignia-yelahanka-bangalore.html
BricknBolt Understanding Load-Bearing Walls and Their Structural Support in H...BrickAndBolt
Load-bearing walls are the backbone of any home construction, providing crucial structural support that carries the weight of the house above. For companies like Brick and Bolt Mysore and Bricknbolt Faridabad, understanding and properly implementing these elements are key to constructing safe and durable buildings.
Torun Center Residences Istanbul - Listing TurkeyListing Turkey
THERE IS LIFE IN ITS CENTER!
The most energetic spot of the city that will add utterly different pleasures to your life, with a park that will make Istanbul breathe, delighting indoor and outdoor bistros, cafes, restaurants, the brand-new Food Hall concept, where dozens of unique tastes are served together, market area, cinema, theater, fitness club, SPA and event venue...
All the pleasures that will enrich your lives are awaiting you on the most beautiful side of the city, at Torun Center Residences. In Mecidiyeköy, where the heart of Istanbul beats, business, life and entertainment opportunities are located at the exact center, at Torun Center, the most beautiful side of the city.
Penthouse apartments and different styles of flats from 1 + 1 to 4 + 1, from 100 to 425 square meters in a 42-story residence tower, have been designed for those who want to live in the center of magnificence. Torun Center is the redefinition of a better life with specially landscaped floor gardens, apartment options with private balconies, and automatic glass systems equipped with Trickle Ventilation that offers clean air comfort.
Business and life in the same place
Excellent service
Torun Center has many delightful details, from a swimming pool to sunbathing and resting terrace. With 24/7 concierge services, 24/7 security, valet, technical service, closed-circuit camera system (CCTV), central heating and cooling system, it makes your life easier.
Delightful details
The two-story Torun Center Lounge, with its indoor and outdoor seating areas, children's playroom, private dining and TV lounge, promises unforgettable memories to you and your loved ones with its unique Istanbul view.
Neighboring to the most pleasant square of Istanbul
A few steps from the Torun Center Residences, you can reach the city's most modern city square and open the doors of a quality city life. Torun Center Residences brings together on the same project the long-awaited city life for Istanbul and gourmet restaurants, cafes, gym and SPA, and state-of-the-art cinema and Artı Stage, hosting the most famous plays of the season.
Located at the intersection of alternative public transportation options such as the metro and Metrobus, Torun Center comes to the fore as the most accessible office for both sides of Istanbul. With a central location and rich transportation lines, Torun Center offices make life easier for employees and increase productivity.
Keep Your Home Naturally Cool and Warm Out Change in Seasons
Vinra Construction is a private limited company registered under the ROC. The management has an experience of over 15 years of understanding the needs and delivering apt solutions to the end users We are providing turnkey solutions in construction fields. like Construction, Interior Designing Facility Management, Plantation Management, etc..
Vinra Construction Tech Enabled Company for Eco-Friendly Home Construction
Contact With Vinra for a Greener Future >>> Call us @ 888 4898 765
Investing In The US As A Canadian… And How To Do It RIGHT!! (feat. Erwin Szet...Volition Properties
=== Investing In The US As A Canadian… And How To Do It RIGHT!! (feat. Erwin Szeto) ===
Ever been curious about Real Estate Investing in the US?? At Volition, for the past 14 years, we have been focused on helping investors invest in over $250M of real estate and generate $100M of wealth in the Toronto market, but we are always open to learning more about other business models and learning from other investors.
The US has always been an intriguing market to invest in. But the US is a big place… if you’re interested in investing in the US, you probably have a lot of questions, like:
☑️ Specifically WHERE should you invest?
☑️ What are the best markets to invest in and why?
☑️ How much are property prices there?
☑️ What are the returns like?
☑️ What is cashflow like?
☑️ Compared to investing in Toronto or other cities in Ontario, what are the benefits / tradeoffs?
☑️ What ownership structure should I use?
☑️ What are the tax implications?
☑️ Can I get financing?
☑️ What are tenants like?
Enter Erwin Szeto, a longtime friend of Volition. Since 2005, Erwin Szeto and his team have navigated the challenging landscape of being landlords in Ontario. Now, they are shifting their focus and guiding their clients' investments toward the more landlord-friendly environment of the USA. This decision comes after assisting Canadian clients in transacting over $440,000,000 in income properties. Faced with issues like affordability constraints, tenant-friendly laws, rent control, and rental licensing in Canada, Erwin sees a clear opportunity in the U.S. Here, there is a significant influx of investments leading to the creation of high-paying manufacturing jobs. Erwin and his clients are poised to capitalize on these opportunities where landlord rights are stronger and there is no rent control.
To facilitate this transition, Erwin has partnered with and become a client of SHARE, a one-stop-shop U.S. Asset Manager. Founded by Canadians for Canadians, SHARE enables as passive an ownership experience as possible for landlords in the U.S., while still maintaining direct, 100% ownership.
Erwin is “Making Real Estate Investing Great Again”!!
Website: https://www.infinitywealth.ca/
Facebook: https://www.facebook.com/iwinrealestate and https://www.facebook.com/ErwinSzetoOfficial
Podcast: https://www.truthaboutrealestateinvesting.ca/
Instagram: https://www.instagram.com/iwinrealestate/ and https://www.instagram.com/erwinszeto/
One FNG by Group 108 Sector 142 Noida Construction UpdateOne FNG
One FNG by Group 108 is launching a new commercial project in Sector 142 Noida. Office space and high street retail shops on the FNG and Noida Expressway. For more information visit the website https://www.onefng.com/
Lixin Azarmehr, a Los Angeles-based real estate development trailblazer, co-founded JL Real Estate Development (JL RED) in 2015 and serves as its CEO. Her expertise has propelled the firm to specialize in luxury residential and mixed-use commercial projects, with a portfolio that features upscale retail spaces and sophisticated care facilities.
Flat available for sale
Location- Tupudana, Ranchi
Savitri enclave
Area- 3BHK
Rate- 4000/sq.ft.
Super Build Up Area-1629 sq.ft.
Build-up area-1253 sq.ft.
Rate- 65lakh16k(approx)
Floor available- Flat available in all floor(G+12)
Balcony- 2
Washroom- 2
Parking - CAR PARKING
Amenities- Joggers track,temple, children's park,gym,banquet hall (5 Lakh)
Possession year (Handover year)- Dec 2025
Outside View from the apartment and flat balcony is very beautiful.
For more information contact AASHIYANA STAR PROPERTIES
7766900371
Rixos Tersane Istanbul Residences Brochure_May2024_ENG.pdfListing Turkey
Tersane Suites Residences is a luxurious real estate project located in the heart of Istanbul, next to the beautiful Golden Horn. This unique development offers hotel concept residences with Rixos management, making it the perfect choice for both homeowners and investors.
The Tersane Suites Residences offers a wide range of options, from studio apartments to spacious four-bedroom units, all designed to the highest standard. The suites are finished with high-quality materials and feature modern, open-plan living spaces, fully-equipped kitchens, and large balconies with stunning views of the city and sea.
One of the standout features of Tersane Suites Residences is the Rixos management, which provides a truly exclusive and upscale living experience. Residents will have access to a range of luxury amenities, including a fitness center, spa, and indoor and outdoor swimming pools. Plus, the on-site restaurants and cafes provide a taste of the local and international cuisine.
The Tersane Suites Residences also offers a great opportunity for investors, as it provides a rental guarantee program. This means that investors can enjoy a steady income stream, with the peace of mind that their property is being managed by a reputable and experienced team.
The location of Tersane Suites Residences is also unbeatable, with easy access to the city’s main transportation links and within close proximity to the historic center, making it the perfect base for exploring all that Istanbul has to offer.
MC Heights-Best Construction Company in jhanglaraibfatim009
MC Heights stands as the epitome of excellence in construction within Jhang. With a commitment to unparalleled quality and innovative design, MC Heights redefines urban living in the heart of Jhang. Offering luxurious residential spaces, cutting-edge commercial complexes, and vibrant community areas, MC Heights caters to the diverse needs of modern lifestyles. Our dedication to superior craftsmanship and customer satisfaction ensures that every aspect of MC Heights exceeds expectations, making it the premier choice for those seeking unparalleled sophistication and comfort in Jhang.
Scanning tenants in NYC requires a thorough and compliant approach to ensure you find reliable renters. For a positive rental experience, consider hiring a property management service. Belgium Management LLC specializes in NYC rental property management and tenant relationship management. We prioritize tenant satisfaction, making us a trusted name in New York property management. Our dedicated team ensures tenants feel valued and supported throughout their lease.
The SVN® organization shares a portion of their new weekly listings via their SVN Live® Weekly Property Broadcast. Visit https://svn.com/svn-live/ if you would like to attend our weekly call, which we open up to the brokerage community.
500 acres of brilliance await you here at Riverview City which offers modern living, effortless convenience, and a beautiful natural setting. It is a mega township by Magarpatta City in Loni Kalbhor, Pune. Enjoy easy access to work, schools, and fun while experiencing a perfect work-life balance.
Visit - magarpattacity.developerprojects.in
Urbanrise Paradise on Earth - Unveiling Unprecedented Luxury in Exquisite Vil...JagadishKR1
Immerse yourself in the epitome of luxury living at Urbanrise Paradise on Earth. These opulent 4 BHK villas, nestled off the prestigious Kanakapura Road in Bangalore, redefine elegance and sophistication. With meticulous craftsmanship, breathtaking design, and unparalleled amenities, Urbanrise Paradise on Earth offers a sanctuary where every moment is infused with luxury and serenity. Experience a life of grandeur and indulgence at this exclusive residential enclave.
Elegant Evergreen Homes - Luxury Apartments Redefining Comfort in Yelahanka, ...JagadishKR1
Experience unmatched luxury at Elegant Evergreen Homes, offering exquisite 2, 3, and 4 BHK apartments in the serene locality of Yelahanka, Bangalore. These meticulously crafted homes blend modern design with timeless elegance, providing a harmonious living environment. Enjoy top-tier amenities and a prime location, making Elegant Evergreen Homes the ideal choice for discerning homeowners.
Oeiras Tech City, Developed by RE Capital and REIG, Will Become Lisbon's Futu...Newman George Leech
Oeiras Tech City, a historic development in the Oeiras municipality of Lisbon, is acquired by RE Capital and REIG. It is located on a 93,000-square-meter plot of land and combines co-living, business, and residential areas. It highlights ESG principles and is close to Tagus Park, which improves the urban landscape of Lisbon.
Oeiras Tech City, Developed by RE Capital and REIG, Will Become Lisbon's Futu...
March 2023 Market Watch
1. Sources and Notes
i - Statistics Canada, Quarter-over-quarter
growth, annualized.
ii - Statistics Canada, Year-over-year
growth for the most recently reported
month.
iii - Bank of Canada, Rate from most recent
Bank of Canada announcement.
iv - Bank of Canada, Rates for most
recently completed month.
% Chg
Inflation (Yr./Yr. CPI Growth)
Toronto Employment Growth
1 Year
3 Year
5 Year
½ 6.29%
6.14%
6.49%
Real GDP Growth
416 905 Total
Detached
Semi-Detached
Townhouse
Condo Apt -33.8%
-40.1%
-39.0%
-38.7%
-29.7%
-35.0%
-45.4%
-37.6%
Market Watch, March 2023
TRREB MLS Sales Activity
March 2023 March 2022
$1,298,666
$1,108,606
TRREB MLS Average Price
2023 2022
Sales
New Listings
Active Listings
Average Price
Avg. LDOM
Avg. PDOM 11
8
$1,298,666
0
0
10,862
27
19
$1,108,606
1
3,722
6,896
Market Watch For All TRREB Member Inquiries:
416-443-8152
nk
For All Media/Public Inquiries:
416-443-8158
Copyright 2023 Toronto Regional Real Estate Board
March 2023
Economic Indicators ®
145.5%
137.5%
-14.6%
-36.5%
-36.5%
-36.5%
Year-Over-Year Summary
March 2023 March 2022
10,862
6,896
20,061
11,184 -44.3%
10,157
10,120
GTA REALTORS Release March Stats
TORONTO, ONTARIO, April 5, 2023 – Greater Toronto Area (GTA) housing market conditions tightened in
March 2023. Sales accounted for an increased share of listings in comparison to March 2022, suggesting
that competition between buyers is on the rise. The average sale price was above the average list price for
the first time since May 2022.
“As we moved through the first quarter, Toronto Regional Real Estate Board (TRREB) Members were
increasingly reporting that competition between buyers was heating up in many GTA neighbourhoods. The
most recent statistics bear this out,” said TRREB President Paul Baron. “Recent consumer polling also
suggests that demand for ownership housing will continue to recover this year. Look for first-time buyers to
lead this recovery, as high average rents move more closely in line with the cost of ownership.”
GTA REALTORS® reported 6,896 sales through TRREB’s MLS® System in March 2023 – down 36.5 per
cent compared to March 2022. On a month-over-month basis, actual and seasonally adjusted sales were up.
New listings were also down on a year-over-year basis, but by a much greater annual rate. This points to
tighter market conditions compared to last year.
“Lower inflation and greater uncertainty in financial markets has resulted in medium-term bond yields to trend
lower. This has and will continue to result in lower fixed rate borrowing costs this year. Lower borrowing costs
will help from an affordability perspective, especially as tighter market conditions exert upward pressure on
selling prices in the second half of 2023,” said TRREB Chief Market Analyst Jason Mercer.
The MLS® Home Price Index composite benchmark was down by 16.2 per cent on a year-over-year basis,
but up month-over-month on both an actual and seasonally adjusted basis. Similarly, the average selling
price was down by 14.6 per cent year-over-year to $1,108,606. The average selling price was up month-
over-month on an actual and seasonally adjusted basis.
“As population growth continues at a record pace on the back of immigration, first-time buying intentions will
remain strong. Because the number of homes for sale is expected to remain low, it will also be important to
have substantial rental supply available. Unfortunately, this is not something we have at the present time. We
need to see a policy focus on bringing more purpose-built rental units on line over the next number of years,”
said TRREB CEO John DiMichele.
®
Sales & Average Price by Major Home Type
416 905 Total
Detached
Semi-Detached
Townhouse
Condo Apt 2,121
1,167
556
3,000
711
937
354
2,334
1,410
230
202
666
416 905 Total
$703,566
$935,626
$1,087,924
$1,468,651
$645,305
$926,237
$988,233
$1,400,246
$732,944
$973,878
$1,262,629
$1,708,373
Sales Average Price
YoY % change
March 2023
416 905 Total
-11.9%
-12.9%
-18.3%
-10.8%
-15.1%
-14.2%
-17.6%
-14.3%
Q4 2022 0.0% ½
February 2023 1.2% ·
February 2023 5.8% ½
Toronto Unemployment Rate (SA)
February 2023 5.2% ½
March 2023 4.5%
Bank of Canada Overnight Rate
March 2023 6.7%
Prime Rate
Mortgage Rates March 2023
-0.4%
®
1
-32.5%
-36.1%
-43.2%
-37.8%
-13.0%
-14.0%
-17.4%
-13.5%
2. Market Watch, March 2023
Toronto Regional Real Estate Board
SALES BY PRICE RANGE AND HOUSE TYPE March 2023
Copyright 2023 Toronto Regional Real Estate Board
2
Year-to-Date 2023
Detached Semi-Detached Att/Row/Townhouse Condo Townhouse Condo Apartment Link Co-Op Apartment Detached Condo Co-Ownership Apt Total
$0 to $99,999
$100,000 to $199,999
$200,000 to $299,999
$300,000 to $399,999
$400,000 to $499,999
$500,000 to $599,999
$600,000 to $699,999
$700,000 to $799,999
$800,000 to $899,999
$900,000 to $999,999
$1,000,000 to $1,249,999
$1,250,000 to $1,499,999
$1,500,000 to $1,749,999
$1,750,000 to $1,999,999
$2,000,000+ 931
488
925
1,732
2,401
1,584
1,434
1,532
1,661
1,530
440
69
22
0
1
0
0
0
0
0
0
0
0
0
3
3
3
1
0
0
0
0
0
3
4
0
1
5
2
0
0
0
0
0
0
0
0
0
0
0
0
0
2
2
1
1
8
1
0
0
0
1
3
19
21
9
8
6
3
2
0
0
0
0
0
44
20
35
63
162
204
344
642
1,196
1,359
387
46
16
0
1
1
6
10
31
69
110
190
351
223
92
23
0
0
0
0
15
11
36
170
343
350
241
156
46
4
1
1
0
0
0
22
20
50
126
365
289
178
89
48
5
1
0
0
0
0
849
430
791
1,320
1,437
622
472
281
141
64
24
11
4
0
0
Total Sales
Share of Total Sales (%)
Average Price $1,089,819
100.0%
14,750
$422,351
0.1%
10
$959,697
0.1%
15
$462,526
0.1%
15
$1,090,309
0.5%
72
$700,566
30.6%
4,519
$796,556
7.5%
1,106
$1,029,843
9.3%
1,374
$1,068,201
8.1%
1,193
$1,432,601
43.7%
6,446
Detached Semi-Detached Att/Row/Townhouse Condo Townhouse Condo Apartment Link Co-Op Apartment Detached Condo Co-Ownership Apt Total
$0 to $99,999
$100,000 to $199,999
$200,000 to $299,999
$300,000 to $399,999
$400,000 to $499,999
$500,000 to $599,999
$600,000 to $699,999
$700,000 to $799,999
$800,000 to $899,999
$900,000 to $999,999
$1,000,000 to $1,249,999
$1,250,000 to $1,499,999
$1,500,000 to $1,749,999
$1,750,000 to $1,999,999
$2,000,000+ 447
248
460
879
1,160
705
643
716
732
679
187
31
9
0
0
0
0
0
0
0
0
0
0
0
1
0
1
0
0
0
0
0
0
1
3
0
1
1
2
0
0
0
0
0
0
0
0
0
0
0
0
0
1
1
0
1
4
1
0
0
0
1
3
8
9
5
4
2
2
0
0
0
0
0
0
19
6
15
31
84
98
180
329
554
613
165
21
6
0
0
1
4
5
15
32
66
100
167
86
40
11
0
0
0
0
4
6
16
88
181
149
109
63
22
1
0
1
0
0
0
9
7
27
71
190
135
66
37
12
1
1
0
0
0
0
414
224
394
665
661
252
183
116
53
23
9
4
2
0
0
Total Sales
Share of Total Sales (%)
Average Price $1,108,606
100.0%
6,896
$411,000
0.0%
2
$951,431
0.1%
8
$428,813
0.1%
8
$1,120,760
0.5%
34
$703,566
30.8%
2,121
$813,036
7.6%
527
$1,036,571
9.3%
640
$1,087,924
8.1%
556
$1,468,651
43.5%
3,000
SALES BY PRICE RANGE AND HOUSE TYPE
18. Sales Dollar Volume Average Price Median Price New Listings Active Listings Avg. SP/LP Avg. LDOM
Abc
Abc
Abc
Abc
Abc
Abc
Abc
Abc
Abc
Abc
Abc
Abc
Abc
Abc
Abc
Abc
Abc
Abc
Abc
Abc
Abc
Abc
Abc
Abc
Abc
Abc
Abc
Abc
Abc
Abc
Abc
Abc
Abc
Abc
Abc
Abc
Abc
Abc
Abc
Abc
All TRREB Areas
All TRREB Areas
City of Toronto
City of Toronto
Toronto West
Toronto W01
Toronto W02
Toronto W02
Toronto W03
Toronto W03
Toronto W04
Toronto W05
Toronto W06
Toronto W06
Toronto W07
Toronto W07
Toronto W08
Toronto W09
Toronto W10
Toronto W10
Toronto Central
Toronto Central
Toronto C01
Toronto C02
Toronto C03
Toronto C03
Toronto C04
Toronto C04
Toronto C06
Toronto C07
Toronto C08
Toronto C08
Toronto C09
Toronto C09
Toronto C10
Toronto C11
Toronto C12
Toronto C12
Toronto C13
Toronto C13
Toronto C14
Toronto C15
Toronto East
Toronto East
Toronto E01
Toronto E01
Toronto E02
Toronto E03
Toronto E04
Toronto E04
Toronto E05
Toronto E05
Toronto E06
Toronto E07
Toronto E08
Toronto E08
Toronto E09
Toronto E09
Toronto E10
Toronto E11
34
34
4
4
0
0
0
0
0
0
0
0
0
0
0
0
0
0
0
0
3
3
0
0
0
0
0
0
0
1
0
0
0
0
0
0
0
0
0
0
0
2
1
1
0
0
0
0
0
0
0
0
0
0
0
0
0
0
0
1
$38,105,853
$38,105,853
$4,670,000
$4,670,000
$3,670,000
$3,670,000
$1,050,000
$2,620,000
$1,000,000
$1,000,000
$1,000,000
$1,120,760
$1,120,760
$1,167,500
$1,167,500
$1,223,333
$1,223,333
$1,050,000
$1,310,000
$1,000,000
$1,000,000
$1,000,000
$1,070,000
$1,070,000
$1,165,000
$1,165,000
$1,280,000
$1,280,000
$1,050,000
$1,310,000
$1,000,000
$1,000,000
$1,000,000
39
39
2
2
0
0
0
0
0
0
0
0
0
0
0
0
0
0
0
0
0
0
0
0
0
0
0
0
0
0
0
0
0
0
0
0
0
0
0
0
0
0
2
2
0
0
0
0
0
0
1
1
0
0
0
0
0
0
0
1
20
20
1
1
0
0
0
0
0
0
0
0
0
0
0
0
0
0
0
0
0
0
0
0
0
0
0
0
0
0
0
0
0
0
0
0
0
0
0
0
0
0
1
1
0
0
0
0
0
0
1
1
0
0
0
0
0
0
0
0
106%
106%
98%
98%
98%
98%
97%
98%
100%
100%
100%
11
11
31
31
37
37
37
37
12
12
12
Toronto Regional Real Estate Board
SUMMARY OF EXISTING HOME TRANSACTIONS Link, March 2023
Market Watch, March 2023
Copyright 2023 Toronto Regional Real Estate Board
18
City of Toronto Municipal Breakdown
19. Sales Dollar Volume Average Price Median Price New Listings Active Listings Avg. SP/LP Avg. LDOM
Abc
Abc
Abc
Abc
Abc
Abc
Abc
Abc
Abc
Abc
Abc
Abc
Abc
Abc
Abc
Abc
Abc
Abc
Abc
Abc
Abc
Abc
Abc
Abc
Abc
Abc
Abc
Abc
Abc
Abc
Abc
Abc
Abc
Abc
Abc
Abc
Abc
Abc
Abc
Abc
Abc
All TRREB Areas
Halton Region
Halton Region
Burlington
Halton Hills
Milton
Milton
Oakville
Peel Region
Brampton
Brampton
Caledon
Mississauga
City of Toronto
City of Toronto
Toronto West
Toronto Central
Toronto East
Toronto East
York Region
Aurora
East Gwillimbury
East Gwillimbury
Georgina
King
Markham
Markham
Newmarket
Richmond Hill
Richmond Hill
Vaughan
Vaughan
Stouffville
Durham Region
Durham Region
Ajax
Ajax
Brock
Clarington
Clarington
Oshawa
Oshawa
Pickering
Scugog
Scugog
Uxbridge
Uxbridge
Whitby
Dufferin County
Dufferin County
Orangeville
Orangeville
Simcoe County
Adjala-Tosorontio
Adjala-Tosorontio
Bradford
Bradford
Essa
Innisfil
Innisfil
New Tecumseth
8
0
0
0
0
0
0
0
0
0
0
0
0
7
7
5
0
2
2
1
0
0
0
0
0
0
0
1
0
0
0
0
0
0
0
0
0
0
0
0
0
0
0
0
0
0
0
0
0
0
0
0
0
0
0
0
0
0
0
0
0
$3,430,500
$2,790,500
$2,790,500
$1,728,000
$1,062,500
$1,062,500
$640,000
$640,000
$428,813
$398,643
$398,643
$345,600
$531,250
$531,250
$640,000
$640,000
$350,000
$340,000
$340,000
$340,000
$531,250
$531,250
$640,000
$640,000
20
3
3
3
0
0
0
0
0
0
0
0
0
14
14
4
5
5
5
3
0
0
0
0
0
1
1
1
0
0
1
1
0
0
0
0
0
0
0
0
0
0
0
0
0
0
0
0
0
0
0
0
0
0
0
0
0
0
0
0
0
25
3
3
3
0
0
0
0
0
0
0
0
0
20
20
7
7
6
6
1
0
0
0
0
0
1
1
0
0
0
0
0
0
1
1
0
0
0
0
0
1
1
0
0
0
0
0
0
0
0
0
0
0
0
0
0
0
0
0
0
0
97%
96%
96%
94%
100%
100%
98%
98%
34
39
39
43
30
30
3
3
Toronto Regional Real Estate Board
SUMMARY OF EXISTING HOME TRANSACTIONS Co-Op Apartment, March 2023
Market Watch, March 2023
Copyright 2023 Toronto Regional Real Estate Board
19
ALL TRREB AREAS
20. Sales Dollar Volume Average Price Median Price New Listings Active Listings Avg. SP/LP Avg. LDOM
Abc
Abc
Abc
Abc
Abc
Abc
Abc
Abc
Abc
Abc
Abc
Abc
Abc
Abc
Abc
Abc
Abc
Abc
Abc
Abc
Abc
Abc
Abc
Abc
Abc
Abc
Abc
Abc
Abc
Abc
Abc
Abc
Abc
Abc
Abc
Abc
Abc
Abc
Abc
Abc
All TRREB Areas
All TRREB Areas
City of Toronto
City of Toronto
Toronto West
Toronto W01
Toronto W02
Toronto W02
Toronto W03
Toronto W03
Toronto W04
Toronto W05
Toronto W06
Toronto W06
Toronto W07
Toronto W07
Toronto W08
Toronto W09
Toronto W10
Toronto W10
Toronto Central
Toronto Central
Toronto C01
Toronto C02
Toronto C03
Toronto C03
Toronto C04
Toronto C04
Toronto C06
Toronto C07
Toronto C08
Toronto C08
Toronto C09
Toronto C09
Toronto C10
Toronto C11
Toronto C12
Toronto C12
Toronto C13
Toronto C13
Toronto C14
Toronto C15
Toronto East
Toronto East
Toronto E01
Toronto E01
Toronto E02
Toronto E03
Toronto E04
Toronto E04
Toronto E05
Toronto E05
Toronto E06
Toronto E07
Toronto E08
Toronto E08
Toronto E09
Toronto E09
Toronto E10
Toronto E11
8
8
7
7
5
0
0
0
0
0
0
1
3
3
0
0
1
0
0
0
0
0
0
0
0
0
0
0
0
0
0
0
0
0
0
0
0
0
0
0
0
0
2
2
0
0
1
0
0
0
0
0
0
0
0
0
0
0
1
0
$3,430,500
$3,430,500
$2,790,500
$2,790,500
$1,728,000
$300,000
$1,008,000
$1,008,000
$420,000
$1,062,500
$1,062,500
$790,000
$272,500
$428,813
$428,813
$398,643
$398,643
$345,600
$300,000
$336,000
$336,000
$420,000
$531,250
$531,250
$790,000
$272,500
$350,000
$350,000
$340,000
$340,000
$340,000
$300,000
$340,000
$340,000
$420,000
$531,250
$531,250
$790,000
$272,500
20
20
14
14
4
0
1
1
0
0
0
1
2
2
0
0
0
0
0
0
5
5
0
0
1
1
1
1
0
0
0
0
3
3
0
0
0
0
0
0
0
0
5
5
0
0
0
0
0
0
0
0
0
1
0
0
0
0
4
0
25
25
20
20
7
0
1
1
0
0
0
0
4
4
0
0
2
0
0
0
7
7
0
0
1
1
1
1
0
0
0
0
5
5
0
0
0
0
0
0
0
0
6
6
0
0
0
0
0
0
0
0
0
1
0
0
0
0
5
0
97%
97%
96%
96%
94%
86%
96%
96%
96%
100%
100%
99%
103%
34
34
39
39
43
14
32
32
103
30
30
36
23
Toronto Regional Real Estate Board
SUMMARY OF EXISTING HOME TRANSACTIONS Co-Op Apartment, March 2023
Market Watch, March 2023
Copyright 2023 Toronto Regional Real Estate Board
20
City of Toronto Municipal Breakdown
21. Sales Dollar Volume Average Price Median Price New Listings Active Listings Avg. SP/LP Avg. LDOM
Abc
Abc
Abc
Abc
Abc
Abc
Abc
Abc
Abc
Abc
Abc
Abc
Abc
Abc
Abc
Abc
Abc
Abc
Abc
Abc
Abc
Abc
Abc
Abc
Abc
Abc
Abc
Abc
Abc
Abc
Abc
Abc
Abc
Abc
Abc
Abc
Abc
Abc
Abc
Abc
Abc
All TRREB Areas
Halton Region
Halton Region
Burlington
Halton Hills
Milton
Milton
Oakville
Peel Region
Brampton
Brampton
Caledon
Mississauga
City of Toronto
City of Toronto
Toronto West
Toronto Central
Toronto East
Toronto East
York Region
Aurora
East Gwillimbury
East Gwillimbury
Georgina
King
Markham
Markham
Newmarket
Richmond Hill
Richmond Hill
Vaughan
Vaughan
Stouffville
Durham Region
Durham Region
Ajax
Ajax
Brock
Clarington
Clarington
Oshawa
Oshawa
Pickering
Scugog
Scugog
Uxbridge
Uxbridge
Whitby
Dufferin County
Dufferin County
Orangeville
Orangeville
Simcoe County
Adjala-Tosorontio
Adjala-Tosorontio
Bradford
Bradford
Essa
Innisfil
Innisfil
New Tecumseth
8
0
0
0
0
0
0
0
3
2
2
0
1
0
0
0
0
0
0
1
0
0
0
0
0
0
0
0
0
0
1
1
0
1
1
1
1
0
0
0
0
0
0
0
0
0
0
0
0
0
0
0
3
0
0
0
0
0
0
0
3
$7,611,450
$3,155,000
$2,350,000
$2,350,000
$805,000
$1,392,450
$1,392,450
$1,392,450
$600,000
$600,000
$600,000
$600,000
$2,464,000
$2,464,000
$951,431
$1,051,667
$1,175,000
$1,175,000
$805,000
$1,392,450
$1,392,450
$1,392,450
$600,000
$600,000
$600,000
$600,000
$821,333
$821,333
$952,500
$1,170,000
$1,175,000
$1,175,000
$805,000
$1,392,450
$1,392,450
$1,392,450
$600,000
$600,000
$600,000
$600,000
$747,000
$747,000
15
1
1
1
0
0
0
0
8
5
5
0
3
1
1
0
0
1
1
0
0
0
0
0
0
0
0
0
0
0
0
0
0
1
1
1
1
0
0
0
0
0
0
0
0
0
0
0
0
0
0
0
4
0
0
0
0
0
0
0
4
17
1
1
1
0
0
0
0
5
3
3
0
2
1
1
0
0
1
1
0
0
0
0
0
0
0
0
0
0
0
0
0
0
1
1
1
1
0
0
0
0
0
0
0
0
0
0
0
0
0
0
0
9
0
0
0
0
0
0
0
9
100%
108%
108%
108%
107%
91%
91%
91%
104%
104%
104%
104%
97%
97%
31
29
33
33
20
31
31
31
4
4
4
4
43
43
Toronto Regional Real Estate Board
SUMMARY OF EXISTING HOME TRANSACTIONS Detached Condo, March 2023
Market Watch, March 2023
Copyright 2023 Toronto Regional Real Estate Board
21
ALL TRREB AREAS
22. Sales Dollar Volume Average Price Median Price New Listings Active Listings Avg. SP/LP Avg. LDOM
Abc
Abc
Abc
Abc
Abc
Abc
Abc
Abc
Abc
Abc
Abc
Abc
Abc
Abc
Abc
Abc
Abc
Abc
Abc
Abc
Abc
Abc
Abc
Abc
Abc
Abc
Abc
Abc
Abc
Abc
Abc
Abc
Abc
Abc
Abc
Abc
Abc
Abc
Abc
Abc
All TRREB Areas
All TRREB Areas
City of Toronto
City of Toronto
Toronto West
Toronto W01
Toronto W02
Toronto W02
Toronto W03
Toronto W03
Toronto W04
Toronto W05
Toronto W06
Toronto W06
Toronto W07
Toronto W07
Toronto W08
Toronto W09
Toronto W10
Toronto W10
Toronto Central
Toronto Central
Toronto C01
Toronto C02
Toronto C03
Toronto C03
Toronto C04
Toronto C04
Toronto C06
Toronto C07
Toronto C08
Toronto C08
Toronto C09
Toronto C09
Toronto C10
Toronto C11
Toronto C12
Toronto C12
Toronto C13
Toronto C13
Toronto C14
Toronto C15
Toronto East
Toronto East
Toronto E01
Toronto E01
Toronto E02
Toronto E03
Toronto E04
Toronto E04
Toronto E05
Toronto E05
Toronto E06
Toronto E07
Toronto E08
Toronto E08
Toronto E09
Toronto E09
Toronto E10
Toronto E11
8
8
0
0
0
0
0
0
0
0
0
0
0
0
0
0
0
0
0
0
0
0
0
0
0
0
0
0
0
0
0
0
0
0
0
0
0
0
0
0
0
0
0
0
0
0
0
0
0
0
0
0
0
0
0
0
0
0
0
0
$7,611,450
$7,611,450
$951,431
$951,431
$952,500
$952,500
15
15
1
1
0
0
0
0
0
0
0
0
0
0
0
0
0
0
0
0
0
0
0
0
0
0
0
0
0
0
0
0
0
0
0
0
0
0
0
0
0
0
1
1
0
0
0
0
0
0
0
0
0
0
1
1
0
0
0
0
17
17
1
1
0
0
0
0
0
0
0
0
0
0
0
0
0
0
0
0
0
0
0
0
0
0
0
0
0
0
0
0
0
0
0
0
0
0
0
0
0
0
1
1
0
0
0
0
0
0
0
0
0
0
1
1
0
0
0
0
100%
100%
31
31
Toronto Regional Real Estate Board
SUMMARY OF EXISTING HOME TRANSACTIONS Detached Condo, March 2023
Market Watch, March 2023
Copyright 2023 Toronto Regional Real Estate Board
22
City of Toronto Municipal Breakdown
23. Sales Dollar Volume Average Price Median Price New Listings Active Listings Avg. SP/LP Avg. LDOM
Abc
Abc
Abc
Abc
Abc
Abc
Abc
Abc
Abc
Abc
Abc
Abc
Abc
Abc
Abc
Abc
Abc
Abc
Abc
Abc
Abc
Abc
Abc
Abc
Abc
Abc
Abc
Abc
Abc
Abc
Abc
Abc
Abc
Abc
Abc
Abc
Abc
Abc
Abc
Abc
Abc
All TRREB Areas
Halton Region
Halton Region
Burlington
Halton Hills
Milton
Milton
Oakville
Peel Region
Brampton
Brampton
Caledon
Mississauga
City of Toronto
City of Toronto
Toronto West
Toronto Central
Toronto East
Toronto East
York Region
Aurora
East Gwillimbury
East Gwillimbury
Georgina
King
Markham
Markham
Newmarket
Richmond Hill
Richmond Hill
Vaughan
Vaughan
Stouffville
Durham Region
Durham Region
Ajax
Ajax
Brock
Clarington
Clarington
Oshawa
Oshawa
Pickering
Scugog
Scugog
Uxbridge
Uxbridge
Whitby
Dufferin County
Dufferin County
Orangeville
Orangeville
Simcoe County
Adjala-Tosorontio
Adjala-Tosorontio
Bradford
Bradford
Essa
Innisfil
Innisfil
New Tecumseth
2
0
0
0
0
0
0
0
0
0
0
0
0
2
2
0
2
0
0
0
0
0
0
0
0
0
0
0
0
0
0
0
0
0
0
0
0
0
0
0
0
0
0
0
0
0
0
0
0
0
0
0
0
0
0
0
0
0
0
0
0
$822,000
$822,000
$822,000
$822,000
$411,000
$411,000
$411,000
$411,000
$411,000
$411,000
$411,000
$411,000
8
0
0
0
0
0
0
0
0
0
0
0
0
8
8
0
7
1
1
0
0
0
0
0
0
0
0
0
0
0
0
0
0
0
0
0
0
0
0
0
0
0
0
0
0
0
0
0
0
0
0
0
0
0
0
0
0
0
0
0
0
14
0
0
0
0
0
0
0
0
0
0
0
0
14
14
2
11
1
1
0
0
0
0
0
0
0
0
0
0
0
0
0
0
0
0
0
0
0
0
0
0
0
0
0
0
0
0
0
0
0
0
0
0
0
0
0
0
0
0
0
0
92%
92%
92%
92%
84
84
84
84
Toronto Regional Real Estate Board
SUMMARY OF EXISTING HOME TRANSACTIONS Co-Ownership Apartment, March 2023
Market Watch, March 2023
Copyright 2023 Toronto Regional Real Estate Board
23
ALL TRREB AREAS
24. Sales Dollar Volume Average Price Median Price New Listings Active Listings Avg. SP/LP Avg. LDOM
Abc
Abc
Abc
Abc
Abc
Abc
Abc
Abc
Abc
Abc
Abc
Abc
Abc
Abc
Abc
Abc
Abc
Abc
Abc
Abc
Abc
Abc
Abc
Abc
Abc
Abc
Abc
Abc
Abc
Abc
Abc
Abc
Abc
Abc
Abc
Abc
Abc
Abc
Abc
Abc
All TRREB Areas
All TRREB Areas
City of Toronto
City of Toronto
Toronto West
Toronto W01
Toronto W02
Toronto W02
Toronto W03
Toronto W03
Toronto W04
Toronto W05
Toronto W06
Toronto W06
Toronto W07
Toronto W07
Toronto W08
Toronto W09
Toronto W10
Toronto W10
Toronto Central
Toronto Central
Toronto C01
Toronto C02
Toronto C03
Toronto C03
Toronto C04
Toronto C04
Toronto C06
Toronto C07
Toronto C08
Toronto C08
Toronto C09
Toronto C09
Toronto C10
Toronto C11
Toronto C12
Toronto C12
Toronto C13
Toronto C13
Toronto C14
Toronto C15
Toronto East
Toronto East
Toronto E01
Toronto E01
Toronto E02
Toronto E03
Toronto E04
Toronto E04
Toronto E05
Toronto E05
Toronto E06
Toronto E07
Toronto E08
Toronto E08
Toronto E09
Toronto E09
Toronto E10
Toronto E11
2
2
2
2
0
0
0
0
0
0
0
0
0
0
0
0
0
0
0
0
2
2
1
0
0
0
1
1
0
0
0
0
0
0
0
0
0
0
0
0
0
0
0
0
0
0
0
0
0
0
0
0
0
0
0
0
0
0
0
0
$822,000
$822,000
$822,000
$822,000
$822,000
$822,000
$312,000
$510,000
$510,000
$411,000
$411,000
$411,000
$411,000
$411,000
$411,000
$312,000
$510,000
$510,000
$411,000
$411,000
$411,000
$411,000
$411,000
$411,000
$312,000
$510,000
$510,000
8
8
8
8
0
0
0
0
0
0
0
0
0
0
0
0
0
0
0
0
7
7
2
0
0
0
0
0
0
0
0
0
0
0
0
0
0
0
1
1
4
0
1
1
0
0
1
0
0
0
0
0
0
0
0
0
0
0
0
0
14
14
14
14
2
0
0
0
0
0
0
2
0
0
0
0
0
0
0
0
11
11
2
0
0
0
1
1
0
0
0
0
0
0
0
0
0
0
1
1
7
0
1
1
0
0
1
0
0
0
0
0
0
0
0
0
0
0
0
0
92%
92%
92%
92%
92%
92%
92%
93%
93%
84
84
84
84
84
84
37
131
131
Toronto Regional Real Estate Board
SUMMARY OF EXISTING HOME TRANSACTIONS Co-Ownership Apartment, March 2023
Market Watch, March 2023
Copyright 2023 Toronto Regional Real Estate Board
24
City of Toronto Municipal Breakdown
27. Bradford West Gwillimbury
Whitchurch-Stouûville
Adjala-Tosorontio
East Gwillimbury
Richmond Hill
Toronto W06
Toronto W09
Toronto W05
Toronto E09
Toronto E06
Toronto E07
Halton Hills
Orangeville
Burlington
Clarington
Brampton
Markham
Georgina
Pickering
Vaughan
Oshawa
Caledon
Oakville
Scugog
Innisûl
Milton
Brock
Essa
King
Toronto Regional Real Estate Board
Historic Annual Statistics
Market Watch, March 2023
Copyright 2023 Toronto Regional Real Estate Board
27
Monthly Statistics 2023
Monthly Statistics 2022
Year Sales Average Price
2010
2011
2012
2013
2014
2015
2016
2017
2018
2019
2020
2021 $1,095,475
$929,636
$819,153
$787,842
$822,510
$729,824
$622,116
$566,611
$522,951
$497,073
$464,989
$431,262
121,712
95,066
87,747
78,017
92,340
113,040
101,213
92,776
87,047
85,488
89,110
85,860
January
February
March
April
May
June
July
August
September
October
November
December
Annual $1,189,915
$1,050,663
$1,079,648
$1,090,528
$1,086,560
$1,078,941
$1,073,316
$1,145,848
$1,210,372
$1,250,704
$1,298,666
$1,334,062
$1,242,407
75,071
3,099
4,510
4,933
5,001
5,586
4,870
6,422
7,226
7,940
10,862
9,028
5,594
January
February
March
April
May
June
July
August
September
October
November
December
Year to Date $1,089,819
$1,108,606
$1,096,519
$1,037,542
14,750
6,896
4,765
3,089 Notes
1. Sales, dollar volume, average sale prices and median sale prices are based on firm transactions entered into the TRREB MLS® System between the first and last day of
the month/period being reported.
2. New listings entered into the TRREB MLS® System between the first and last day of the month/period being reported.
3. Active listings at the end of the last day of the month/period being reported.
4. Ratio of the average selling price to the average listing price for firm transactions entered into the TRREB MLS® System between the first and last day of the month/period
being reported.
5. Average Listing Days on Market (Avg. LDOM) refers to the average number of days sold listings were on the market. Average Property Days on Market (Avg. PDOM) refers
to the average number of days a property was on the market before selling, irrespective of whether the property was listed more than once by the same combination of seller
and brokerage during the original listing contract period.
6. Active Listings at the end of the last day of the month/period being reported.
7. Past monthly and year-to-date figures are revised on a monthly basis.
8. SNLR = Sales-to-New-Listings Ratio. Calculated using a 12 month moving average (sales/new listings).
9. Mos. Inv. = Months of Inventory. Calculated using a 12 month moving average (active listings/sales).
10. "Bradford West Gwillimbury" is referred to as "Bradford" and "Whitchurch-Stouffville" is referred to as "Stouffville" in the report.
Dufferin
Durham
Halton
Peel
Simcoe
Toronto
York
For historical annual sales and average price data over a longer time frame, go to:
https://trreb.ca/files/market-stats/market-watch/historic.pdf