October Stats.pdf
•
0 likes•88 views

This document provides real estate statistics for the Greater Toronto Area (GTA) in October 2023. It reports that home sales were down 5.8% compared to October 2022, while average home prices increased 3.5% year-over-year. New listings increased compared to the previous year but demand has shifted to the rental market as high interest rates have discouraged some would-be buyers. The document also provides additional statistics on housing sales, prices, and inventory by region within the GTA.

Recommended
Recommended
More Related Content
Similar to October Stats.pdf
Similar to October Stats.pdf (20)
More from Michelle Makos
More from Michelle Makos (20)
Recently uploaded
Recently uploaded (20)
October Stats.pdf
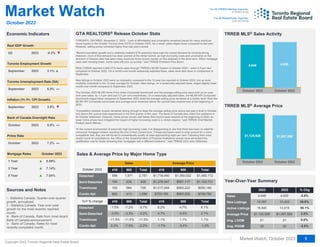
- 1. Sources and Notes i - Statistics Canada, Quarter-over-quarter growth, annualized. ii - Statistics Canada, Year-over-year growth for the most recently reported month. iii - Bank of Canada, Rate from most recent Bank of Canada announcement. iv - Bank of Canada, Rates for most recently completed month. % Chg Inflation (Yr./Yr. CPI Growth) Toronto Employment Growth 1 Year 3 Year 5 Year · 8.09% · 7.14% · 7.04% Real GDP Growth 416 905 Total Detached Semi-Detached Townhouse Condo Apt 0.2% -11.5% -3.0% -1.5% -7.0% -11.5% -3.3% -7.2% Market Watch, October 2023 TRREB MLS Sales Activity October 2023 October 2022 $1,087,590 $1,125,928 TRREB MLS Average Price 2023 2022 Sales New Listings Active Listings Average Price Avg. LDOM Avg. PDOM 33 21 $1,087,590 0 0 4,930 32 21 $1,125,928 0 1,770 4,646 Market Watch For All TRREB Member Inquiries: 416-443-8152 nk For All Media/Public Inquiries: 416-443-8158 Copyright 2023 Toronto Regional Real Estate Board October 2023 Economic Indicators ® -3.0% 0.0% 3.5% -5.8% -5.8% -5.8% Year-Over-Year Summary October 2023 October 2022 4,930 4,646 10,433 14,397 38.0% 13,019 19,540 GTA REALTORS Release October Stats TORONTO, ONTARIO, November 2, 2023 – Lack of affordability and uncertainty remained issues for many would-be home buyers in the Greater Toronto Area (GTA) in October 2023. As a result, sales edged lower compared to last year. However, selling prices remained higher than last year’s levels. “Record population growth and a relatively resilient GTA economy have kept the overall demand for housing strong. However, more of that demand has been pointed at the rental market, as high borrowing costs and uncertainty on the direction of interest rates has seen many would-be home buyers remain on the sidelines in the short term. When mortgage rates start trending lower, home sales will pick up quickly,” said TRREB President Paul Baron. REALTORS® reported 4,646 GTA home sales through TRREB’s MLS® System in October 2023 – down 5.8 per cent compared to October 2022. On a month-over-month seasonally-adjusted basis, sales were also down in comparison to September. New listings in October 2023 were up noticeably compared to the 12-year low reported in October 2022, but up more modestly compared to the 10-year average for October. New listings, on a seasonally-adjusted basis, edged slightly lower month-over-month compared to September 2023. The October 2023 MLS® Home Price Index Composite benchmark and the average selling price were both up on year- over-year basis, by 1.4 per cent and 3.5 per cent respectively. On a seasonally adjusted basis, the MLS® HPI Composite benchmark edged lower compared to September 2023 while the average selling price remained at a similar level. Both the MLS® HPI Composite benchmark and average price remained above the cyclical lows experienced at the beginning of 2023. “Competition between buyers remained strong enough to keep the average selling price above last year’s level in October and above the cyclical lows experienced in the first quarter of this year. The Bank of Canada also noted this resilience in its October statement. However, home prices remain well-below their record peak reached at the beginning of 2022, so lower home prices have mitigated the impact of higher borrowing costs to a certain degree,” said TRREB Chief Market Analyst Jason Mercer. “In the current environment of extremely high borrowing costs, it is disappointing to see that there has been no relief for uninsured mortgage holders reaching the end of their current term. If these borrowers want to shop around for a more competitive rate, they are still forced to unrealistically qualify at rates approaching eight per cent. Following their most recent round of consultations, the Office of the Superintendent of Financial Institutions should have eliminated this qualification rule for those renewing their mortgages with a different institution,” said TRREB CEO John DiMichele. ® Sales & Average Price by Major Home Type 416 905 Total Detached Semi-Detached Townhouse Condo Apt 1,296 726 428 2,157 413 564 234 1,571 883 162 194 586 416 905 Total $708,780 $930,185 $1,102,721 $1,450,112 $665,208 $905,222 $957,117 $1,350,022 $729,160 $1,017,094 $1,278,347 $1,718,440 Sales Average Price YoY % change October 2023 416 905 Total -1.7% 1.1% 4.7% 8.2% -0.4% 1.1% -0.6% 4.7% Q2 2023 -0.2% ½ September 2023 3.1% · September 2023 6.5% Toronto Unemployment Rate (SA) September 2023 3.8% ½ October 2023 5.0% Bank of Canada Overnight Rate October 2023 7.2% Prime Rate Mortgage Rates October 2023 50.1% ® 1 -2.2% -11.5% -3.2% -5.7% -1.2% 1.1% 2.1% 6.1%
- 2. Market Watch, October 2023 Toronto Regional Real Estate Board SALES BY PRICE RANGE AND HOUSE TYPE October 2023 Copyright 2023 Toronto Regional Real Estate Board 2 Year-to-Date 2023 Detached Semi-Detached Att/Row/Townhouse Condo Townhouse Condo Apartment Link Co-Op Apartment Detached Condo Co-Ownership Apt Total $0 to $99,999 $100,000 to $199,999 $200,000 to $299,999 $300,000 to $399,999 $400,000 to $499,999 $500,000 to $599,999 $600,000 to $699,999 $700,000 to $799,999 $800,000 to $899,999 $900,000 to $999,999 $1,000,000 to $1,249,999 $1,250,000 to $1,499,999 $1,500,000 to $1,749,999 $1,750,000 to $1,999,999 $2,000,000+ 4,105 2,255 4,045 7,397 9,828 6,078 5,826 5,696 6,367 5,107 1,348 232 74 3 6 0 0 0 0 0 0 0 2 3 8 13 8 1 0 0 1 3 2 10 21 15 14 13 6 1 0 0 1 1 0 0 2 0 2 5 1 1 4 11 5 14 24 4 2 0 0 1 14 74 82 44 44 32 8 3 0 0 0 0 0 166 93 156 292 707 796 1,554 2,598 4,783 4,534 1,162 148 46 0 4 19 35 39 162 369 545 951 1,195 754 306 72 8 1 0 0 56 55 214 783 1,348 1,221 907 510 131 14 4 1 0 0 0 139 120 263 684 1,635 1,090 583 305 142 18 6 3 0 0 0 3,724 1,946 3,357 5,390 5,661 2,366 1,772 1,037 529 218 77 40 21 0 2 Total Sales Share of Total Sales (%) Average Price $1,132,681 100.0% 58,367 $481,766 0.1% 35 $1,029,450 0.2% 88 $569,131 0.1% 75 $1,081,590 0.5% 302 $720,253 29.2% 17,039 $834,530 7.6% 4,456 $1,060,137 9.0% 5,244 $1,125,150 8.5% 4,988 $1,471,758 44.8% 26,140 Detached Semi-Detached Att/Row/Townhouse Condo Townhouse Condo Apartment Link Co-Op Apartment Detached Condo Co-Ownership Apt Total $0 to $99,999 $100,000 to $199,999 $200,000 to $299,999 $300,000 to $399,999 $400,000 to $499,999 $500,000 to $599,999 $600,000 to $699,999 $700,000 to $799,999 $800,000 to $899,999 $900,000 to $999,999 $1,000,000 to $1,249,999 $1,250,000 to $1,499,999 $1,500,000 to $1,749,999 $1,750,000 to $1,999,999 $2,000,000+ 323 166 299 551 796 454 493 488 496 423 127 25 3 1 1 0 0 0 0 0 0 0 1 0 0 2 0 0 0 0 0 0 0 0 2 1 0 0 0 0 0 0 0 1 0 0 0 0 0 2 0 0 1 3 0 1 1 0 0 0 0 0 1 6 10 2 1 3 0 1 0 0 0 0 0 7 10 14 23 52 63 107 191 340 358 106 21 3 0 1 1 2 2 16 15 21 64 95 58 38 11 1 0 0 0 9 4 17 51 89 75 75 53 27 2 0 0 0 0 0 18 8 16 50 113 94 80 27 17 4 1 0 0 0 0 288 142 249 405 513 198 166 117 51 20 6 2 0 0 0 Total Sales Share of Total Sales (%) Average Price $1,125,928 100.0% 4,646 $546,333 0.1% 3 $832,500 0.1% 4 $703,988 0.2% 8 $1,112,899 0.5% 24 $708,780 27.9% 1,296 $791,299 7.0% 324 $1,042,124 8.7% 402 $1,102,721 9.2% 428 $1,450,112 46.4% 2,157 SALES BY PRICE RANGE AND HOUSE TYPE
- 3. Sales Dollar Volume Average Price Median Price New Listings SNLR Trend Active Listings Mos Inv (Trend) Avg. SP/LP Avg. LDOM Avg. PDOM Abc Abc Abc Abc Abc Abc Abc Abc Abc Abc Abc Abc Abc Abc Abc Abc Abc Abc Abc Abc Abc Abc Abc Abc Abc Abc Abc Abc Abc Abc Abc Abc Abc Abc Abc Abc Abc Abc Abc Abc Abc All TRREB Areas Halton Region Burlington Halton Hills Milton Oakville Peel Region Brampton Caledon Mississauga City of Toronto Toronto West Toronto Central Toronto East York Region Aurora East Gwillimbury Georgina King Markham Newmarket Richmond Hill Vaughan Stouffville Durham Region Ajax Brock Clarington Oshawa Pickering Scugog Uxbridge Whitby Dufferin County Orangeville Simcoe County Adjala-Tosorontio Bradford Essa Innisfil New Tecumseth 4,646 425 425 137 42 106 106 140 807 338 338 51 418 1,836 1,836 498 846 492 492 848 41 26 26 36 21 239 239 56 155 155 225 225 49 588 588 81 81 14 101 101 143 143 91 19 19 19 19 120 22 22 22 22 120 4 4 28 28 15 35 35 38 $5,231,059,409 $509,682,862 $509,682,862 $156,291,749 $48,145,900 $109,839,911 $109,839,911 $195,405,302 $871,734,260 $337,816,746 $337,816,746 $71,499,500 $462,418,014 $2,070,338,658 $2,070,338,658 $512,684,568 $1,054,122,320 $503,531,770 $503,531,770 $1,096,615,488 $56,877,500 $31,173,675 $31,173,675 $30,756,000 $39,635,250 $318,628,992 $318,628,992 $64,698,959 $209,965,018 $209,965,018 $278,857,604 $278,857,604 $66,022,490 $547,749,967 $547,749,967 $77,183,609 $77,183,609 $10,064,700 $92,337,490 $92,337,490 $114,978,787 $114,978,787 $85,471,073 $18,035,999 $18,035,999 $26,405,500 $26,405,500 $123,272,809 $17,958,400 $17,958,400 $17,958,400 $17,958,400 $116,979,774 $3,695,000 $3,695,000 $31,674,400 $31,674,400 $11,864,000 $36,380,375 $36,380,375 $33,365,999 $1,125,928 $1,199,254 $1,199,254 $1,140,816 $1,146,331 $1,036,226 $1,036,226 $1,395,752 $1,080,216 $999,458 $999,458 $1,401,951 $1,106,263 $1,127,635 $1,127,635 $1,029,487 $1,246,007 $1,023,439 $1,023,439 $1,293,179 $1,387,256 $1,198,988 $1,198,988 $854,333 $1,887,393 $1,333,176 $1,333,176 $1,155,339 $1,354,613 $1,354,613 $1,239,367 $1,239,367 $1,347,398 $931,548 $931,548 $952,884 $952,884 $718,907 $914,233 $914,233 $804,047 $804,047 $939,243 $949,263 $949,263 $1,389,763 $1,389,763 $1,027,273 $816,291 $816,291 $816,291 $816,291 $974,831 $923,750 $923,750 $1,131,229 $1,131,229 $790,933 $1,039,439 $1,039,439 $878,053 $959,500 $1,100,000 $1,100,000 $1,050,000 $1,005,000 $970,000 $970,000 $1,338,500 $970,000 $935,000 $935,000 $1,300,000 $970,000 $881,833 $881,833 $893,000 $805,000 $960,000 $960,000 $1,209,000 $1,160,000 $1,121,400 $1,121,400 $767,500 $2,057,250 $1,299,000 $1,299,000 $1,077,500 $1,257,000 $1,257,000 $1,155,000 $1,155,000 $1,225,000 $850,500 $850,500 $890,000 $890,000 $626,000 $815,000 $815,000 $755,000 $755,000 $875,000 $870,000 $870,000 $1,150,000 $1,150,000 $970,000 $765,000 $765,000 $765,000 $765,000 $852,000 $997,500 $997,500 $1,100,000 $1,100,000 $707,500 $770,000 $770,000 $834,250 14,397 1,341 1,341 419 141 298 298 483 2,493 1,066 1,066 205 1,222 5,669 5,669 1,356 3,100 1,213 1,213 2,577 158 124 124 152 80 574 574 182 500 500 693 693 114 1,761 1,761 246 246 36 280 280 462 462 289 47 47 48 48 353 74 74 74 74 482 28 28 122 122 49 179 179 104 47.3% 51.2% 51.2% 56.7% 48.9% 51.1% 51.1% 47.5% 45.5% 44.6% 44.6% 36.5% 47.8% 45.8% 45.8% 48.1% 41.9% 53.0% 53.0% 47.9% 54.1% 42.4% 42.4% 43.3% 35.3% 53.8% 53.8% 51.2% 45.5% 45.5% 45.9% 45.9% 47.8% 52.4% 52.4% 55.2% 55.2% 43.7% 55.8% 55.8% 50.7% 50.7% 50.2% 51.7% 51.7% 51.5% 51.5% 52.9% 54.7% 54.7% 54.7% 54.7% 40.2% 39.4% 39.4% 40.4% 40.4% 51.6% 32.4% 32.4% 48.6% 19,540 1,933 1,933 563 218 402 402 750 3,529 1,437 1,437 358 1,734 7,907 7,907 1,884 4,654 1,369 1,369 3,479 205 173 173 243 154 681 681 240 644 644 961 961 178 1,770 1,770 220 220 52 277 277 458 458 297 62 62 69 69 335 99 99 99 99 823 66 66 181 181 73 311 311 192 2.4 2.2 2.2 2.0 2.3 1.8 1.8 2.6 2.4 2.2 2.2 3.9 2.3 2.6 2.6 2.4 3.1 1.8 1.8 2.3 1.8 2.8 2.8 2.9 5.0 1.8 1.8 1.8 2.5 2.5 2.5 2.5 2.6 1.6 1.6 1.4 1.4 3.3 1.5 1.5 1.6 1.6 1.7 2.2 2.2 2.3 2.3 1.4 1.9 1.9 1.9 1.9 3.4 4.9 4.9 2.8 2.8 2.3 4.6 4.6 2.9 99% 98% 98% 97% 97% 98% 98% 98% 98% 98% 98% 97% 98% 100% 100% 102% 98% 103% 103% 99% 98% 99% 99% 96% 92% 102% 102% 98% 100% 100% 99% 99% 96% 101% 101% 102% 102% 98% 100% 100% 101% 101% 100% 97% 97% 98% 98% 101% 98% 98% 98% 98% 97% 93% 93% 98% 98% 97% 98% 98% 97% 21 24 24 26 24 23 23 23 22 21 21 24 21 21 21 22 22 17 17 21 18 23 23 26 24 17 17 24 22 22 22 22 23 17 17 13 13 23 15 15 19 19 19 20 20 21 21 17 17 17 17 17 30 46 46 29 29 33 28 28 31 32 36 36 35 31 37 37 37 35 38 38 42 32 32 32 33 34 25 25 33 27 36 36 34 39 27 27 32 33 33 41 41 31 26 26 20 20 30 23 23 28 28 28 31 31 29 29 28 21 21 21 21 44 56 56 37 37 53 44 44 44 Toronto Regional Real Estate Board SUMMARY OF EXISTING HOME TRANSACTIONS All Home Types, October 2023 Market Watch, October 2023 Copyright 2023 Toronto Regional Real Estate Board 3 ALL TRREB AREAS
- 4. Sales Dollar Volume Average Price Median Price New Listings SNLR Trend Active Listings Mos Inv (Trend) Avg. SP/LP Avg. LDOM Avg. PDOM Abc Abc Abc Abc Abc Abc Abc Abc Abc Abc Abc Abc Abc Abc Abc Abc Abc Abc Abc Abc Abc Abc Abc Abc Abc Abc Abc Abc Abc Abc Abc Abc Abc Abc Abc Abc Abc Abc Abc Abc All TRREB Areas All TRREB Areas City of Toronto City of Toronto Toronto West Toronto W01 Toronto W02 Toronto W02 Toronto W03 Toronto W03 Toronto W04 Toronto W05 Toronto W06 Toronto W06 Toronto W07 Toronto W07 Toronto W08 Toronto W09 Toronto W10 Toronto W10 Toronto Central Toronto Central Toronto C01 Toronto C02 Toronto C03 Toronto C03 Toronto C04 Toronto C04 Toronto C06 Toronto C07 Toronto C08 Toronto C08 Toronto C09 Toronto C09 Toronto C10 Toronto C11 Toronto C12 Toronto C12 Toronto C13 Toronto C13 Toronto C14 Toronto C15 Toronto East Toronto East Toronto E01 Toronto E01 Toronto E02 Toronto E03 Toronto E04 Toronto E04 Toronto E05 Toronto E05 Toronto E06 Toronto E07 Toronto E08 Toronto E08 Toronto E09 Toronto E09 Toronto E10 Toronto E11 4,646 4,646 1,836 1,836 498 33 58 58 36 36 58 51 79 79 16 16 96 30 41 41 846 846 232 64 23 23 48 48 23 45 122 122 27 27 41 30 10 10 40 40 60 81 492 492 60 60 44 72 57 57 44 44 29 28 33 33 55 55 32 38 $5,231,059,409 $5,231,059,409 $2,070,338,658 $2,070,338,658 $512,684,568 $39,660,316 $77,992,227 $77,992,227 $33,594,300 $33,594,300 $51,972,674 $40,019,001 $83,441,807 $83,441,807 $21,614,300 $21,614,300 $100,451,910 $30,302,033 $33,636,000 $33,636,000 $1,054,122,320 $1,054,122,320 $197,334,647 $115,808,956 $77,721,580 $77,721,580 $100,955,700 $100,955,700 $25,180,500 $51,739,888 $93,641,619 $93,641,619 $82,353,000 $82,353,000 $43,835,399 $33,857,350 $47,405,000 $47,405,000 $39,682,101 $39,682,101 $64,937,876 $79,668,704 $503,531,770 $503,531,770 $70,301,130 $70,301,130 $59,418,245 $79,413,461 $53,136,287 $53,136,287 $38,534,600 $38,534,600 $30,534,409 $26,912,956 $35,093,000 $35,093,000 $46,085,019 $46,085,019 $31,788,775 $32,313,888 $1,125,928 $1,125,928 $1,127,635 $1,127,635 $1,029,487 $1,201,828 $1,344,694 $1,344,694 $933,175 $933,175 $896,081 $784,686 $1,056,225 $1,056,225 $1,350,894 $1,350,894 $1,046,374 $1,010,068 $820,390 $820,390 $1,246,007 $1,246,007 $850,580 $1,809,515 $3,379,199 $3,379,199 $2,103,244 $2,103,244 $1,094,804 $1,149,775 $767,554 $767,554 $3,050,111 $3,050,111 $1,069,156 $1,128,578 $4,740,500 $4,740,500 $992,053 $992,053 $1,082,298 $983,564 $1,023,439 $1,023,439 $1,171,686 $1,171,686 $1,350,415 $1,102,965 $932,216 $932,216 $875,786 $875,786 $1,052,911 $961,177 $1,063,424 $1,063,424 $837,909 $837,909 $993,399 $850,365 $959,500 $959,500 $881,833 $881,833 $893,000 $950,000 $1,249,500 $1,249,500 $909,000 $909,000 $782,450 $860,000 $850,000 $850,000 $1,200,000 $1,200,000 $759,500 $965,000 $860,000 $860,000 $805,000 $805,000 $722,250 $1,440,000 $2,050,000 $2,050,000 $1,882,500 $1,882,500 $1,140,000 $855,000 $668,500 $668,500 $2,460,000 $2,460,000 $900,000 $637,500 $3,059,000 $3,059,000 $723,000 $723,000 $752,500 $770,000 $960,000 $960,000 $1,109,000 $1,109,000 $1,187,000 $1,060,643 $925,000 $925,000 $755,000 $755,000 $935,000 $995,944 $985,000 $985,000 $897,000 $897,000 $975,000 $862,500 14,397 14,397 5,669 5,669 1,356 107 144 144 108 108 126 143 246 246 51 51 300 63 68 68 3,100 3,100 959 200 118 118 132 132 70 153 552 552 56 56 183 80 65 65 111 111 197 224 1,213 1,213 156 156 135 138 116 116 104 104 79 90 94 94 122 122 89 90 47.3% 47.3% 45.8% 45.8% 48.1% 46.5% 49.6% 49.6% 45.1% 45.1% 45.8% 51.2% 44.8% 44.8% 49.6% 49.6% 48.4% 51.8% 54.4% 54.4% 41.9% 41.9% 39.6% 37.1% 41.3% 41.3% 48.6% 48.6% 41.5% 46.7% 35.9% 35.9% 52.2% 52.2% 44.8% 48.1% 32.9% 32.9% 48.5% 48.5% 47.3% 49.7% 53.0% 53.0% 51.2% 51.2% 51.5% 52.7% 56.4% 56.4% 56.2% 56.2% 46.3% 58.9% 49.0% 49.0% 55.5% 55.5% 51.6% 50.2% 19,540 19,540 7,907 7,907 1,884 133 160 160 134 134 200 242 351 351 67 67 410 91 96 96 4,654 4,654 1,466 323 148 148 166 166 108 263 813 813 72 72 222 109 154 154 170 170 308 332 1,369 1,369 132 132 110 128 148 148 149 149 90 113 130 130 133 133 112 124 2.4 2.4 2.6 2.6 2.4 2.4 1.9 1.9 2.3 2.3 2.7 2.6 2.7 2.7 2.2 2.2 2.4 2.4 2.2 2.2 3.1 3.1 3.4 4.0 3.0 3.0 2.3 2.3 3.2 2.6 3.7 3.7 2.3 2.3 2.5 2.5 6.2 6.2 2.4 2.4 2.6 2.2 1.8 1.8 1.5 1.5 1.6 1.6 1.7 1.7 1.8 1.8 2.2 1.7 2.3 2.3 1.6 1.6 1.9 1.9 99% 99% 100% 100% 102% 102% 103% 103% 98% 98% 98% 101% 111% 111% 102% 102% 98% 98% 100% 100% 98% 98% 99% 96% 95% 95% 97% 97% 98% 97% 100% 100% 99% 99% 99% 98% 94% 94% 98% 98% 98% 100% 103% 103% 108% 108% 101% 106% 102% 102% 101% 101% 100% 102% 99% 99% 103% 103% 99% 103% 21 21 21 21 22 18 14 14 15 15 29 28 29 29 19 19 21 20 24 24 22 22 22 19 20 20 15 15 20 21 22 22 18 18 19 21 49 49 31 31 28 21 17 17 13 13 13 17 16 16 19 19 16 21 25 25 16 16 19 20 32 32 32 32 33 27 22 22 28 28 42 36 39 39 34 34 31 27 40 40 34 34 35 33 33 33 23 23 31 30 41 41 25 25 31 30 74 74 46 46 40 27 25 25 15 15 19 22 25 25 30 30 30 30 38 38 22 22 30 35 Toronto Regional Real Estate Board SUMMARY OF EXISTING HOME TRANSACTIONS All Home Types, October 2023 Market Watch, October 2023 Copyright 2023 Toronto Regional Real Estate Board 4 City of Toronto Municipal Breakdown
- 5. Sales Dollar Volume Average Price Median Price New Listings Avg. SP/LP Avg. LDOM Avg. PDOM All TRREB Areas Halton Region Halton Region Burlington Halton Hills Milton Milton Oakville Peel Region Brampton Brampton Caledon Mississauga City of Toronto City of Toronto Toronto West Toronto Central Toronto East Toronto East York Region Aurora East Gwillimbury East Gwillimbury Georgina King Markham Markham Newmarket Richmond Hill Richmond Hill Vaughan Vaughan Stouffville Durham Region Durham Region Ajax Ajax Brock Clarington Clarington Oshawa Oshawa Pickering Scugog Scugog Uxbridge Uxbridge Whitby Dufferin County Dufferin County Orangeville Orangeville Simcoe County Adjala-Tosorontio Adjala-Tosorontio Bradford Bradford Essa Innisfil Innisfil New Tecumseth 58,367 6,166 6,166 2,084 605 1,329 1,329 2,148 10,530 4,722 4,722 671 5,137 21,501 21,501 5,671 10,546 5,284 5,284 10,525 675 405 405 561 249 2,715 2,715 803 1,846 1,846 2,724 2,724 547 7,484 7,484 1,030 1,030 158 1,339 1,339 2,079 2,079 1,011 250 250 224 224 1,393 352 352 352 352 1,809 93 93 381 381 231 580 580 524 $66,111,198,792 $7,719,603,766 $7,719,603,766 $2,294,386,916 $674,036,408 $1,450,698,338 $1,450,698,338 $3,300,482,104 $11,411,478,049 $4,991,518,817 $4,991,518,817 $931,756,237 $5,488,202,995 $23,718,562,167 $23,718,562,167 $5,887,345,863 $12,368,183,359 $5,463,032,945 $5,463,032,945 $14,177,192,097 $933,621,712 $546,556,061 $546,556,061 $513,361,659 $516,598,413 $3,681,052,084 $3,681,052,084 $953,253,141 $2,654,997,202 $2,654,997,202 $3,629,040,425 $3,629,040,425 $748,711,400 $7,069,996,155 $7,069,996,155 $1,034,652,193 $1,034,652,193 $121,838,250 $1,189,718,480 $1,189,718,480 $1,698,860,918 $1,698,860,918 $1,026,731,826 $249,409,439 $249,409,439 $290,407,888 $290,407,888 $1,458,377,161 $292,730,173 $292,730,173 $292,730,173 $292,730,173 $1,721,636,385 $106,265,288 $106,265,288 $423,503,398 $423,503,398 $184,009,952 $532,543,303 $532,543,303 $475,314,444 $1,132,681 $1,251,963 $1,251,963 $1,100,953 $1,114,110 $1,091,571 $1,091,571 $1,536,537 $1,083,711 $1,057,077 $1,057,077 $1,388,608 $1,068,367 $1,103,138 $1,103,138 $1,038,150 $1,172,784 $1,033,882 $1,033,882 $1,347,002 $1,383,143 $1,349,521 $1,349,521 $915,083 $2,074,692 $1,355,820 $1,355,820 $1,187,115 $1,438,243 $1,438,243 $1,332,247 $1,332,247 $1,368,759 $944,681 $944,681 $1,004,517 $1,004,517 $771,128 $888,513 $888,513 $817,153 $817,153 $1,015,561 $997,638 $997,638 $1,296,464 $1,296,464 $1,046,933 $831,620 $831,620 $831,620 $831,620 $951,706 $1,142,638 $1,142,638 $1,111,557 $1,111,557 $796,580 $918,178 $918,178 $907,089 $975,625 $1,115,694 $1,115,694 $999,999 $1,000,000 $1,040,000 $1,040,000 $1,365,000 $995,000 $995,000 $995,000 $1,261,000 $958,800 $875,000 $875,000 $905,000 $808,000 $990,000 $990,000 $1,260,000 $1,289,000 $1,290,000 $1,290,000 $850,000 $1,850,000 $1,310,000 $1,310,000 $1,150,000 $1,335,000 $1,335,000 $1,260,000 $1,260,000 $1,250,000 $885,000 $885,000 $960,000 $960,000 $712,500 $840,000 $840,000 $782,500 $782,500 $950,000 $900,000 $900,000 $1,164,250 $1,164,250 $990,000 $790,000 $790,000 $790,000 $790,000 $880,000 $993,000 $993,000 $1,090,000 $1,090,000 $740,000 $849,900 $849,900 $848,944 126,585 12,282 12,282 3,713 1,269 2,692 2,692 4,608 23,651 10,683 10,683 1,855 11,113 48,238 48,238 12,042 25,900 10,296 10,296 22,594 1,281 996 996 1,334 733 5,170 5,170 1,658 4,176 4,176 6,057 6,057 1,189 14,548 14,548 1,932 1,932 354 2,431 2,431 4,154 4,154 2,064 486 486 452 452 2,675 657 657 657 657 4,615 236 236 1,005 1,005 457 1,825 1,825 1,092 102% 100% 100% 99% 99% 101% 101% 100% 101% 101% 101% 97% 101% 102% 102% 102% 100% 106% 106% 103% 102% 102% 102% 100% 96% 107% 107% 103% 104% 104% 101% 101% 102% 104% 104% 106% 106% 97% 104% 104% 106% 106% 104% 100% 100% 99% 99% 104% 99% 99% 99% 99% 98% 96% 96% 99% 99% 98% 98% 98% 99% 18 19 19 21 18 16 16 19 18 17 17 24 18 19 19 20 21 15 15 18 14 20 20 21 28 15 15 15 18 18 19 19 19 14 14 12 12 25 15 15 14 14 14 20 20 18 18 13 18 18 18 18 26 38 38 19 19 26 28 28 25 26 26 26 28 28 22 22 28 27 26 26 35 26 28 28 29 30 21 21 25 21 29 29 29 43 20 20 21 27 27 29 29 26 20 20 16 16 34 22 22 19 19 20 28 28 26 26 18 27 27 27 27 36 48 48 29 29 37 41 41 34 Toronto Regional Real Estate Board SUMMARY OF EXISTING HOME TRANSACTIONS All Home Types, Year-to-Date 2023 Market Watch, October 2023 Copyright 2023 Toronto Regional Real Estate Board 5 ALL TRREB AREAS
- 6. Sales Dollar Volume Average Price Median Price New Listings Avg. SP/LP Avg. LDOM Avg. PDOM All TRREB Areas All TRREB Areas City of Toronto City of Toronto Toronto West Toronto W01 Toronto W02 Toronto W02 Toronto W03 Toronto W03 Toronto W04 Toronto W05 Toronto W06 Toronto W06 Toronto W07 Toronto W07 Toronto W08 Toronto W09 Toronto W10 Toronto W10 Toronto Central Toronto Central Toronto C01 Toronto C02 Toronto C03 Toronto C03 Toronto C04 Toronto C04 Toronto C06 Toronto C07 Toronto C08 Toronto C08 Toronto C09 Toronto C09 Toronto C10 Toronto C11 Toronto C12 Toronto C12 Toronto C13 Toronto C13 Toronto C14 Toronto C15 Toronto East Toronto East Toronto E01 Toronto E01 Toronto E02 Toronto E03 Toronto E04 Toronto E04 Toronto E05 Toronto E05 Toronto E06 Toronto E07 Toronto E08 Toronto E08 Toronto E09 Toronto E09 Toronto E10 Toronto E11 58,367 58,367 21,501 21,501 5,671 368 547 547 389 389 603 770 967 967 197 197 1,132 270 428 428 10,546 10,546 3,005 606 360 360 544 544 262 695 1,543 1,543 182 182 580 304 189 189 463 463 791 1,022 5,284 5,284 544 544 435 617 605 605 525 525 279 507 412 412 566 566 378 416 $66,111,198,792 $66,111,198,792 $23,718,562,167 $23,718,562,167 $5,887,345,863 $463,949,084 $704,355,906 $704,355,906 $388,063,649 $388,063,649 $537,260,588 $644,270,336 $943,118,356 $943,118,356 $301,743,939 $301,743,939 $1,276,403,722 $279,822,744 $348,357,538 $348,357,538 $12,368,183,359 $12,368,183,359 $2,658,171,202 $993,021,242 $647,546,273 $647,546,273 $1,192,850,551 $1,192,850,551 $289,652,251 $827,956,069 $1,260,058,192 $1,260,058,192 $466,216,746 $466,216,746 $598,978,650 $385,168,556 $589,963,600 $589,963,600 $580,344,231 $580,344,231 $865,417,416 $1,012,838,381 $5,463,032,945 $5,463,032,945 $671,872,393 $671,872,393 $597,031,089 $769,563,278 $558,100,078 $558,100,078 $489,617,147 $489,617,147 $306,274,220 $445,173,047 $399,650,517 $399,650,517 $490,968,448 $490,968,448 $387,972,687 $346,810,040 $1,132,681 $1,132,681 $1,103,138 $1,103,138 $1,038,150 $1,260,731 $1,287,671 $1,287,671 $997,593 $997,593 $890,979 $836,715 $975,303 $975,303 $1,531,695 $1,531,695 $1,127,565 $1,036,381 $813,919 $813,919 $1,172,784 $1,172,784 $884,583 $1,638,649 $1,798,740 $1,798,740 $2,192,740 $2,192,740 $1,105,543 $1,191,304 $816,629 $816,629 $2,561,630 $2,561,630 $1,032,722 $1,267,002 $3,121,501 $3,121,501 $1,253,443 $1,253,443 $1,094,080 $991,036 $1,033,882 $1,033,882 $1,235,060 $1,235,060 $1,372,485 $1,247,266 $922,479 $922,479 $932,604 $932,604 $1,097,757 $878,053 $970,026 $970,026 $867,435 $867,435 $1,026,383 $833,678 $975,625 $975,625 $875,000 $875,000 $905,000 $1,100,000 $1,200,000 $1,200,000 $975,000 $975,000 $840,000 $863,500 $840,000 $840,000 $1,365,000 $1,365,000 $785,000 $992,944 $838,500 $838,500 $808,000 $808,000 $740,000 $1,253,500 $1,340,000 $1,340,000 $1,965,556 $1,965,556 $803,500 $844,000 $698,900 $698,900 $1,925,000 $1,925,000 $770,860 $675,000 $2,550,000 $2,550,000 $850,000 $850,000 $786,337 $760,000 $990,000 $990,000 $1,176,000 $1,176,000 $1,285,000 $1,200,000 $950,000 $950,000 $800,000 $800,000 $980,000 $730,000 $890,000 $890,000 $872,500 $872,500 $1,040,000 $822,500 126,585 126,585 48,238 48,238 12,042 841 1,124 1,124 889 889 1,309 1,522 2,199 2,199 419 419 2,413 520 806 806 25,900 25,900 7,806 1,635 910 910 1,136 1,136 654 1,515 4,499 4,499 369 369 1,342 632 585 585 983 983 1,720 2,114 10,296 10,296 1,103 1,103 876 1,180 1,111 1,111 967 967 630 860 888 888 1,057 1,057 765 859 102% 102% 102% 102% 102% 104% 105% 105% 104% 104% 101% 101% 102% 102% 102% 102% 100% 102% 101% 101% 100% 100% 101% 98% 100% 100% 100% 100% 102% 101% 100% 100% 99% 99% 101% 101% 98% 98% 101% 101% 101% 102% 106% 106% 108% 108% 107% 109% 106% 106% 107% 107% 104% 107% 102% 102% 108% 108% 103% 105% 18 18 19 19 20 18 16 16 17 17 22 24 21 21 17 17 20 22 21 21 21 21 21 22 18 18 18 18 20 20 22 22 22 22 18 20 23 23 20 20 22 19 15 15 12 12 12 14 15 15 16 16 15 17 19 19 15 15 15 17 26 26 28 28 29 24 23 23 27 27 33 33 30 30 25 25 29 28 31 31 30 30 31 33 27 27 25 25 32 29 32 32 29 29 26 28 41 41 28 28 32 26 21 21 18 18 17 22 21 21 21 21 21 23 25 25 20 20 24 26 Toronto Regional Real Estate Board SUMMARY OF EXISTING HOME TRANSACTIONS All Home Types, Year-to-Date 2023 Market Watch, October 2023 Copyright 2023 Toronto Regional Real Estate Board 6 City of Toronto Municipal Breakdown
- 7. Sales Dollar Volume Average Price Median Price New Listings Active Listings Avg. SP/LP Avg. LDOM Abc Abc Abc Abc Abc Abc Abc Abc Abc Abc Abc Abc Abc Abc Abc Abc Abc Abc Abc Abc Abc Abc Abc Abc Abc Abc Abc Abc Abc Abc Abc Abc Abc Abc Abc Abc Abc Abc Abc Abc Abc All TRREB Areas Halton Region Halton Region Burlington Halton Hills Milton Milton Oakville Peel Region Brampton Brampton Caledon Mississauga City of Toronto City of Toronto Toronto West Toronto Central Toronto East Toronto East York Region Aurora East Gwillimbury East Gwillimbury Georgina King Markham Markham Newmarket Richmond Hill Richmond Hill Vaughan Vaughan Stouffville Durham Region Durham Region Ajax Ajax Brock Clarington Clarington Oshawa Oshawa Pickering Scugog Scugog Uxbridge Uxbridge Whitby Dufferin County Dufferin County Orangeville Orangeville Simcoe County Adjala-Tosorontio Adjala-Tosorontio Bradford Bradford Essa Innisfil Innisfil New Tecumseth 2,157 214 214 73 31 37 37 73 399 182 182 42 175 586 586 186 154 246 246 455 25 18 18 35 15 110 110 41 74 74 99 99 38 404 404 55 55 13 76 76 101 101 40 17 17 18 18 84 12 12 12 12 87 4 4 24 24 11 28 28 20 $3,127,890,529 $326,020,007 $326,020,007 $106,251,349 $40,131,500 $49,374,000 $49,374,000 $130,263,158 $545,978,297 $208,691,746 $208,691,746 $63,536,500 $273,750,051 $1,007,005,800 $1,007,005,800 $267,623,097 $431,265,618 $308,117,085 $308,117,085 $734,507,011 $43,735,500 $22,702,875 $22,702,875 $30,006,000 $32,495,250 $189,204,440 $189,204,440 $52,524,969 $136,999,564 $136,999,564 $170,633,413 $170,633,413 $56,205,000 $413,416,140 $413,416,140 $57,195,509 $57,195,509 $9,564,700 $74,683,100 $74,683,100 $88,346,388 $88,346,388 $47,796,035 $16,480,999 $16,480,999 $25,580,500 $25,580,500 $93,768,909 $11,164,500 $11,164,500 $11,164,500 $11,164,500 $89,798,774 $3,695,000 $3,695,000 $27,920,400 $27,920,400 $9,041,500 $29,784,375 $29,784,375 $19,357,499 $1,450,112 $1,523,458 $1,523,458 $1,455,498 $1,294,565 $1,334,432 $1,334,432 $1,784,427 $1,368,367 $1,146,658 $1,146,658 $1,512,774 $1,564,286 $1,718,440 $1,718,440 $1,438,834 $2,800,426 $1,252,508 $1,252,508 $1,614,301 $1,749,420 $1,261,271 $1,261,271 $857,314 $2,166,350 $1,720,040 $1,720,040 $1,281,097 $1,851,345 $1,851,345 $1,723,570 $1,723,570 $1,479,079 $1,023,307 $1,023,307 $1,039,918 $1,039,918 $735,746 $982,672 $982,672 $874,717 $874,717 $1,194,901 $969,471 $969,471 $1,421,139 $1,421,139 $1,116,297 $930,375 $930,375 $930,375 $930,375 $1,032,170 $923,750 $923,750 $1,163,350 $1,163,350 $821,955 $1,063,728 $1,063,728 $967,875 $1,250,000 $1,377,500 $1,377,500 $1,246,000 $1,235,000 $1,265,000 $1,265,000 $1,620,000 $1,225,000 $1,108,500 $1,108,500 $1,358,750 $1,320,000 $1,323,950 $1,323,950 $1,244,500 $2,075,000 $1,122,500 $1,122,500 $1,510,000 $1,428,000 $1,155,000 $1,155,000 $780,000 $2,150,000 $1,634,000 $1,634,000 $1,180,000 $1,760,044 $1,760,044 $1,550,000 $1,550,000 $1,375,000 $967,500 $967,500 $1,025,000 $1,025,000 $642,000 $879,000 $879,000 $815,000 $815,000 $1,042,500 $870,000 $870,000 $1,174,500 $1,174,500 $1,065,000 $812,500 $812,500 $812,500 $812,500 $940,000 $997,500 $997,500 $1,175,000 $1,175,000 $770,000 $815,000 $815,000 $894,000 6,446 744 744 227 110 122 122 285 1,223 599 599 162 462 1,469 1,469 445 530 494 494 1,420 103 98 98 143 67 255 255 111 247 247 319 319 77 1,159 1,159 157 157 34 192 192 309 309 142 45 45 45 45 235 44 44 44 44 387 28 28 101 101 35 147 147 76 8,535 1,093 1,093 314 174 187 187 418 1,737 806 806 301 630 1,884 1,884 569 799 516 516 1,963 131 146 146 232 142 305 305 137 320 320 424 424 126 1,132 1,132 135 135 51 183 183 286 286 144 61 61 64 64 208 57 57 57 57 669 66 66 155 155 57 246 246 145 99% 97% 97% 97% 96% 96% 96% 98% 97% 98% 98% 96% 97% 100% 100% 103% 97% 102% 102% 99% 97% 98% 98% 96% 91% 101% 101% 97% 100% 100% 99% 99% 96% 101% 101% 102% 102% 97% 100% 100% 101% 101% 100% 97% 97% 98% 98% 101% 98% 98% 98% 98% 97% 93% 93% 98% 98% 96% 98% 98% 97% 19 23 23 24 24 25 25 20 19 20 20 22 17 17 17 18 17 15 15 20 17 27 27 26 28 16 16 19 20 20 20 20 25 16 16 13 13 24 16 16 15 15 16 21 21 22 22 15 20 20 20 20 30 46 46 30 30 32 28 28 29 Toronto Regional Real Estate Board SUMMARY OF EXISTING HOME TRANSACTIONS Detached, October 2023 Market Watch, October 2023 Copyright 2023 Toronto Regional Real Estate Board 7 ALL TRREB AREAS
- 8. Sales Dollar Volume Average Price Median Price New Listings Active Listings Avg. SP/LP Avg. LDOM Abc Abc Abc Abc Abc Abc Abc Abc Abc Abc Abc Abc Abc Abc Abc Abc Abc Abc Abc Abc Abc Abc Abc Abc Abc Abc Abc Abc Abc Abc Abc Abc Abc Abc Abc Abc Abc Abc Abc Abc All TRREB Areas All TRREB Areas City of Toronto City of Toronto Toronto West Toronto W01 Toronto W02 Toronto W02 Toronto W03 Toronto W03 Toronto W04 Toronto W05 Toronto W06 Toronto W06 Toronto W07 Toronto W07 Toronto W08 Toronto W09 Toronto W10 Toronto W10 Toronto Central Toronto Central Toronto C01 Toronto C02 Toronto C03 Toronto C03 Toronto C04 Toronto C04 Toronto C06 Toronto C07 Toronto C08 Toronto C08 Toronto C09 Toronto C09 Toronto C10 Toronto C11 Toronto C12 Toronto C12 Toronto C13 Toronto C13 Toronto C14 Toronto C15 Toronto East Toronto East Toronto E01 Toronto E01 Toronto E02 Toronto E03 Toronto E04 Toronto E04 Toronto E05 Toronto E05 Toronto E06 Toronto E07 Toronto E08 Toronto E08 Toronto E09 Toronto E09 Toronto E10 Toronto E11 2,157 2,157 586 586 186 7 21 21 23 23 21 14 17 17 13 13 34 15 21 21 154 154 4 9 14 14 31 31 12 14 0 0 9 9 4 10 6 6 9 9 13 19 246 246 14 14 18 42 34 34 16 16 20 13 19 19 32 32 23 15 $3,127,890,529 $3,127,890,529 $1,007,005,800 $1,007,005,800 $267,623,097 $14,896,000 $39,619,788 $39,619,788 $21,923,800 $21,923,800 $27,582,974 $15,512,501 $32,219,368 $32,219,368 $19,494,300 $19,494,300 $54,944,110 $20,426,756 $21,003,500 $21,003,500 $431,265,618 $431,265,618 $8,240,000 $36,045,000 $67,475,180 $67,475,180 $81,112,900 $81,112,900 $17,846,000 $26,780,000 $49,708,000 $49,708,000 $7,740,500 $21,694,350 $34,665,000 $34,665,000 $18,256,000 $18,256,000 $27,999,888 $33,702,800 $308,117,085 $308,117,085 $23,679,000 $23,679,000 $31,869,041 $52,804,261 $37,589,388 $37,589,388 $20,324,300 $20,324,300 $24,662,900 $15,786,688 $26,507,000 $26,507,000 $31,790,330 $31,790,330 $25,323,677 $17,780,500 $1,450,112 $1,450,112 $1,718,440 $1,718,440 $1,438,834 $2,128,000 $1,886,657 $1,886,657 $953,209 $953,209 $1,313,475 $1,108,036 $1,895,257 $1,895,257 $1,499,562 $1,499,562 $1,616,003 $1,361,784 $1,000,167 $1,000,167 $2,800,426 $2,800,426 $2,060,000 $4,005,000 $4,819,656 $4,819,656 $2,616,545 $2,616,545 $1,487,167 $1,912,857 $5,523,111 $5,523,111 $1,935,125 $2,169,435 $5,777,500 $5,777,500 $2,028,444 $2,028,444 $2,153,838 $1,773,832 $1,252,508 $1,252,508 $1,691,357 $1,691,357 $1,770,502 $1,257,244 $1,105,570 $1,105,570 $1,270,269 $1,270,269 $1,233,145 $1,214,361 $1,395,105 $1,395,105 $993,448 $993,448 $1,101,029 $1,185,367 $1,250,000 $1,250,000 $1,323,950 $1,323,950 $1,244,500 $1,802,000 $1,699,888 $1,699,888 $920,000 $920,000 $1,275,000 $1,125,000 $1,200,000 $1,200,000 $1,250,000 $1,250,000 $1,461,500 $1,268,868 $981,500 $981,500 $2,075,000 $2,075,000 $2,250,000 $2,850,000 $3,047,500 $3,047,500 $2,355,000 $2,355,000 $1,375,500 $1,641,000 $5,495,000 $5,495,000 $1,945,000 $1,935,000 $3,925,000 $3,925,000 $1,550,000 $1,550,000 $1,870,000 $1,550,000 $1,122,500 $1,122,500 $1,642,500 $1,642,500 $1,395,000 $1,130,000 $1,059,000 $1,059,000 $1,204,000 $1,204,000 $1,132,450 $1,158,000 $1,100,000 $1,100,000 $981,450 $981,450 $1,088,000 $1,198,500 6,446 6,446 1,469 1,469 445 15 43 43 53 53 49 44 52 52 25 25 111 27 26 26 530 530 21 30 56 56 92 92 30 44 5 5 16 16 30 25 48 48 41 41 44 48 494 494 25 25 46 84 56 56 30 30 52 26 34 34 52 52 59 30 8,535 8,535 1,884 1,884 569 21 35 35 61 61 80 63 67 67 33 33 134 40 35 35 799 799 26 39 68 68 107 107 35 93 9 9 25 25 26 24 130 130 66 66 81 70 516 516 16 16 30 81 67 67 34 34 46 32 58 58 48 48 70 34 99% 99% 100% 100% 103% 101% 103% 103% 97% 97% 98% 100% 138% 138% 102% 102% 97% 98% 100% 100% 97% 97% 99% 95% 94% 94% 97% 97% 98% 95% 99% 99% 101% 99% 93% 93% 97% 97% 98% 100% 102% 102% 109% 109% 100% 107% 102% 102% 101% 101% 99% 101% 99% 99% 103% 103% 98% 105% 19 19 17 17 18 22 11 11 16 16 25 24 19 19 17 17 16 15 24 24 17 17 23 17 15 15 13 13 15 21 16 16 6 19 47 47 25 25 11 17 15 15 8 8 11 13 16 16 13 13 16 23 27 27 15 15 16 13 Toronto Regional Real Estate Board SUMMARY OF EXISTING HOME TRANSACTIONS Detached, October 2023 Market Watch, October 2023 Copyright 2023 Toronto Regional Real Estate Board 8 City of Toronto Municipal Breakdown
- 9. Sales Dollar Volume Average Price Median Price New Listings Active Listings Avg. SP/LP Avg. LDOM Abc Abc Abc Abc Abc Abc Abc Abc Abc Abc Abc Abc Abc Abc Abc Abc Abc Abc Abc Abc Abc Abc Abc Abc Abc Abc Abc Abc Abc Abc Abc Abc Abc Abc Abc Abc Abc Abc Abc Abc Abc All TRREB Areas Halton Region Halton Region Burlington Halton Hills Milton Milton Oakville Peel Region Brampton Brampton Caledon Mississauga City of Toronto City of Toronto Toronto West Toronto Central Toronto East Toronto East York Region Aurora East Gwillimbury East Gwillimbury Georgina King Markham Markham Newmarket Richmond Hill Richmond Hill Vaughan Vaughan Stouffville Durham Region Durham Region Ajax Ajax Brock Clarington Clarington Oshawa Oshawa Pickering Scugog Scugog Uxbridge Uxbridge Whitby Dufferin County Dufferin County Orangeville Orangeville Simcoe County Adjala-Tosorontio Adjala-Tosorontio Bradford Bradford Essa Innisfil Innisfil New Tecumseth 428 22 22 5 2 12 12 3 119 69 69 3 47 194 194 59 55 80 80 49 2 2 2 0 0 18 18 5 6 6 14 14 2 38 38 5 5 0 1 1 17 17 11 1 1 0 0 3 3 3 3 3 3 0 0 2 2 1 0 0 0 $471,964,724 $21,907,888 $21,907,888 $4,817,500 $1,747,000 $12,108,500 $12,108,500 $3,234,888 $112,090,250 $63,227,400 $63,227,400 $2,760,000 $46,102,850 $247,999,399 $247,999,399 $63,752,705 $95,045,888 $89,200,806 $89,200,806 $56,575,187 $2,206,000 $2,448,000 $2,448,000 $22,516,488 $22,516,488 $4,691,000 $6,447,000 $6,447,000 $16,316,699 $16,316,699 $1,950,000 $28,554,500 $28,554,500 $4,452,500 $4,452,500 $660,000 $660,000 $10,828,000 $10,828,000 $9,454,000 $680,000 $680,000 $2,480,000 $2,102,500 $2,102,500 $2,102,500 $2,102,500 $2,735,000 $2,045,000 $2,045,000 $690,000 $1,102,721 $995,813 $995,813 $963,500 $873,500 $1,009,042 $1,009,042 $1,078,296 $941,935 $916,339 $916,339 $920,000 $980,912 $1,278,347 $1,278,347 $1,080,554 $1,728,107 $1,115,010 $1,115,010 $1,154,596 $1,103,000 $1,224,000 $1,224,000 $1,250,916 $1,250,916 $938,200 $1,074,500 $1,074,500 $1,165,479 $1,165,479 $975,000 $751,434 $751,434 $890,500 $890,500 $660,000 $660,000 $636,941 $636,941 $859,455 $680,000 $680,000 $826,667 $700,833 $700,833 $700,833 $700,833 $911,667 $1,022,500 $1,022,500 $690,000 $990,000 $990,000 $990,000 $995,000 $873,500 $990,000 $990,000 $1,079,000 $925,000 $906,000 $906,000 $915,000 $965,000 $1,127,500 $1,127,500 $987,500 $1,478,888 $1,042,000 $1,042,000 $1,150,000 $1,103,000 $1,224,000 $1,224,000 $1,251,000 $1,251,000 $927,000 $1,086,000 $1,086,000 $1,147,500 $1,147,500 $975,000 $715,000 $715,000 $895,500 $895,500 $660,000 $660,000 $647,500 $647,500 $860,000 $680,000 $680,000 $845,000 $700,000 $700,000 $700,000 $700,000 $980,000 $1,022,500 $1,022,500 $690,000 1,061 66 66 12 4 36 36 14 288 157 157 14 117 456 456 131 139 186 186 143 14 5 5 0 0 34 34 26 27 27 34 34 3 81 81 11 11 0 2 2 36 36 22 1 1 0 0 9 9 9 9 9 18 0 0 10 10 2 0 0 6 1,107 65 65 11 6 37 37 11 355 189 189 18 148 454 454 131 174 149 149 144 13 5 5 0 0 33 33 26 29 29 36 36 2 55 55 8 8 0 2 2 24 24 15 0 0 0 0 6 12 12 12 12 22 0 0 11 11 2 0 0 9 102% 99% 99% 99% 103% 100% 100% 95% 100% 100% 100% 100% 100% 103% 103% 103% 101% 107% 107% 104% 103% 114% 114% 108% 108% 101% 99% 99% 100% 100% 98% 101% 101% 100% 100% 110% 110% 101% 101% 102% 101% 101% 96% 98% 98% 98% 98% 97% 97% 97% 96% 16 16 16 17 19 15 15 15 21 20 20 28 22 13 13 13 12 13 13 16 17 10 10 14 14 14 23 23 17 17 13 14 14 19 19 5 5 12 12 21 0 0 7 19 19 19 19 23 26 26 19 Toronto Regional Real Estate Board SUMMARY OF EXISTING HOME TRANSACTIONS Semi-Detached, October 2023 Market Watch, October 2023 Copyright 2023 Toronto Regional Real Estate Board 9 ALL TRREB AREAS
- 10. Sales Dollar Volume Average Price Median Price New Listings Active Listings Avg. SP/LP Avg. LDOM Abc Abc Abc Abc Abc Abc Abc Abc Abc Abc Abc Abc Abc Abc Abc Abc Abc Abc Abc Abc Abc Abc Abc Abc Abc Abc Abc Abc Abc Abc Abc Abc Abc Abc Abc Abc Abc Abc Abc Abc All TRREB Areas All TRREB Areas City of Toronto City of Toronto Toronto West Toronto W01 Toronto W02 Toronto W02 Toronto W03 Toronto W03 Toronto W04 Toronto W05 Toronto W06 Toronto W06 Toronto W07 Toronto W07 Toronto W08 Toronto W09 Toronto W10 Toronto W10 Toronto Central Toronto Central Toronto C01 Toronto C02 Toronto C03 Toronto C03 Toronto C04 Toronto C04 Toronto C06 Toronto C07 Toronto C08 Toronto C08 Toronto C09 Toronto C09 Toronto C10 Toronto C11 Toronto C12 Toronto C12 Toronto C13 Toronto C13 Toronto C14 Toronto C15 Toronto East Toronto East Toronto E01 Toronto E01 Toronto E02 Toronto E03 Toronto E04 Toronto E04 Toronto E05 Toronto E05 Toronto E06 Toronto E07 Toronto E08 Toronto E08 Toronto E09 Toronto E09 Toronto E10 Toronto E11 428 428 194 194 59 5 22 22 7 7 3 12 5 5 0 0 0 2 3 3 55 55 11 10 3 3 5 5 1 4 4 4 5 5 4 1 2 2 3 3 0 2 80 80 25 25 14 17 6 6 1 1 3 3 1 1 3 3 3 4 $471,964,724 $471,964,724 $247,999,399 $247,999,399 $63,752,705 $7,475,000 $24,823,839 $24,823,839 $7,455,000 $7,455,000 $3,168,000 $11,221,000 $5,041,089 $5,041,089 $1,750,777 $2,818,000 $2,818,000 $95,045,888 $95,045,888 $16,901,200 $19,540,500 $4,012,500 $4,012,500 $8,445,000 $8,445,000 $1,140,000 $4,917,000 $7,487,000 $7,487,000 $16,605,000 $16,605,000 $6,913,800 $1,175,000 $2,725,000 $2,725,000 $2,535,000 $2,535,000 $2,648,888 $89,200,806 $89,200,806 $30,649,632 $30,649,632 $18,041,086 $19,198,200 $5,056,000 $5,056,000 $800,000 $800,000 $2,470,000 $3,201,888 $1,035,000 $1,035,000 $2,530,000 $2,530,000 $2,590,000 $3,629,000 $1,102,721 $1,102,721 $1,278,347 $1,278,347 $1,080,554 $1,495,000 $1,128,356 $1,128,356 $1,065,000 $1,065,000 $1,056,000 $935,083 $1,008,218 $1,008,218 $875,389 $939,333 $939,333 $1,728,107 $1,728,107 $1,536,473 $1,954,050 $1,337,500 $1,337,500 $1,689,000 $1,689,000 $1,140,000 $1,229,250 $1,871,750 $1,871,750 $3,321,000 $3,321,000 $1,728,450 $1,175,000 $1,362,500 $1,362,500 $845,000 $845,000 $1,324,444 $1,115,010 $1,115,010 $1,225,985 $1,225,985 $1,288,649 $1,129,306 $842,667 $842,667 $800,000 $800,000 $823,333 $1,067,296 $1,035,000 $1,035,000 $843,333 $843,333 $863,333 $907,250 $990,000 $990,000 $1,127,500 $1,127,500 $987,500 $1,375,000 $1,062,500 $1,062,500 $1,055,000 $1,055,000 $1,100,000 $920,000 $900,000 $900,000 $875,389 $963,000 $963,000 $1,478,888 $1,478,888 $1,485,000 $1,707,500 $1,007,500 $1,007,500 $1,800,000 $1,800,000 $1,140,000 $1,213,500 $1,843,500 $1,843,500 $2,850,000 $2,850,000 $1,783,150 $1,175,000 $1,362,500 $1,362,500 $850,000 $850,000 $1,324,444 $1,042,000 $1,042,000 $1,235,610 $1,235,610 $1,165,393 $1,100,000 $821,500 $821,500 $800,000 $800,000 $780,000 $1,031,888 $1,035,000 $1,035,000 $825,000 $825,000 $825,000 $894,000 1,061 1,061 456 456 131 16 41 41 31 31 5 26 4 4 0 0 1 5 2 2 139 139 41 20 10 10 9 9 1 8 12 12 7 7 6 7 4 4 8 8 0 6 186 186 56 56 47 38 6 6 4 4 4 11 3 3 3 3 6 8 1,107 1,107 454 454 131 13 31 31 33 33 4 38 4 4 0 0 2 3 3 3 174 174 58 31 16 16 6 6 1 7 10 10 5 5 4 6 3 3 11 11 1 15 149 149 41 41 37 26 5 5 7 7 6 8 4 4 2 2 4 9 102% 102% 103% 103% 103% 103% 105% 105% 101% 101% 91% 104% 100% 100% 101% 97% 97% 101% 101% 102% 99% 104% 104% 100% 100% 91% 96% 103% 103% 102% 102% 104% 98% 98% 98% 95% 95% 108% 107% 107% 110% 110% 102% 108% 102% 102% 97% 97% 104% 106% 98% 98% 100% 100% 109% 108% 16 16 13 13 13 9 10 10 9 9 17 17 29 29 7 16 16 12 12 10 13 6 6 9 9 26 31 8 8 4 4 8 10 23 23 9 9 25 13 13 11 11 17 12 10 10 38 38 12 15 28 28 24 24 7 13 Toronto Regional Real Estate Board SUMMARY OF EXISTING HOME TRANSACTIONS Semi-Detached, October 2023 Market Watch, October 2023 Copyright 2023 Toronto Regional Real Estate Board 10 City of Toronto Municipal Breakdown
- 11. Sales Dollar Volume Average Price Median Price New Listings Active Listings Avg. SP/LP Avg. LDOM Abc Abc Abc Abc Abc Abc Abc Abc Abc Abc Abc Abc Abc Abc Abc Abc Abc Abc Abc Abc Abc Abc Abc Abc Abc Abc Abc Abc Abc Abc Abc Abc Abc Abc Abc Abc Abc Abc Abc Abc Abc All TRREB Areas Halton Region Halton Region Burlington Halton Hills Milton Milton Oakville Peel Region Brampton Brampton Caledon Mississauga City of Toronto City of Toronto Toronto West Toronto Central Toronto East Toronto East York Region Aurora East Gwillimbury East Gwillimbury Georgina King Markham Markham Newmarket Richmond Hill Richmond Hill Vaughan Vaughan Stouffville Durham Region Durham Region Ajax Ajax Brock Clarington Clarington Oshawa Oshawa Pickering Scugog Scugog Uxbridge Uxbridge Whitby Dufferin County Dufferin County Orangeville Orangeville Simcoe County Adjala-Tosorontio Adjala-Tosorontio Bradford Bradford Essa Innisfil Innisfil New Tecumseth 402 69 69 6 5 35 35 23 66 44 44 4 18 61 61 14 29 18 18 112 4 6 6 1 5 35 35 2 27 27 28 28 4 68 68 12 12 1 13 13 8 8 10 1 1 0 0 23 4 4 4 4 22 0 0 1 1 2 7 7 12 $418,933,699 $70,768,700 $70,768,700 $6,391,500 $3,980,400 $31,581,700 $31,581,700 $28,815,100 $59,420,599 $37,395,100 $37,395,100 $3,739,000 $18,286,499 $81,177,110 $81,177,110 $15,429,316 $48,062,677 $17,685,117 $17,685,117 $132,687,253 $3,840,000 $6,022,800 $6,022,800 $750,000 $6,490,000 $44,036,000 $44,036,000 $2,050,000 $33,353,154 $33,353,154 $32,295,799 $32,295,799 $3,849,500 $53,997,637 $53,997,637 $9,807,100 $9,807,100 $500,000 $9,314,500 $9,314,500 $6,048,999 $6,048,999 $8,253,038 $875,000 $875,000 $19,199,000 $2,826,400 $2,826,400 $2,826,400 $2,826,400 $18,056,000 $865,000 $865,000 $1,402,500 $6,596,000 $6,596,000 $9,192,500 $1,042,124 $1,025,633 $1,025,633 $1,065,250 $796,080 $902,334 $902,334 $1,252,830 $900,312 $849,889 $849,889 $934,750 $1,015,917 $1,330,772 $1,330,772 $1,102,094 $1,657,334 $982,507 $982,507 $1,184,708 $960,000 $1,003,800 $1,003,800 $750,000 $1,298,000 $1,258,171 $1,258,171 $1,025,000 $1,235,302 $1,235,302 $1,153,421 $1,153,421 $962,375 $794,083 $794,083 $817,258 $817,258 $500,000 $716,500 $716,500 $756,125 $756,125 $825,304 $875,000 $875,000 $834,739 $706,600 $706,600 $706,600 $706,600 $820,727 $865,000 $865,000 $701,250 $942,286 $942,286 $766,042 $965,000 $965,000 $965,000 $960,000 $792,500 $880,000 $880,000 $1,255,000 $897,500 $846,700 $846,700 $929,500 $979,250 $1,230,000 $1,230,000 $1,132,500 $1,462,800 $947,500 $947,500 $1,151,000 $962,500 $1,065,000 $1,065,000 $750,000 $1,250,000 $1,230,000 $1,230,000 $1,025,000 $1,215,000 $1,215,000 $1,122,500 $1,122,500 $912,500 $792,500 $792,500 $800,000 $800,000 $500,000 $692,000 $692,000 $765,000 $765,000 $786,544 $875,000 $875,000 $825,000 $699,950 $699,950 $699,950 $699,950 $730,500 $865,000 $865,000 $701,250 $669,000 $669,000 $748,750 1,184 170 170 21 14 82 82 53 203 135 135 25 43 181 181 42 77 62 62 314 14 20 20 6 5 75 75 22 68 68 92 92 12 269 269 52 52 0 41 41 40 40 56 0 0 0 0 80 11 11 11 11 36 0 0 7 7 9 14 14 6 1,406 219 219 31 18 83 83 87 273 186 186 37 50 190 190 53 86 51 51 378 27 21 21 8 1 80 80 29 83 83 105 105 24 282 282 49 49 0 37 37 51 51 57 0 0 3 3 85 16 16 16 16 48 0 0 10 10 11 22 22 5 101% 100% 100% 102% 101% 100% 100% 99% 100% 99% 99% 98% 102% 100% 100% 103% 98% 103% 103% 102% 101% 102% 102% 96% 97% 105% 105% 105% 101% 101% 101% 101% 97% 101% 101% 102% 102% 100% 103% 103% 99% 99% 102% 97% 97% 100% 98% 98% 98% 98% 98% 110% 110% 98% 96% 96% 98% 19 17 17 14 21 16 16 19 21 22 22 43 14 20 20 18 20 22 22 17 14 15 15 45 10 14 14 25 20 20 19 19 19 21 21 13 13 9 9 9 56 56 14 22 22 23 4 4 4 4 32 16 16 54 29 29 31 Toronto Regional Real Estate Board SUMMARY OF EXISTING HOME TRANSACTIONS Att/Row/Townhouse, October 2023 Market Watch, October 2023 Copyright 2023 Toronto Regional Real Estate Board 11 ALL TRREB AREAS
- 12. Sales Dollar Volume Average Price Median Price New Listings Active Listings Avg. SP/LP Avg. LDOM Abc Abc Abc Abc Abc Abc Abc Abc Abc Abc Abc Abc Abc Abc Abc Abc Abc Abc Abc Abc Abc Abc Abc Abc Abc Abc Abc Abc Abc Abc Abc Abc Abc Abc Abc Abc Abc Abc Abc Abc All TRREB Areas All TRREB Areas City of Toronto City of Toronto Toronto West Toronto W01 Toronto W02 Toronto W02 Toronto W03 Toronto W03 Toronto W04 Toronto W05 Toronto W06 Toronto W06 Toronto W07 Toronto W07 Toronto W08 Toronto W09 Toronto W10 Toronto W10 Toronto Central Toronto Central Toronto C01 Toronto C02 Toronto C03 Toronto C03 Toronto C04 Toronto C04 Toronto C06 Toronto C07 Toronto C08 Toronto C08 Toronto C09 Toronto C09 Toronto C10 Toronto C11 Toronto C12 Toronto C12 Toronto C13 Toronto C13 Toronto C14 Toronto C15 Toronto East Toronto East Toronto E01 Toronto E01 Toronto E02 Toronto E03 Toronto E04 Toronto E04 Toronto E05 Toronto E05 Toronto E06 Toronto E07 Toronto E08 Toronto E08 Toronto E09 Toronto E09 Toronto E10 Toronto E11 402 402 61 61 14 2 2 2 0 0 3 2 3 3 0 0 0 1 1 1 29 29 12 7 1 1 1 1 0 1 3 3 2 2 0 0 0 0 1 1 1 0 18 18 4 4 3 3 3 3 1 1 0 1 0 0 0 0 1 2 $418,933,699 $418,933,699 $81,177,110 $81,177,110 $15,429,316 $3,030,316 $2,422,000 $2,422,000 $2,890,000 $2,080,000 $3,365,000 $3,365,000 $800,000 $842,000 $842,000 $48,062,677 $48,062,677 $17,111,821 $14,956,056 $2,300,000 $2,300,000 $1,279,000 $1,279,000 $1,360,000 $4,311,800 $4,311,800 $4,319,000 $4,319,000 $1,125,000 $1,125,000 $1,300,000 $17,685,117 $17,685,117 $4,542,999 $4,542,999 $3,345,118 $2,675,000 $2,805,000 $2,805,000 $760,000 $760,000 $950,000 $910,000 $1,697,000 $1,042,124 $1,042,124 $1,330,772 $1,330,772 $1,102,094 $1,515,158 $1,211,000 $1,211,000 $963,333 $1,040,000 $1,121,667 $1,121,667 $800,000 $842,000 $842,000 $1,657,334 $1,657,334 $1,425,985 $2,136,579 $2,300,000 $2,300,000 $1,279,000 $1,279,000 $1,360,000 $1,437,267 $1,437,267 $2,159,500 $2,159,500 $1,125,000 $1,125,000 $1,300,000 $982,507 $982,507 $1,135,750 $1,135,750 $1,115,039 $891,667 $935,000 $935,000 $760,000 $760,000 $950,000 $910,000 $848,500 $965,000 $965,000 $1,230,000 $1,230,000 $1,132,500 $1,515,158 $1,211,000 $1,211,000 $865,000 $1,040,000 $1,275,000 $1,275,000 $800,000 $842,000 $842,000 $1,462,800 $1,462,800 $1,469,900 $2,025,000 $2,300,000 $2,300,000 $1,279,000 $1,279,000 $1,360,000 $1,439,000 $1,439,000 $2,159,500 $2,159,500 $1,125,000 $1,125,000 $1,300,000 $947,500 $947,500 $1,136,500 $1,136,500 $1,210,118 $850,000 $945,000 $945,000 $760,000 $760,000 $950,000 $910,000 $848,500 1,184 1,184 181 181 42 2 10 10 4 4 3 12 3 3 2 2 4 0 2 2 77 77 30 12 1 1 1 1 0 1 13 13 2 2 4 0 3 3 2 2 5 3 62 62 24 24 11 2 8 8 4 4 0 1 2 2 1 1 2 7 1,406 1,406 190 190 53 6 15 15 3 3 2 17 1 1 3 3 4 2 0 0 86 86 28 14 2 2 2 2 0 3 15 15 1 1 4 1 2 2 3 3 9 2 51 51 16 16 5 2 9 9 4 4 0 0 2 2 1 1 5 7 101% 101% 100% 100% 103% 105% 101% 101% 102% 96% 106% 106% 98% 112% 112% 98% 98% 104% 94% 96% 96% 93% 93% 94% 101% 101% 95% 95% 95% 95% 94% 103% 103% 106% 106% 105% 99% 101% 101% 100% 100% 106% 104% 98% 19 19 20 20 18 3 25 25 15 36 12 12 35 8 8 20 20 8 20 109 109 45 45 31 9 9 21 21 50 50 27 22 22 24 24 7 24 17 17 16 16 13 18 56 Toronto Regional Real Estate Board SUMMARY OF EXISTING HOME TRANSACTIONS Att/Row/Townhouse, October 2023 Market Watch, October 2023 Copyright 2023 Toronto Regional Real Estate Board 12 City of Toronto Municipal Breakdown
- 13. Sales Dollar Volume Average Price Median Price New Listings Active Listings Avg. SP/LP Avg. LDOM Abc Abc Abc Abc Abc Abc Abc Abc Abc Abc Abc Abc Abc Abc Abc Abc Abc Abc Abc Abc Abc Abc Abc Abc Abc Abc Abc Abc Abc Abc Abc Abc Abc Abc Abc Abc Abc Abc Abc Abc Abc All TRREB Areas Halton Region Halton Region Burlington Halton Hills Milton Milton Oakville Peel Region Brampton Brampton Caledon Mississauga City of Toronto City of Toronto Toronto West Toronto Central Toronto East Toronto East York Region Aurora East Gwillimbury East Gwillimbury Georgina King Markham Markham Newmarket Richmond Hill Richmond Hill Vaughan Vaughan Stouffville Durham Region Durham Region Ajax Ajax Brock Clarington Clarington Oshawa Oshawa Pickering Scugog Scugog Uxbridge Uxbridge Whitby Dufferin County Dufferin County Orangeville Orangeville Simcoe County Adjala-Tosorontio Adjala-Tosorontio Bradford Bradford Essa Innisfil Innisfil New Tecumseth 324 43 43 23 3 7 7 10 102 27 27 0 75 101 101 41 32 28 28 40 6 0 0 0 0 13 13 3 7 7 9 9 2 37 37 4 4 0 2 2 11 11 17 0 0 1 1 2 1 1 1 1 0 0 0 0 0 0 0 0 0 $256,380,854 $35,289,500 $35,289,500 $19,454,400 $1,817,000 $6,447,100 $6,447,100 $7,571,000 $78,605,826 $19,238,500 $19,238,500 $59,367,326 $83,592,048 $83,592,048 $34,570,300 $28,527,150 $20,494,598 $20,494,598 $33,184,480 $5,016,000 $11,528,500 $11,528,500 $2,265,000 $5,888,000 $5,888,000 $7,118,980 $7,118,980 $1,368,000 $25,134,000 $25,134,000 $2,721,000 $2,721,000 $1,440,000 $1,440,000 $6,869,000 $6,869,000 $11,614,000 $825,000 $825,000 $1,665,000 $575,000 $575,000 $575,000 $575,000 $791,299 $820,686 $820,686 $845,843 $605,667 $921,014 $921,014 $757,100 $770,645 $712,537 $712,537 $791,564 $827,644 $827,644 $843,178 $891,473 $731,950 $731,950 $829,612 $836,000 $886,808 $886,808 $755,000 $841,143 $841,143 $790,998 $790,998 $684,000 $679,297 $679,297 $680,250 $680,250 $720,000 $720,000 $624,455 $624,455 $683,176 $825,000 $825,000 $832,500 $575,000 $575,000 $575,000 $575,000 $750,000 $750,000 $750,000 $750,000 $567,000 $825,000 $825,000 $765,550 $768,298 $710,000 $710,000 $792,000 $760,000 $760,000 $770,000 $771,825 $750,000 $750,000 $810,000 $759,500 $835,000 $835,000 $690,000 $830,000 $830,000 $780,000 $780,000 $684,000 $661,000 $661,000 $688,000 $688,000 $720,000 $720,000 $600,000 $600,000 $667,000 $825,000 $825,000 $832,500 $575,000 $575,000 $575,000 $575,000 1,011 92 92 47 9 11 11 25 290 86 86 2 202 336 336 113 130 93 93 150 10 0 0 0 0 51 51 16 30 30 37 37 6 134 134 18 18 2 11 11 45 45 41 0 0 2 2 15 6 6 6 6 3 0 0 0 0 0 0 0 3 1,399 131 131 54 14 16 16 47 390 116 116 1 273 500 500 178 194 128 128 210 15 0 0 0 0 59 59 30 45 45 55 55 6 152 152 20 20 1 12 12 52 52 52 0 0 1 1 14 8 8 8 8 8 0 0 0 0 0 2 2 6 99% 97% 97% 98% 99% 95% 95% 97% 99% 100% 100% 99% 100% 100% 100% 98% 101% 101% 100% 100% 99% 99% 99% 101% 101% 100% 100% 99% 102% 102% 107% 107% 107% 107% 99% 99% 102% 103% 103% 102% 96% 96% 96% 96% 25 23 23 22 17 31 31 25 24 30 30 22 26 26 29 26 22 22 24 23 19 19 28 19 19 36 36 12 25 25 13 13 7 7 37 37 22 2 2 32 20 20 20 20 Toronto Regional Real Estate Board SUMMARY OF EXISTING HOME TRANSACTIONS Condo Townhouse, October 2023 Market Watch, October 2023 Copyright 2023 Toronto Regional Real Estate Board 13 ALL TRREB AREAS
- 14. Sales Dollar Volume Average Price Median Price New Listings Active Listings Avg. SP/LP Avg. LDOM Abc Abc Abc Abc Abc Abc Abc Abc Abc Abc Abc Abc Abc Abc Abc Abc Abc Abc Abc Abc Abc Abc Abc Abc Abc Abc Abc Abc Abc Abc Abc Abc Abc Abc Abc Abc Abc Abc Abc Abc All TRREB Areas All TRREB Areas City of Toronto City of Toronto Toronto West Toronto W01 Toronto W02 Toronto W02 Toronto W03 Toronto W03 Toronto W04 Toronto W05 Toronto W06 Toronto W06 Toronto W07 Toronto W07 Toronto W08 Toronto W09 Toronto W10 Toronto W10 Toronto Central Toronto Central Toronto C01 Toronto C02 Toronto C03 Toronto C03 Toronto C04 Toronto C04 Toronto C06 Toronto C07 Toronto C08 Toronto C08 Toronto C09 Toronto C09 Toronto C10 Toronto C11 Toronto C12 Toronto C12 Toronto C13 Toronto C13 Toronto C14 Toronto C15 Toronto East Toronto East Toronto E01 Toronto E01 Toronto E02 Toronto E03 Toronto E04 Toronto E04 Toronto E05 Toronto E05 Toronto E06 Toronto E07 Toronto E08 Toronto E08 Toronto E09 Toronto E09 Toronto E10 Toronto E11 324 324 101 101 41 3 5 5 1 1 7 7 11 11 0 0 5 0 2 2 32 32 6 2 0 0 0 0 0 0 6 6 0 0 1 2 0 0 2 2 4 9 28 28 2 2 1 0 2 2 4 4 1 2 4 4 3 3 4 5 $256,380,854 $256,380,854 $83,592,048 $83,592,048 $34,570,300 $2,679,000 $4,622,000 $4,622,000 $762,500 $762,500 $4,381,900 $4,482,000 $11,217,000 $11,217,000 $4,950,900 $1,475,000 $1,475,000 $28,527,150 $28,527,150 $5,103,000 $2,759,900 $5,591,000 $5,591,000 $1,495,000 $1,046,000 $1,191,000 $1,191,000 $3,963,250 $7,378,000 $20,494,598 $20,494,598 $1,687,000 $1,687,000 $980,000 $1,190,500 $1,190,500 $3,214,000 $3,214,000 $750,000 $1,539,000 $3,079,000 $3,079,000 $2,188,000 $2,188,000 $2,635,098 $3,232,000 $791,299 $791,299 $827,644 $827,644 $843,178 $893,000 $924,400 $924,400 $762,500 $762,500 $625,986 $640,286 $1,019,727 $1,019,727 $990,180 $737,500 $737,500 $891,473 $891,473 $850,500 $1,379,950 $931,833 $931,833 $1,495,000 $523,000 $595,500 $595,500 $990,813 $819,778 $731,950 $731,950 $843,500 $843,500 $980,000 $595,250 $595,250 $803,500 $803,500 $750,000 $769,500 $769,750 $769,750 $729,333 $729,333 $658,775 $646,400 $750,000 $750,000 $760,000 $760,000 $770,000 $855,000 $920,000 $920,000 $762,500 $762,500 $622,000 $705,000 $895,000 $895,000 $850,000 $737,500 $737,500 $771,825 $771,825 $830,250 $1,379,950 $898,000 $898,000 $1,495,000 $523,000 $595,500 $595,500 $1,019,125 $759,000 $750,000 $750,000 $843,500 $843,500 $980,000 $595,250 $595,250 $820,500 $820,500 $750,000 $769,500 $819,500 $819,500 $750,000 $750,000 $722,500 $647,000 1,011 1,011 336 336 113 7 11 11 8 8 17 21 21 21 0 0 15 6 7 7 130 130 34 8 0 0 1 1 6 4 17 17 5 5 3 2 6 6 6 6 16 22 93 93 12 12 2 1 7 7 13 13 5 7 7 7 12 12 12 15 1,399 1,399 500 500 178 4 14 14 11 11 30 43 32 32 0 0 24 11 9 9 194 194 44 22 0 0 4 4 15 13 18 18 4 4 3 6 9 9 9 9 21 26 128 128 12 12 1 2 12 12 21 21 4 11 12 12 10 10 16 27 99% 99% 100% 100% 100% 105% 102% 102% 110% 110% 98% 102% 99% 99% 96% 98% 98% 98% 98% 98% 93% 102% 102% 100% 100% 101% 101% 97% 98% 101% 101% 100% 100% 109% 100% 100% 102% 102% 99% 106% 97% 97% 107% 107% 100% 99% 25 25 26 26 29 9 19 19 13 13 43 27 30 30 33 26 26 26 26 17 19 28 28 5 12 66 66 32 27 22 22 46 46 3 23 23 16 16 4 11 26 26 19 19 32 22 Toronto Regional Real Estate Board SUMMARY OF EXISTING HOME TRANSACTIONS Condo Townhouse, October 2023 Market Watch, October 2023 Copyright 2023 Toronto Regional Real Estate Board 14 City of Toronto Municipal Breakdown
- 15. Sales Dollar Volume Average Price Median Price New Listings Active Listings Avg. SP/LP Avg. LDOM Abc Abc Abc Abc Abc Abc Abc Abc Abc Abc Abc Abc Abc Abc Abc Abc Abc Abc Abc Abc Abc Abc Abc Abc Abc Abc Abc Abc Abc Abc Abc Abc Abc Abc Abc Abc Abc Abc Abc Abc Abc All TRREB Areas Halton Region Halton Region Burlington Halton Hills Milton Milton Oakville Peel Region Brampton Brampton Caledon Mississauga City of Toronto City of Toronto Toronto West Toronto Central Toronto East Toronto East York Region Aurora East Gwillimbury East Gwillimbury Georgina King Markham Markham Newmarket Richmond Hill Richmond Hill Vaughan Vaughan Stouffville Durham Region Durham Region Ajax Ajax Brock Clarington Clarington Oshawa Oshawa Pickering Scugog Scugog Uxbridge Uxbridge Whitby Dufferin County Dufferin County Orangeville Orangeville Simcoe County Adjala-Tosorontio Adjala-Tosorontio Bradford Bradford Essa Innisfil Innisfil New Tecumseth 1,296 74 74 29 1 14 14 30 118 14 14 2 102 883 883 196 569 118 118 179 4 0 0 0 1 53 53 5 40 40 73 73 3 37 37 5 5 0 7 7 5 5 13 0 0 0 0 7 2 2 2 2 3 0 0 0 0 0 0 0 3 $918,579,127 $52,086,767 $52,086,767 $18,147,000 $470,000 $9,128,611 $9,128,611 $24,341,156 $72,646,288 $7,266,000 $7,266,000 $1,464,000 $63,916,288 $643,848,401 $643,848,401 $130,579,250 $446,134,987 $67,134,164 $67,134,164 $123,648,981 $2,080,000 $650,000 $39,273,988 $39,273,988 $3,167,990 $26,052,300 $26,052,300 $49,774,713 $49,774,713 $2,649,990 $23,232,690 $23,232,690 $3,007,500 $3,007,500 $4,394,890 $4,394,890 $2,291,400 $2,291,400 $8,354,000 $5,184,900 $1,290,000 $1,290,000 $1,290,000 $1,290,000 $1,826,000 $1,826,000 $708,780 $703,875 $703,875 $625,759 $470,000 $652,044 $652,044 $811,372 $615,647 $519,000 $519,000 $732,000 $626,630 $729,160 $729,160 $666,221 $784,069 $568,934 $568,934 $690,776 $520,000 $650,000 $741,019 $741,019 $633,598 $651,308 $651,308 $681,845 $681,845 $883,330 $627,911 $627,911 $601,500 $601,500 $627,841 $627,841 $458,280 $458,280 $642,615 $740,700 $645,000 $645,000 $645,000 $645,000 $608,667 $608,667 $640,000 $609,159 $609,159 $537,000 $470,000 $660,000 $660,000 $642,584 $584,500 $509,500 $509,500 $732,000 $589,500 $650,000 $650,000 $610,000 $695,000 $550,000 $550,000 $640,000 $537,500 $650,000 $685,000 $685,000 $535,000 $630,000 $630,000 $638,000 $638,000 $859,000 $575,000 $575,000 $565,000 $565,000 $599,900 $599,900 $395,000 $395,000 $575,000 $695,000 $645,000 $645,000 $645,000 $645,000 $605,000 $605,000 4,588 255 255 103 4 46 46 102 478 81 81 2 395 3,193 3,193 620 2,206 367 367 532 17 1 1 3 8 149 149 7 126 126 206 206 15 103 103 8 8 0 21 21 30 30 28 1 1 1 1 14 4 4 4 4 23 0 0 1 1 0 17 17 5 6,959 409 409 145 6 76 76 182 760 131 131 1 628 4,825 4,825 942 3,375 508 508 764 19 1 1 3 11 194 194 18 162 162 337 337 19 138 138 8 8 0 35 35 44 44 29 1 1 1 1 20 5 5 5 5 58 0 0 3 3 0 40 40 15 98% 97% 97% 97% 98% 98% 98% 98% 98% 98% 98% 99% 98% 99% 99% 99% 98% 100% 100% 98% 95% 94% 99% 99% 98% 99% 99% 98% 98% 98% 99% 99% 101% 101% 98% 98% 98% 98% 99% 98% 95% 95% 95% 95% 96% 96% 26 38 38 40 45 42 42 33 29 32 32 16 29 25 25 28 24 22 22 26 29 36 20 20 74 27 27 26 26 20 23 23 8 8 22 22 21 21 28 25 26 26 26 26 51 51 Toronto Regional Real Estate Board SUMMARY OF EXISTING HOME TRANSACTIONS Condo Apartment, October 2023 Market Watch, October 2023 Copyright 2023 Toronto Regional Real Estate Board 15 ALL TRREB AREAS
- 16. Sales Dollar Volume Average Price Median Price New Listings Active Listings Avg. SP/LP Avg. LDOM Abc Abc Abc Abc Abc Abc Abc Abc Abc Abc Abc Abc Abc Abc Abc Abc Abc Abc Abc Abc Abc Abc Abc Abc Abc Abc Abc Abc Abc Abc Abc Abc Abc Abc Abc Abc Abc Abc Abc Abc All TRREB Areas All TRREB Areas City of Toronto City of Toronto Toronto West Toronto W01 Toronto W02 Toronto W02 Toronto W03 Toronto W03 Toronto W04 Toronto W05 Toronto W06 Toronto W06 Toronto W07 Toronto W07 Toronto W08 Toronto W09 Toronto W10 Toronto W10 Toronto Central Toronto Central Toronto C01 Toronto C02 Toronto C03 Toronto C03 Toronto C04 Toronto C04 Toronto C06 Toronto C07 Toronto C08 Toronto C08 Toronto C09 Toronto C09 Toronto C10 Toronto C11 Toronto C12 Toronto C12 Toronto C13 Toronto C13 Toronto C14 Toronto C15 Toronto East Toronto East Toronto E01 Toronto E01 Toronto E02 Toronto E03 Toronto E04 Toronto E04 Toronto E05 Toronto E05 Toronto E06 Toronto E07 Toronto E08 Toronto E08 Toronto E09 Toronto E09 Toronto E10 Toronto E11 1,296 1,296 883 883 196 16 8 8 5 5 24 15 43 43 3 3 56 12 14 14 569 569 199 36 5 5 10 10 10 26 109 109 7 7 31 17 2 2 24 24 42 51 118 118 15 15 7 10 12 12 22 22 5 9 8 8 17 17 1 12 $918,579,127 $918,579,127 $643,848,401 $643,848,401 $130,579,250 $11,580,000 $6,504,600 $6,504,600 $3,453,000 $3,453,000 $13,949,800 $6,418,500 $31,599,350 $31,599,350 $2,120,000 $2,120,000 $40,132,000 $7,324,500 $7,497,500 $7,497,500 $446,134,987 $446,134,987 $149,978,626 $42,507,500 $3,933,900 $3,933,900 $9,689,800 $9,689,800 $6,194,500 $18,682,888 $76,251,819 $76,251,819 $8,214,000 $8,214,000 $26,996,099 $9,942,000 $10,015,000 $10,015,000 $16,115,101 $16,115,101 $31,674,738 $35,939,016 $67,134,164 $67,134,164 $9,742,499 $9,742,499 $4,433,000 $4,736,000 $6,495,399 $6,495,399 $13,436,300 $13,436,300 $2,651,509 $5,435,380 $4,322,000 $4,322,000 $9,576,689 $9,576,689 $330,000 $5,975,388 $708,780 $708,780 $729,160 $729,160 $666,221 $723,750 $813,075 $813,075 $690,600 $690,600 $581,242 $427,900 $734,869 $734,869 $706,667 $706,667 $716,643 $610,375 $535,536 $535,536 $784,069 $784,069 $753,661 $1,180,764 $786,780 $786,780 $968,980 $968,980 $619,450 $718,573 $699,558 $699,558 $1,173,429 $1,173,429 $870,842 $584,824 $5,007,500 $5,007,500 $671,463 $671,463 $754,160 $704,687 $568,934 $568,934 $649,500 $649,500 $633,286 $473,600 $541,283 $541,283 $610,741 $610,741 $530,302 $603,931 $540,250 $540,250 $563,335 $563,335 $330,000 $497,949 $640,000 $640,000 $650,000 $650,000 $610,000 $705,500 $659,500 $659,500 $698,000 $698,000 $562,500 $475,000 $668,000 $668,000 $655,000 $655,000 $636,250 $607,500 $517,500 $517,500 $695,000 $695,000 $690,000 $1,035,000 $856,900 $856,900 $717,500 $717,500 $621,750 $732,500 $646,000 $646,000 $990,000 $990,000 $850,000 $590,000 $5,007,500 $5,007,500 $657,500 $657,500 $702,500 $688,000 $550,000 $550,000 $615,000 $615,000 $596,000 $477,000 $525,000 $525,000 $607,750 $607,750 $530,509 $620,000 $557,000 $557,000 $546,000 $546,000 $330,000 $500,000 4,588 4,588 3,193 3,193 620 66 39 39 12 12 52 39 163 163 24 24 169 25 31 31 2,206 2,206 833 128 48 48 28 28 33 96 505 505 19 19 138 46 4 4 54 54 130 144 367 367 39 39 27 13 38 38 51 51 18 44 48 48 54 54 5 30 6,959 6,959 4,825 4,825 942 88 65 65 26 26 83 79 243 243 31 31 245 33 49 49 3,375 3,375 1,310 214 60 60 45 45 57 147 761 761 28 28 182 72 10 10 80 80 192 217 508 508 47 47 34 17 54 54 80 80 34 61 53 53 72 72 9 47 98% 98% 99% 99% 99% 102% 102% 102% 98% 98% 99% 97% 98% 98% 95% 95% 98% 99% 100% 100% 98% 98% 99% 96% 104% 104% 97% 97% 99% 101% 99% 99% 95% 95% 97% 97% 99% 99% 99% 99% 97% 99% 100% 100% 98% 98% 100% 98% 101% 101% 100% 100% 98% 100% 100% 100% 104% 104% 87% 98% 26 26 25 25 28 23 23 23 15 15 32 40 34 34 24 24 22 28 26 26 24 24 24 21 23 23 19 19 25 19 22 22 30 30 23 24 82 82 32 32 33 21 22 22 16 16 14 41 20 20 23 23 23 25 17 17 15 15 74 24 Toronto Regional Real Estate Board SUMMARY OF EXISTING HOME TRANSACTIONS Condo Apartment, October 2023 Market Watch, October 2023 Copyright 2023 Toronto Regional Real Estate Board 16 City of Toronto Municipal Breakdown
- 17. Sales Dollar Volume Average Price Median Price New Listings Active Listings Avg. SP/LP Avg. LDOM Abc Abc Abc Abc Abc Abc Abc Abc Abc Abc Abc Abc Abc Abc Abc Abc Abc Abc Abc Abc Abc Abc Abc Abc Abc Abc Abc Abc Abc Abc Abc Abc Abc Abc Abc Abc Abc Abc Abc Abc Abc All TRREB Areas Halton Region Halton Region Burlington Halton Hills Milton Milton Oakville Peel Region Brampton Brampton Caledon Mississauga City of Toronto City of Toronto Toronto West Toronto Central Toronto East Toronto East York Region Aurora East Gwillimbury East Gwillimbury Georgina King Markham Markham Newmarket Richmond Hill Richmond Hill Vaughan Vaughan Stouffville Durham Region Durham Region Ajax Ajax Brock Clarington Clarington Oshawa Oshawa Pickering Scugog Scugog Uxbridge Uxbridge Whitby Dufferin County Dufferin County Orangeville Orangeville Simcoe County Adjala-Tosorontio Adjala-Tosorontio Bradford Bradford Essa Innisfil Innisfil New Tecumseth 24 3 3 1 0 1 1 1 2 1 1 0 1 0 0 0 0 0 0 12 0 0 0 0 0 9 9 0 1 1 2 2 0 4 4 0 0 0 2 2 1 1 0 0 0 0 0 1 0 0 0 0 3 0 0 1 1 1 0 0 1 $26,709,576 $3,610,000 $3,610,000 $1,230,000 $1,200,000 $1,200,000 $1,180,000 $2,058,000 $1,063,000 $1,063,000 $995,000 $15,307,576 $11,364,576 $11,364,576 $1,225,000 $1,225,000 $2,718,000 $2,718,000 $3,415,000 $3,415,000 $1,845,000 $1,845,000 $595,000 $595,000 $975,000 $2,319,000 $844,000 $844,000 $730,000 $745,000 $1,112,899 $1,203,333 $1,203,333 $1,230,000 $1,200,000 $1,200,000 $1,180,000 $1,029,000 $1,063,000 $1,063,000 $995,000 $1,275,631 $1,262,731 $1,262,731 $1,225,000 $1,225,000 $1,359,000 $1,359,000 $853,750 $853,750 $922,500 $922,500 $595,000 $595,000 $975,000 $773,000 $844,000 $844,000 $730,000 $745,000 $1,155,000 $1,200,000 $1,200,000 $1,230,000 $1,200,000 $1,200,000 $1,180,000 $1,029,000 $1,063,000 $1,063,000 $995,000 $1,298,444 $1,288,000 $1,288,000 $1,225,000 $1,225,000 $1,359,000 $1,359,000 $847,500 $847,500 $922,500 $922,500 $595,000 $595,000 $975,000 $745,000 $844,000 $844,000 $730,000 $745,000 62 9 9 4 0 1 1 4 6 3 3 0 3 4 4 0 1 3 3 17 0 0 0 0 0 9 9 0 2 2 5 5 1 15 15 0 0 0 13 13 2 2 0 0 0 0 0 0 0 0 0 0 11 0 0 3 3 3 1 1 4 60 11 11 4 0 3 3 4 6 3 3 0 3 4 4 0 1 3 3 19 0 0 0 0 0 9 9 0 5 5 4 4 1 11 11 0 0 0 8 8 1 1 0 0 0 0 0 2 1 1 1 1 8 0 0 2 2 3 1 1 2 103% 102% 102% 100% 109% 109% 97% 98% 97% 97% 100% 107% 108% 108% 96% 96% 106% 106% 98% 98% 98% 98% 99% 99% 98% 99% 98% 98% 100% 99% 17 8 8 6 14 14 5 13 23 23 2 18 21 21 16 16 5 5 19 19 8 8 38 38 21 22 34 34 11 22 Toronto Regional Real Estate Board SUMMARY OF EXISTING HOME TRANSACTIONS Link, October 2023 Market Watch, October 2023 Copyright 2023 Toronto Regional Real Estate Board 17 ALL TRREB AREAS
- 18. Sales Dollar Volume Average Price Median Price New Listings Active Listings Avg. SP/LP Avg. LDOM Abc Abc Abc Abc Abc Abc Abc Abc Abc Abc Abc Abc Abc Abc Abc Abc Abc Abc Abc Abc Abc Abc Abc Abc Abc Abc Abc Abc Abc Abc Abc Abc Abc Abc Abc Abc Abc Abc Abc Abc All TRREB Areas All TRREB Areas City of Toronto City of Toronto Toronto West Toronto W01 Toronto W02 Toronto W02 Toronto W03 Toronto W03 Toronto W04 Toronto W05 Toronto W06 Toronto W06 Toronto W07 Toronto W07 Toronto W08 Toronto W09 Toronto W10 Toronto W10 Toronto Central Toronto Central Toronto C01 Toronto C02 Toronto C03 Toronto C03 Toronto C04 Toronto C04 Toronto C06 Toronto C07 Toronto C08 Toronto C08 Toronto C09 Toronto C09 Toronto C10 Toronto C11 Toronto C12 Toronto C12 Toronto C13 Toronto C13 Toronto C14 Toronto C15 Toronto East Toronto East Toronto E01 Toronto E01 Toronto E02 Toronto E03 Toronto E04 Toronto E04 Toronto E05 Toronto E05 Toronto E06 Toronto E07 Toronto E08 Toronto E08 Toronto E09 Toronto E09 Toronto E10 Toronto E11 24 24 0 0 0 0 0 0 0 0 0 0 0 0 0 0 0 0 0 0 0 0 0 0 0 0 0 0 0 0 0 0 0 0 0 0 0 0 0 0 0 0 0 0 0 0 0 0 0 0 0 0 0 0 0 0 0 0 0 0 $26,709,576 $26,709,576 $1,112,899 $1,112,899 $1,155,000 $1,155,000 62 62 4 4 0 0 0 0 0 0 0 0 0 0 0 0 0 0 0 0 1 1 0 0 0 0 0 0 0 0 0 0 0 0 0 0 0 0 0 0 0 1 3 3 0 0 0 0 0 0 2 2 0 1 0 0 0 0 0 0 60 60 4 4 0 0 0 0 0 0 0 0 0 0 0 0 0 0 0 0 1 1 0 0 0 0 0 0 0 0 0 0 0 0 0 0 0 0 0 0 0 1 3 3 0 0 0 0 0 0 2 2 0 1 0 0 0 0 0 0 103% 103% 17 17 Toronto Regional Real Estate Board SUMMARY OF EXISTING HOME TRANSACTIONS Link, October 2023 Market Watch, October 2023 Copyright 2023 Toronto Regional Real Estate Board 18 City of Toronto Municipal Breakdown
- 19. Sales Dollar Volume Average Price Median Price New Listings Active Listings Avg. SP/LP Avg. LDOM Abc Abc Abc Abc Abc Abc Abc Abc Abc Abc Abc Abc Abc Abc Abc Abc Abc Abc Abc Abc Abc Abc Abc Abc Abc Abc Abc Abc Abc Abc Abc Abc Abc Abc Abc Abc Abc Abc Abc Abc Abc All TRREB Areas Halton Region Halton Region Burlington Halton Hills Milton Milton Oakville Peel Region Brampton Brampton Caledon Mississauga City of Toronto City of Toronto Toronto West Toronto Central Toronto East Toronto East York Region Aurora East Gwillimbury East Gwillimbury Georgina King Markham Markham Newmarket Richmond Hill Richmond Hill Vaughan Vaughan Stouffville Durham Region Durham Region Ajax Ajax Brock Clarington Clarington Oshawa Oshawa Pickering Scugog Scugog Uxbridge Uxbridge Whitby Dufferin County Dufferin County Orangeville Orangeville Simcoe County Adjala-Tosorontio Adjala-Tosorontio Bradford Bradford Essa Innisfil Innisfil New Tecumseth 8 0 0 0 0 0 0 0 0 0 0 0 0 7 7 2 5 0 0 1 0 0 0 0 0 1 1 0 0 0 0 0 0 0 0 0 0 0 0 0 0 0 0 0 0 0 0 0 0 0 0 0 0 0 0 0 0 0 0 0 0 $5,631,900 $4,926,900 $4,926,900 $729,900 $4,197,000 $705,000 $705,000 $705,000 $703,988 $703,843 $703,843 $364,950 $839,400 $705,000 $705,000 $705,000 $687,500 $685,000 $685,000 $364,950 $690,000 $705,000 $705,000 $705,000 21 0 0 0 0 0 0 0 0 0 0 0 0 21 21 4 9 8 8 0 0 0 0 0 0 0 0 0 0 0 0 0 0 0 0 0 0 0 0 0 0 0 0 0 0 0 0 0 0 0 0 0 0 0 0 0 0 0 0 0 0 32 1 1 1 0 0 0 0 1 0 0 0 1 30 30 7 11 12 12 0 0 0 0 0 0 0 0 0 0 0 0 0 0 0 0 0 0 0 0 0 0 0 0 0 0 0 0 0 0 0 0 0 0 0 0 0 0 0 0 0 0 103% 105% 105% 99% 106% 94% 94% 94% 22 22 22 31 19 21 21 21 Toronto Regional Real Estate Board SUMMARY OF EXISTING HOME TRANSACTIONS Co-Op Apartment, October 2023 Market Watch, October 2023 Copyright 2023 Toronto Regional Real Estate Board 19 ALL TRREB AREAS
- 20. Sales Dollar Volume Average Price Median Price New Listings Active Listings Avg. SP/LP Avg. LDOM Abc Abc Abc Abc Abc Abc Abc Abc Abc Abc Abc Abc Abc Abc Abc Abc Abc Abc Abc Abc Abc Abc Abc Abc Abc Abc Abc Abc Abc Abc Abc Abc Abc Abc Abc Abc Abc Abc Abc Abc All TRREB Areas All TRREB Areas City of Toronto City of Toronto Toronto West Toronto W01 Toronto W02 Toronto W02 Toronto W03 Toronto W03 Toronto W04 Toronto W05 Toronto W06 Toronto W06 Toronto W07 Toronto W07 Toronto W08 Toronto W09 Toronto W10 Toronto W10 Toronto Central Toronto Central Toronto C01 Toronto C02 Toronto C03 Toronto C03 Toronto C04 Toronto C04 Toronto C06 Toronto C07 Toronto C08 Toronto C08 Toronto C09 Toronto C09 Toronto C10 Toronto C11 Toronto C12 Toronto C12 Toronto C13 Toronto C13 Toronto C14 Toronto C15 Toronto East Toronto East Toronto E01 Toronto E01 Toronto E02 Toronto E03 Toronto E04 Toronto E04 Toronto E05 Toronto E05 Toronto E06 Toronto E07 Toronto E08 Toronto E08 Toronto E09 Toronto E09 Toronto E10 Toronto E11 8 8 7 7 2 0 0 0 0 0 0 1 0 0 0 0 1 0 0 0 5 5 0 0 0 0 0 0 0 0 0 0 4 4 1 0 0 0 0 0 0 0 0 0 0 0 0 0 0 0 0 0 0 0 0 0 0 0 0 0 $5,631,900 $5,631,900 $4,926,900 $4,926,900 $729,900 $305,000 $424,900 $4,197,000 $4,197,000 $3,507,000 $3,507,000 $690,000 $703,988 $703,988 $703,843 $703,843 $364,950 $305,000 $424,900 $839,400 $839,400 $876,750 $876,750 $690,000 $687,500 $687,500 $685,000 $685,000 $364,950 $305,000 $424,900 $690,000 $690,000 $867,500 $867,500 $690,000 21 21 21 21 4 0 0 0 0 0 0 1 3 3 0 0 0 0 0 0 9 9 0 1 2 2 0 0 0 0 0 0 6 6 0 0 0 0 0 0 0 0 8 8 0 0 2 0 1 1 0 0 0 0 0 0 0 0 5 0 32 32 30 30 7 0 0 0 0 0 0 0 4 4 0 0 1 2 0 0 11 11 0 1 1 1 1 1 0 0 0 0 8 8 0 0 0 0 0 0 0 0 12 12 0 0 2 0 1 1 1 1 0 0 0 0 0 0 8 0 103% 103% 105% 105% 99% 97% 100% 106% 106% 107% 107% 101% 22 22 22 22 31 17 45 19 19 16 16 30 Toronto Regional Real Estate Board SUMMARY OF EXISTING HOME TRANSACTIONS Co-Op Apartment, October 2023 Market Watch, October 2023 Copyright 2023 Toronto Regional Real Estate Board 20 City of Toronto Municipal Breakdown
- 21. Sales Dollar Volume Average Price Median Price New Listings Active Listings Avg. SP/LP Avg. LDOM Abc Abc Abc Abc Abc Abc Abc Abc Abc Abc Abc Abc Abc Abc Abc Abc Abc Abc Abc Abc Abc Abc Abc Abc Abc Abc Abc Abc Abc Abc Abc Abc Abc Abc Abc Abc Abc Abc Abc Abc Abc All TRREB Areas Halton Region Halton Region Burlington Halton Hills Milton Milton Oakville Peel Region Brampton Brampton Caledon Mississauga City of Toronto City of Toronto Toronto West Toronto Central Toronto East Toronto East York Region Aurora East Gwillimbury East Gwillimbury Georgina King Markham Markham Newmarket Richmond Hill Richmond Hill Vaughan Vaughan Stouffville Durham Region Durham Region Ajax Ajax Brock Clarington Clarington Oshawa Oshawa Pickering Scugog Scugog Uxbridge Uxbridge Whitby Dufferin County Dufferin County Orangeville Orangeville Simcoe County Adjala-Tosorontio Adjala-Tosorontio Bradford Bradford Essa Innisfil Innisfil New Tecumseth 4 0 0 0 0 0 0 0 1 1 1 0 0 1 1 0 0 1 1 0 0 0 0 0 0 0 0 0 0 0 0 0 0 0 0 0 0 0 0 0 0 0 0 0 0 0 0 0 0 0 0 0 2 0 0 0 0 0 0 0 2 $3,330,000 $935,000 $935,000 $935,000 $150,000 $150,000 $150,000 $150,000 $2,245,000 $2,245,000 $832,500 $935,000 $935,000 $935,000 $150,000 $150,000 $150,000 $150,000 $1,122,500 $1,122,500 $990,000 $935,000 $935,000 $935,000 $150,000 $150,000 $150,000 $150,000 $1,122,500 $1,122,500 15 5 5 5 0 0 0 0 5 5 5 0 0 0 0 0 0 0 0 1 0 0 0 0 0 1 1 0 0 0 0 0 0 0 0 0 0 0 0 0 0 0 0 0 0 0 0 0 0 0 0 0 4 0 0 0 0 0 0 0 4 24 4 4 3 0 0 0 1 7 6 6 0 1 2 2 1 0 1 1 1 0 0 0 0 0 1 1 0 0 0 0 0 0 0 0 0 0 0 0 0 0 0 0 0 0 0 0 0 0 0 0 0 10 0 0 0 0 0 0 0 10 95% 94% 94% 94% 94% 94% 94% 94% 95% 95% 27 11 11 11 34 34 34 34 31 31 Toronto Regional Real Estate Board SUMMARY OF EXISTING HOME TRANSACTIONS Detached Condo, October 2023 Market Watch, October 2023 Copyright 2023 Toronto Regional Real Estate Board 21 ALL TRREB AREAS
- 22. Sales Dollar Volume Average Price Median Price New Listings Active Listings Avg. SP/LP Avg. LDOM Abc Abc Abc Abc Abc Abc Abc Abc Abc Abc Abc Abc Abc Abc Abc Abc Abc Abc Abc Abc Abc Abc Abc Abc Abc Abc Abc Abc Abc Abc Abc Abc Abc Abc Abc Abc Abc Abc Abc Abc All TRREB Areas All TRREB Areas City of Toronto City of Toronto Toronto West Toronto W01 Toronto W02 Toronto W02 Toronto W03 Toronto W03 Toronto W04 Toronto W05 Toronto W06 Toronto W06 Toronto W07 Toronto W07 Toronto W08 Toronto W09 Toronto W10 Toronto W10 Toronto Central Toronto Central Toronto C01 Toronto C02 Toronto C03 Toronto C03 Toronto C04 Toronto C04 Toronto C06 Toronto C07 Toronto C08 Toronto C08 Toronto C09 Toronto C09 Toronto C10 Toronto C11 Toronto C12 Toronto C12 Toronto C13 Toronto C13 Toronto C14 Toronto C15 Toronto East Toronto East Toronto E01 Toronto E01 Toronto E02 Toronto E03 Toronto E04 Toronto E04 Toronto E05 Toronto E05 Toronto E06 Toronto E07 Toronto E08 Toronto E08 Toronto E09 Toronto E09 Toronto E10 Toronto E11 4 4 1 1 0 0 0 0 0 0 0 0 0 0 0 0 0 0 0 0 0 0 0 0 0 0 0 0 0 0 0 0 0 0 0 0 0 0 0 0 0 0 1 1 0 0 0 0 0 0 0 0 0 0 1 1 0 0 0 0 $3,330,000 $3,330,000 $150,000 $150,000 $150,000 $150,000 $150,000 $150,000 $832,500 $832,500 $150,000 $150,000 $150,000 $150,000 $150,000 $150,000 $990,000 $990,000 $150,000 $150,000 $150,000 $150,000 $150,000 $150,000 15 15 0 0 0 0 0 0 0 0 0 0 0 0 0 0 0 0 0 0 0 0 0 0 0 0 0 0 0 0 0 0 0 0 0 0 0 0 0 0 0 0 0 0 0 0 0 0 0 0 0 0 0 0 0 0 0 0 0 0 24 24 2 2 1 0 0 0 0 0 1 0 0 0 0 0 0 0 0 0 0 0 0 0 0 0 0 0 0 0 0 0 0 0 0 0 0 0 0 0 0 0 1 1 0 0 0 0 0 0 0 0 0 0 1 1 0 0 0 0 95% 95% 94% 94% 94% 94% 94% 94% 27 27 34 34 34 34 34 34 Toronto Regional Real Estate Board SUMMARY OF EXISTING HOME TRANSACTIONS Detached Condo, October 2023 Market Watch, October 2023 Copyright 2023 Toronto Regional Real Estate Board 22 City of Toronto Municipal Breakdown
- 23. Sales Dollar Volume Average Price Median Price New Listings Active Listings Avg. SP/LP Avg. LDOM Abc Abc Abc Abc Abc Abc Abc Abc Abc Abc Abc Abc Abc Abc Abc Abc Abc Abc Abc Abc Abc Abc Abc Abc Abc Abc Abc Abc Abc Abc Abc Abc Abc Abc Abc Abc Abc Abc Abc Abc Abc All TRREB Areas Halton Region Halton Region Burlington Halton Hills Milton Milton Oakville Peel Region Brampton Brampton Caledon Mississauga City of Toronto City of Toronto Toronto West Toronto Central Toronto East Toronto East York Region Aurora East Gwillimbury East Gwillimbury Georgina King Markham Markham Newmarket Richmond Hill Richmond Hill Vaughan Vaughan Stouffville Durham Region Durham Region Ajax Ajax Brock Clarington Clarington Oshawa Oshawa Pickering Scugog Scugog Uxbridge Uxbridge Whitby Dufferin County Dufferin County Orangeville Orangeville Simcoe County Adjala-Tosorontio Adjala-Tosorontio Bradford Bradford Essa Innisfil Innisfil New Tecumseth 3 0 0 0 0 0 0 0 0 0 0 0 0 3 3 0 2 1 1 0 0 0 0 0 0 0 0 0 0 0 0 0 0 0 0 0 0 0 0 0 0 0 0 0 0 0 0 0 0 0 0 0 0 0 0 0 0 0 0 0 0 $1,639,000 $1,639,000 $1,639,000 $889,000 $750,000 $750,000 $546,333 $546,333 $546,333 $444,500 $750,000 $750,000 $460,000 $460,000 $460,000 $444,500 $750,000 $750,000 9 0 0 0 0 0 0 0 0 0 0 0 0 9 9 1 8 0 0 0 0 0 0 0 0 0 0 0 0 0 0 0 0 0 0 0 0 0 0 0 0 0 0 0 0 0 0 0 0 0 0 0 0 0 0 0 0 0 0 0 0 18 0 0 0 0 0 0 0 0 0 0 0 0 18 18 3 14 1 1 0 0 0 0 0 0 0 0 0 0 0 0 0 0 0 0 0 0 0 0 0 0 0 0 0 0 0 0 0 0 0 0 0 0 0 0 0 0 0 0 0 0 103% 103% 103% 99% 107% 107% 29 29 29 38 11 11 Toronto Regional Real Estate Board SUMMARY OF EXISTING HOME TRANSACTIONS Co-Ownership Apartment, October 2023 Market Watch, October 2023 Copyright 2023 Toronto Regional Real Estate Board 23 ALL TRREB AREAS
- 24. Sales Dollar Volume Average Price Median Price New Listings Active Listings Avg. SP/LP Avg. LDOM Abc Abc Abc Abc Abc Abc Abc Abc Abc Abc Abc Abc Abc Abc Abc Abc Abc Abc Abc Abc Abc Abc Abc Abc Abc Abc Abc Abc Abc Abc Abc Abc Abc Abc Abc Abc Abc Abc Abc Abc All TRREB Areas All TRREB Areas City of Toronto City of Toronto Toronto West Toronto W01 Toronto W02 Toronto W02 Toronto W03 Toronto W03 Toronto W04 Toronto W05 Toronto W06 Toronto W06 Toronto W07 Toronto W07 Toronto W08 Toronto W09 Toronto W10 Toronto W10 Toronto Central Toronto Central Toronto C01 Toronto C02 Toronto C03 Toronto C03 Toronto C04 Toronto C04 Toronto C06 Toronto C07 Toronto C08 Toronto C08 Toronto C09 Toronto C09 Toronto C10 Toronto C11 Toronto C12 Toronto C12 Toronto C13 Toronto C13 Toronto C14 Toronto C15 Toronto East Toronto East Toronto E01 Toronto E01 Toronto E02 Toronto E03 Toronto E04 Toronto E04 Toronto E05 Toronto E05 Toronto E06 Toronto E07 Toronto E08 Toronto E08 Toronto E09 Toronto E09 Toronto E10 Toronto E11 3 3 3 3 0 0 0 0 0 0 0 0 0 0 0 0 0 0 0 0 2 2 0 0 0 0 1 1 0 0 0 0 0 0 0 0 0 0 1 1 0 0 1 1 0 0 1 0 0 0 0 0 0 0 0 0 0 0 0 0 $1,639,000 $1,639,000 $1,639,000 $1,639,000 $889,000 $889,000 $429,000 $429,000 $460,000 $460,000 $750,000 $750,000 $750,000 $546,333 $546,333 $546,333 $546,333 $444,500 $444,500 $429,000 $429,000 $460,000 $460,000 $750,000 $750,000 $750,000 $460,000 $460,000 $460,000 $460,000 $444,500 $444,500 $429,000 $429,000 $460,000 $460,000 $750,000 $750,000 $750,000 9 9 9 9 1 1 0 0 0 0 0 0 0 0 0 0 0 0 0 0 8 8 0 1 1 1 1 1 0 0 0 0 1 1 2 0 0 0 0 0 2 0 0 0 0 0 0 0 0 0 0 0 0 0 0 0 0 0 0 0 18 18 18 18 3 1 0 0 0 0 0 2 0 0 0 0 0 0 0 0 14 14 0 2 1 1 1 1 0 0 0 0 1 1 3 0 0 0 1 1 4 1 1 1 0 0 1 0 0 0 0 0 0 0 0 0 0 0 0 0 103% 103% 103% 103% 99% 99% 100% 100% 99% 99% 107% 107% 107% 29 29 29 29 38 38 26 26 49 49 11 11 11 Toronto Regional Real Estate Board SUMMARY OF EXISTING HOME TRANSACTIONS Co-Ownership Apartment, October 2023 Market Watch, October 2023 Copyright 2023 Toronto Regional Real Estate Board 24 City of Toronto Municipal Breakdown
- 25. Index Benchmark Yr./Yr. % Chg. Index Benchmark Yr./Yr. % Chg. Index Benchmark Yr./Yr. % Chg. Index Benchmark Yr./Yr. % Chg. Index Benchmark Yr./Yr. % Chg. 349.4 $1,103,600 1.42% 357.7 $1,411,100 2.70% 376.00 $1,080,700 3.04% 394.6 $828,700 1.96% 365.6 $703,500 -0.71% 335.8 $1,124,500 0.03% 361.5 $1,440,000 1.01% 377.70 $987,200 0.96% 415.8 $809,600 0.92% 345.2 $641,100 2.31% 356.8 $1,000,000 2.12% 390.7 $1,295,700 3.63% 406.80 $964,600 3.59% 397.1 $760,900 0.03% 390.4 $610,600 2.07% 374.8 $1,095,100 0.13% 365.6 $1,201,800 0.16% 383.30 $851,000 -0.57% 432.2 $671,200 1.55% 358.4 $671,600 0.87% 321.5 $1,008,800 -0.56% 335.5 $1,293,600 -0.18% 378.80 $914,700 -0.68% 444.3 $784,600 0.32% 317.0 $647,400 2.16% 331.6 $1,323,100 -1.66% 366.6 $1,729,500 -0.14% 394.20 $1,130,100 2.18% 401.4 $896,300 1.41% 347.2 $680,500 2.30% 364.6 $1,045,700 0.33% 365.9 $1,340,700 1.27% 373.10 $976,800 1.11% 390.5 $821,900 2.76% 372.4 $608,900 -1.66% 382.9 $1,006,900 -0.47% 379.1 $1,193,700 -0.21% 387.40 $931,200 0.13% 403.6 $722,900 0.32% 398.7 $568,600 -2.59% 378.2 $1,394,500 5.67% 375.0 $1,489,700 6.29% 414.50 $1,038,400 5.44% 483.1 $1,001,900 2.70% 328.2 $785,000 0.49% 352.8 $1,043,100 0.23% 370.2 $1,495,100 1.12% 371.60 $1,046,000 1.95% 391.9 $864,500 3.70% 367.6 $615,800 -1.55% 323.1 $1,083,700 0.34% 349.9 $1,664,300 2.31% 371.10 $1,286,100 2.88% 398.6 $885,200 0.33% 369.1 $734,500 -1.18% 368.7 $1,360,700 4.36% 390.3 $1,657,700 4.55% 398.60 $1,199,900 5.53% 377.1 $954,400 10.01% 336.4 $698,600 1.23% 394.7 $1,346,000 2.87% 402.8 $1,581,400 2.31% 428.40 $1,107,900 5.49% 342.0 $929,500 7.99% 330.6 $653,300 -4.92% 371.1 $1,309,100 4.15% 368.9 $1,360,200 4.27% 381.60 $899,800 3.58% 406.4 $848,600 6.44% 404.7 $843,800 6.22% 425.50 $747,200 7.07% 367.6 $1,900,800 3.49% 397.4 $2,115,900 3.57% 351.00 $996,700 4.12% 327.4 $730,000 -2.62% 369.3 $1,371,300 5.27% 414.1 $1,831,200 4.44% 426.00 $1,291,300 5.81% 383.6 $1,013,100 15.79% 328.6 $726,100 2.98% 373.3 $1,230,000 3.32% 359.7 $1,350,700 3.04% 387.50 $1,007,100 3.92% 413.2 $828,900 7.24% 347.2 $591,000 -4.04% 370.2 $1,469,000 4.11% 389.8 $1,932,800 4.98% 378.00 $1,242,000 5.50% 383.4 $944,800 1.16% 346.4 $651,600 -0.52% 345.6 $1,389,000 4.25% 388.2 $1,818,100 5.37% 393.80 $1,248,600 5.29% 355.5 $958,500 7.79% 314.7 $716,500 1.68% 386.2 $1,399,500 3.40% 403.6 $1,568,200 3.43% 420.90 $1,079,300 5.97% 423.5 $792,800 4.70% 353.3 $623,600 -5.56% 393.6 $943,000 1.55% 387.7 $1,031,300 1.71% 426.00 $821,300 1.55% 440.4 $673,800 1.26% 351.2 $575,200 0.37% 397.5 $1,000,000 1.09% 398.4 $1,120,200 0.99% 407.70 $909,500 1.34% 403.1 $715,900 -1.08% 351.8 $573,500 0.11% 396.7 $720,800 0.48% 396.0 $719,500 0.35% 382.4 $866,800 2.36% 382.6 $956,500 2.74% 414.40 $737,200 2.91% 440.5 $705,300 0.80% 414.6 $537,700 0.80% 438.8 $831,900 0.83% 430.9 $890,200 0.96% 444.50 $708,900 1.05% 497.2 $630,400 1.99% 446.5 $523,700 1.78% 361.6 $1,005,600 -1.12% 369.6 $1,215,000 -0.11% 380.90 $893,900 -0.81% 408.9 $690,300 -1.16% 335.0 $615,100 -0.36% 372.8 $989,100 0.46% 371.2 $989,300 0.46% 377.60 $732,500 -0.61% 359.1 $1,247,900 1.38% 360.7 $1,319,100 1.55% 365.60 $962,000 0.38% 438.8 $670,900 -1.44% 310.8 $740,400 0.48% 406.2 $1,066,300 4.21% 402.9 $1,162,500 4.05% 424.10 $889,400 3.24% 459.8 $710,400 8.04% 338.0 $598,200 -0.59% 376.2 $807,800 2.73% 380.9 $900,100 2.86% 401.70 $723,100 4.26% 437.1 $600,100 4.10% 384.4 $518,500 -3.54% 376.2 $807,800 2.73% 380.9 $900,100 2.86% 401.70 $723,100 4.26% 437.1 $600,100 4.10% 384.4 $518,500 -3.54% 401.7 $896,500 3.08% 414.1 $945,500 4.05% 396.50 $764,800 4.20% 369.7 $622,600 -4.10% 392.1 $626,600 -4.58% 401.4 $1,118,800 5.22% 401.4 $1,119,400 5.19% 418.9 $1,139,800 4.41% 415.7 $1,207,100 5.21% 423.80 $937,500 5.42% 294.5 $472,700 -26.10% 328.0 $537,600 -4.87% 388.9 $791,100 2.29% 390.5 $819,600 2.87% 422.00 $670,500 2.80% 483.8 $665,700 1.77% 400.0 $815,300 1.63% 404.4 $833,400 2.56% 397.90 $642,200 -0.28% 338.8 $311,000 1.68% 346.3 $685,300 -5.92% 364.6 $847,800 2.79% 371.3 $949,000 4.06% 387.40 $691,100 2.90% 364.4 $707,300 -2.62% 385.4 $610,100 -3.51% Toronto Regional Real Estate Board FOCUS ON THE MLS HOME PRICE INDEX Index and Benchmark Price, October 2023 Market Watch, October 2023 Copyright 2023 Toronto Regional Real Estate Board 25 ALL TRREB AREAS Single Family Detached Single Family Attached Composite Townhouse Apartment ® All TRREB Areas Halton Region Burlington Halton Hills Milton Oakville Peel Region Brampton Caledon Mississauga City of Toronto York Region Aurora East Gwillimbury Georgina King Markham Newmarket Richmond Hill Vaughan Stouffville Durham Region Ajax Brock Clarington Oshawa Pickering Scugog Uxbridge Whitby Dufferin County Orangeville Simcoe County Adjala-Tosorontio Bradford Essa Innisfil New Tecumseth
- 26. Index Benchmark Yr./Yr. % Chg. Index Benchmark Yr./Yr. % Chg. Index Benchmark Yr./Yr. % Chg. Index Benchmark Yr./Yr. % Chg. Index Benchmark Yr./Yr. % Chg. 349.4 $1,103,600 1.42% 357.7 $1,411,100 2.70% 376.0 $1,080,700 3.04% 394.6 $828,700 1.96% 365.6 $703,500 -0.71% 323.1 $1,083,700 0.34% 349.9 $1,664,300 2.31% 371.1 $1,286,100 2.88% 398.6 $885,200 0.33% 369.1 $734,500 -1.18% 266.5 $1,124,500 -4.82% 339.6 $1,934,700 -9.63% 361.2 $1,405,100 -7.83% 312.4 $934,400 5.29% 345.1 $700,200 4.51% 351.0 $1,271,300 2.09% 391.4 $1,712,300 3.33% 422.6 $1,306,200 2.80% 539.0 $1,066,100 -2.90% 373.4 $755,700 2.08% 385.6 $975,200 3.32% 394.3 $1,048,500 4.34% 400.2 $1,008,800 3.36% 468.0 $861,500 2.65% 365.1 $645,200 3.46% 369.9 $928,400 2.41% 380.2 $1,192,200 4.57% 347.2 $930,200 2.48% 362.0 $759,500 3.43% 443.9 $637,400 -2.14% 367.6 $850,900 1.49% 339.5 $1,208,100 2.20% 332.8 $981,900 3.10% 410.9 $711,200 -3.61% 507.2 $560,000 -0.16% 326.8 $961,400 -2.51% 407.7 $1,331,600 4.73% 376.4 $1,259,700 7.14% 346.4 $1,054,100 0.32% 301.2 $752,000 -9.22% 321.2 $1,540,900 4.35% 344.0 $1,698,900 4.97% 331.0 $1,332,900 5.72% 421.6 $1,043,100 -0.21% 135.6 $768,500 0.89% 258.9 $1,093,700 2.29% 321.3 $1,854,700 3.78% 338.7 $1,366,800 4.76% 308.6 $782,800 -0.90% 332.0 $608,800 0.64% 371.3 $983,900 2.51% 318.9 $1,343,900 2.44% 398.5 $1,097,900 4.65% 313.1 $872,400 6.24% 464.1 $524,900 1.09% 376.1 $798,000 6.54% 334.3 $1,003,500 4.34% 346.7 $899,000 3.59% 400.3 $683,300 -1.48% 505.8 $602,400 9.39% 335.6 $875,700 -0.59% 400.0 $1,799,800 6.10% 388.9 $1,497,000 5.65% 388.9 $885,500 -1.22% 357.8 $804,600 -1.68% 262.6 $1,471,100 -1.39% 288.4 $2,943,700 6.15% 312.3 $2,043,200 0.51% 327.7 $1,450,200 -1.50% 315.9 $985,100 -4.59% 299.1 $1,628,600 8.13% 322.9 $2,097,100 12.23% 382.9 $1,297,900 6.15% 333.5 $1,841,700 -2.94% 298.6 $849,100 -4.66% 309.6 $2,134,300 -1.59% 338.1 $2,718,600 0.81% 339.0 $1,676,700 1.01% 314.4 $744,300 -3.62% 268.4 $1,126,100 0.83% 357.1 $1,677,800 1.51% 336.5 $1,205,100 2.19% 345.7 $915,400 5.20% 366.4 $656,500 -0.84% 334.7 $1,219,000 0.90% 374.9 $2,035,900 -0.29% 336.7 $1,247,300 3.31% 347.1 $894,900 4.86% 372.2 $771,500 4.23% 314.7 $795,500 -3.05% 419.4 $2,469,000 7.29% 388.2 $1,659,700 2.70% 452.2 $1,119,300 -4.26% 338.7 $729,800 -3.26% 285.0 $2,234,200 -0.52% 273.2 $4,026,000 4.39% 290.9 $2,671,200 5.06% 307.1 $1,777,700 -6.46% 325.2 $1,190,800 -2.40% 266.8 $1,093,000 0.34% 354.8 $2,329,300 4.66% 368.7 $1,728,200 8.22% 306.2 $1,046,000 -5.76% 304.4 $748,100 1.20% 334.9 $1,300,800 2.57% 319.7 $2,566,000 3.33% 327.0 $1,569,200 2.64% 501.9 $730,200 2.85% 391.4 $577,300 6.53% 306.5 $2,918,800 -0.65% 322.9 $3,826,300 -0.58% 325.6 $1,756,100 11.43% 340.8 $1,445,400 0.44% 345.4 $1,259,200 -7.40% 325.5 $1,239,100 1.78% 369.8 $2,016,100 2.98% 334.3 $1,055,600 5.79% 374.2 $939,300 4.35% 279.1 $721,200 0.58% 347.6 $1,134,000 -0.32% 383.5 $2,442,900 0.76% 332.8 $1,645,200 1.93% 354.9 $785,000 -5.54% 355.2 $800,900 -0.62% 302.6 $992,900 2.54% 384.7 $1,969,900 4.94% 342.3 $1,171,500 8.98% 402.4 $909,000 6.62% 340.5 $661,300 -1.87% 376.0 $1,174,300 -2.21% 433.9 $1,550,800 0.21% 415.0 $1,327,900 -0.26% 522.7 $958,600 -3.54% 337.9 $747,500 -6.81% 359.2 $1,404,300 2.22% 362.7 $1,778,500 3.33% 391.8 $1,370,500 2.38% 364.6 $1,098,800 -6.03% 356.6 $824,500 4.79% 364.1 $1,195,200 2.68% 377.9 $1,366,700 2.72% 353.3 $1,261,600 2.76% 418.6 $629,600 4.62% 395.1 $865,200 -0.33% 373.6 $1,053,200 -0.95% 374.4 $936,700 1.16% 365.5 $803,700 -1.67% 505.8 $567,000 0.34% 370.2 $961,700 -1.59% 372.8 $1,355,800 -0.08% 376.1 $1,050,200 2.03% 371.5 $814,000 -4.57% 372.7 $651,500 1.39% 374.8 $1,149,600 -0.87% 384.0 $1,263,600 -0.88% 377.6 $1,038,100 -0.47% 388.0 $806,300 -0.56% 411.1 $748,700 4.21% 361.0 $947,000 -0.50% 371.5 $1,253,400 -0.32% 378.2 $1,023,900 -0.05% 396.2 $874,500 -1.52% 396.6 $662,300 0.58% 379.1 $952,700 -0.76% 365.4 $1,237,100 0.00% 353.3 $954,200 1.76% 381.6 $717,800 0.37% 367.2 $575,400 0.99% 391.9 $841,700 0.26% 386.1 $1,052,500 0.99% 359.6 $875,700 0.90% 402.2 $702,200 5.76% 439.8 $623,200 -0.52% 331.0 $982,600 -5.78% 339.5 $1,166,900 -7.19% 324.9 $862,200 -7.46% 438.4 $698,400 10.01% 310.5 $537,200 -1.18% 404.7 $830,100 2.77% 392.6 $1,104,100 2.72% 431.6 $941,800 4.73% 420.4 $750,000 4.53% 435.8 $521,700 0.83% Toronto Regional Real Estate Board FOCUS ON THE MLS HOME PRICE INDEX Index and Benchmark Price, October 2023 Market Watch, October 2023 Copyright 2023 Toronto Regional Real Estate Board 26 CITY OF TORONTO Single Family Detached Single Family Attached Composite Townhouse Apartment ® All TRREB Areas City of Toronto Toronto W01 Toronto W02 Toronto W03 Toronto W04 Toronto W05 Toronto W06 Toronto W07 Toronto W08 Toronto W09 Toronto W10 Toronto C01 Toronto C02 Toronto C03 Toronto C04 Toronto C06 Toronto C07 Toronto C08 Toronto C09 Toronto C10 Toronto C11 Toronto C12 Toronto C13 Toronto C14 Toronto C15 Toronto E01 Toronto E02 Toronto E03 Toronto E04 Toronto E05 Toronto E06 Toronto E07 Toronto E08 Toronto E09 Toronto E10 Toronto E11
- 27. Bradford West Gwillimbury Whitchurch-Stouûville Adjala-Tosorontio East Gwillimbury Richmond Hill Toronto W06 Toronto W09 Toronto W05 Toronto E09 Toronto E06 Toronto E07 Halton Hills Orangeville Burlington Clarington Brampton Markham Georgina Pickering Vaughan Oshawa Caledon Oakville Scugog Innisûl Milton Brock Essa King Toronto Regional Real Estate Board Historic Annual Statistics Market Watch, October 2023 Copyright 2023 Toronto Regional Real Estate Board 27 Monthly Statistics 2023 Monthly Statistics 2022 Year Sales Average Price 2010 2011 2012 2013 2014 2015 2016 2017 2018 2019 2020 2021 $1,095,475 $929,636 $819,153 $787,842 $822,510 $729,824 $622,116 $566,611 $522,951 $497,073 $464,989 $431,262 121,712 95,066 87,747 78,017 92,340 113,040 101,213 92,776 87,047 85,488 89,110 85,860 January February March April May June July August September October November December Annual $1,189,736 $1,050,569 $1,079,420 $1,087,590 $1,086,538 $1,079,048 $1,073,321 $1,145,796 $1,210,372 $1,250,704 $1,298,705 $1,334,021 $1,242,407 75,049 3,090 4,507 4,930 4,999 5,584 4,869 6,422 7,226 7,940 10,861 9,027 5,594 January February March April May June July August September October November December Year to Date $1,132,681 $1,125,928 $1,119,400 $1,082,559 $1,117,671 $1,180,919 $1,195,469 $1,153,006 $1,107,961 $1,096,157 $1,037,032 58,367 4,646 4,631 5,265 5,229 7,434 8,965 7,489 6,870 4,754 3,084 Notes 1. Sales, dollar volume, average sale prices and median sale prices are based on firm transactions entered into the TRREB MLS® System between the first and last day of the month/period being reported. 2. New listings entered into the TRREB MLS® System between the first and last day of the month/period being reported. 3. Active listings at the end of the last day of the month/period being reported. 4. Ratio of the average selling price to the average listing price for firm transactions entered into the TRREB MLS® System between the first and last day of the month/period being reported. 5. Average Listing Days on Market (Avg. LDOM) refers to the average number of days sold listings were on the market. Average Property Days on Market (Avg. PDOM) refers to the average number of days a property was on the market before selling, irrespective of whether the property was listed more than once by the same combination of seller and brokerage during the original listing contract period. 6. Active Listings at the end of the last day of the month/period being reported. 7. Past monthly and year-to-date figures are revised on a monthly basis. 8. SNLR = Sales-to-New-Listings Ratio. Calculated using a 12 month moving average (sales/new listings). 9. Mos. Inv. = Months of Inventory. Calculated using a 12 month moving average (active listings/sales). 10. "Bradford West Gwillimbury" is referred to as "Bradford" and "Whitchurch-Stouffville" is referred to as "Stouffville" in the report. Dufferin Durham Halton Peel Simcoe Toronto York For historical annual sales and average price data over a longer time frame, go to: https://trreb.ca/files/market-stats/market-watch/historic.pdf