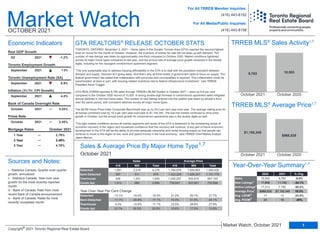
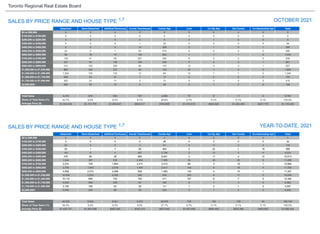
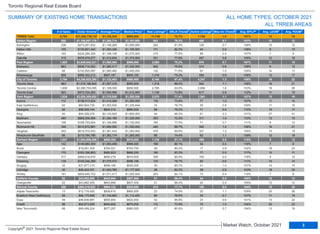
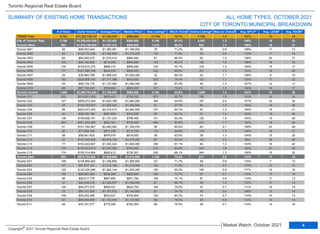
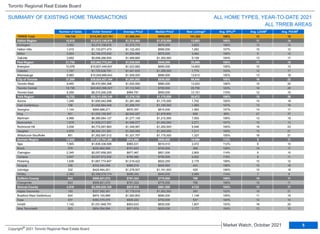
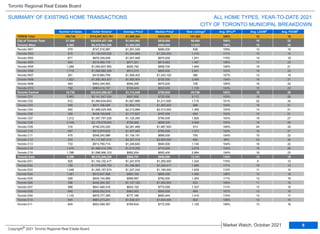
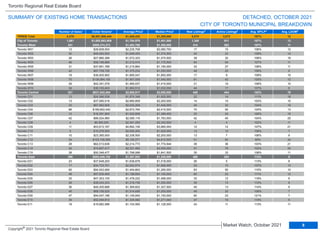
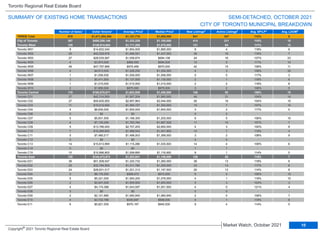
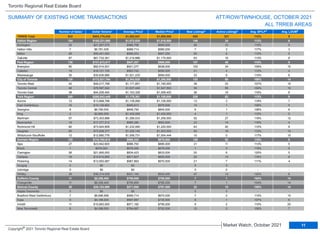
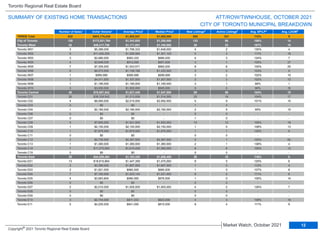
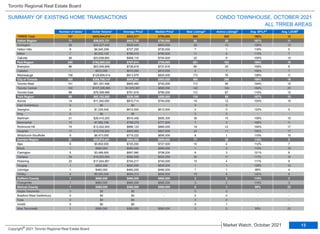
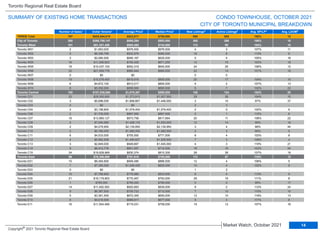
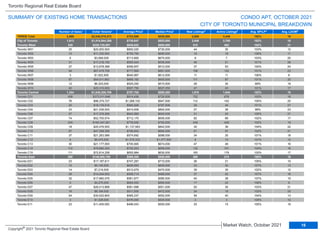
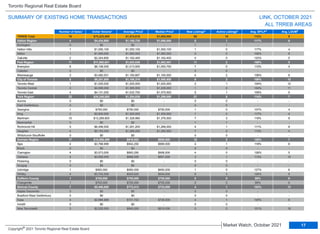
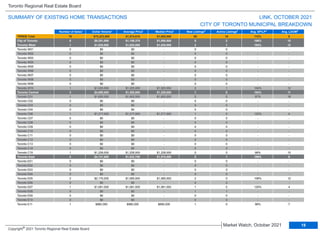
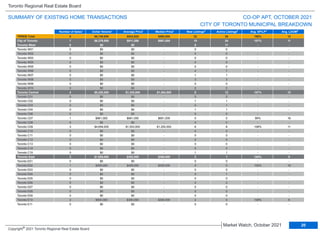
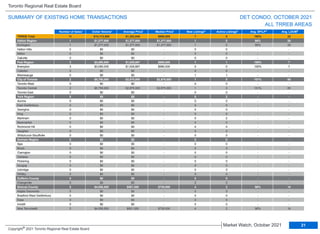
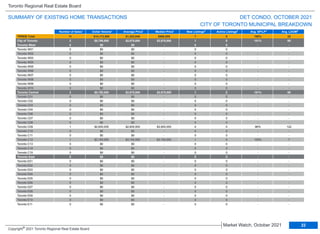
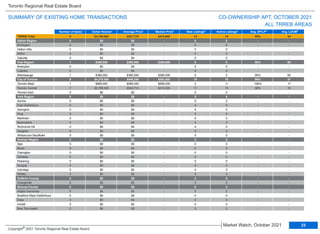
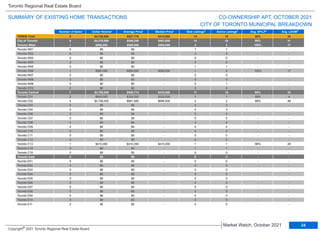
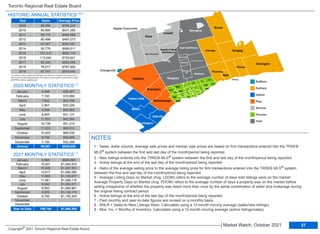
Home sales in the Greater Toronto Area reached the second highest level for October, but new listings were down about a third from October 2020. Market conditions tightened across all major home types compared to last year, with the average price rising 19.3% to $1,155,345. Demand is not expected to decrease, so governments need to focus on increasing housing supply to address affordability issues.
Home listings continue to increase across all housing categories in the Metro Vancouver housing market while home buyer activity remains below historical averages.
The Real Estate Board of Greater Vancouver (REBGV) reports that residential home sales in the
region totalled 1,929 in August 2018, a 36.6 per cent decrease from the 3,043 sales record
The average selling price for April 2013 transactions was $526,335
–
up by two per cent
in comparison to April 2012. The MLS® HPI Composite Benchmark Price was up by 2.9
per cent
"We are on track for record home sales reported through TREB's MLS® System this year. Barring a drastic shift in the economy over the next three months, total transactions reported by TREB Members in 2015 are expected to be at or near the 100,000 mark. This is a testament to the importance that GTA households put on home ownership as a long-term investment," said Mr. McLean.
THE TORONTO REAL ESTATE BOARD'S MAY 2018 MARKET SALES STATISTICS WITH MEDIA R...Shawn Venasse
June 4, 2018 -- Greater Toronto Area REALTORS® reported 7,834 sales through TREB's MLS® System in May 2018. This result was down by 22.2 per cent compared to May 2017. While the number of sales was down year-over-year, the annual rate of decline was less than reported in February, March and April, when sales were down by more than 30 per cent. On a month-over-month basis, seasonally adjusted May sales were basically flat compared to April.
Even with the record low temperatures last month, we still saw an increase in the number of people purchasing homes in the GTA. This speaks to the importance households place on home ownership and the fact that buyers continue to view ownership housing as a quality long-term investment in which they can live.
Strong Sales & Price Growth in August
The MLS® Home Price Index (HPI) Composite Benchmark for August 2016 was up by 17.2 per cent on a year-over-year basis. Similarly, the average selling price for all home types combined
was up by 17.7 per cent on an annual basis to $710,410. Both the MLS® HPI benchmarks and average prices for low-rise home types were up by double digits percentage-wise.
As a growing number of homebuyers, many of whom put their purchase on hold due to stricter lending guidelines, now reactivate their search, the expectation is for
renewed growth in home sales in the second half of 2013,"
Toronto Real Estate Board's MARKET WATCH - JANUARY 2017Shawn Venasse
The Toronto Real Estate Board's monthly statistical analysis of all real estate transactions within the Toronto and area issued at the first of each month for the preceding month.
Toronto Real Estate Board released this Outlook Report 2017. Interesting facts and analysis of what the year ahead will hold. What is impacting housing affordability and beyond.
Keep Your Home Naturally Cool and Warm Out Change in Seasons
Vinra Construction is a private limited company registered under the ROC. The management has an experience of over 15 years of understanding the needs and delivering apt solutions to the end users We are providing turnkey solutions in construction fields. like Construction, Interior Designing Facility Management, Plantation Management, etc..
Vinra Construction Tech Enabled Company for Eco-Friendly Home Construction
Contact With Vinra for a Greener Future >>> Call us @ 888 4898 765
MC Heights-Best Construction Company in jhanglaraibfatim009
MC Heights stands as the epitome of excellence in construction within Jhang. With a commitment to unparalleled quality and innovative design, MC Heights redefines urban living in the heart of Jhang. Offering luxurious residential spaces, cutting-edge commercial complexes, and vibrant community areas, MC Heights caters to the diverse needs of modern lifestyles. Our dedication to superior craftsmanship and customer satisfaction ensures that every aspect of MC Heights exceeds expectations, making it the premier choice for those seeking unparalleled sophistication and comfort in Jhang.
Simpolo Tiles & Bathware
Tile ho,
toh Simpolo.
Since the first steps were taken in 1977, Simpolo Ceramics has carved its niche as a consistently growing organisation with unparalleled innovation and passion rooted in simplicity.
We endure gratification for every experience we offer, created to share something meaningful. It may not resonate with the majority, but that makes us a class apart. If only a handful were to understand the purpose of our existence, we would be proud to have found our believers. Rather, people with whom we can share our beliefs.
VISUALIZER
Design your space in your style with our very own Visualizer. Now, you can choose the tiles of your liking from our wide selection and see how they would look in a space. Select the tile from the multiple options and the visualiser will replace the surfaces in the image with the selected tiles. This way, instead of just your imagination, you can choose the tiles for your place by getting an actual picture of how they would look in a space. So, design your space the way you desire digitally and implement it in real life to get the best results!
You can also share this visualiser with others to help them design their space.
Committed to delighting customers with world-class ceramic products and services. Make Simpolo synonymous with the best quality and set new benchmarks of excellence for all stakeholders. Pursue best business practices with utmost integrity to make Simpolo an exciting organisation to work with, for vendors, channel partners, investors and employees alike.
Gain worldwide recognition in the field of ceramic building products through Research and Innovation and bring an enhanced lifestyle within reach for every household.
One FNG by Group 108 Sector 142 Noida Construction UpdateOne FNG
One FNG by Group 108 is launching a new commercial project in Sector 142 Noida. Office space and high street retail shops on the FNG and Noida Expressway. For more information visit the website https://www.onefng.com/
Avrupa Konutlari Yenimahalle - Listing TurkeyListing Turkey
Welcome to Avrupa Konutları Yenimahalle, where luxury living meets unparalleled convenience in the heart of Istanbul. Developed by Artaş Holding, one of Turkey’s leading construction companies, this prestigious residential project offers a contemporary lifestyle experience like no other.
https://listingturkey.com/property/avrupa-konutlari-yenimahalle/
BricknBolt Understanding Load-Bearing Walls and Their Structural Support in H...BrickAndBolt
Load-bearing walls are the backbone of any home construction, providing crucial structural support that carries the weight of the house above. For companies like Brick and Bolt Mysore and Bricknbolt Faridabad, understanding and properly implementing these elements are key to constructing safe and durable buildings.
Green Homes, Islamabad Presentation .pdfticktoktips
Green Homes Islamabad offers beautifully designed 5, 8, and 10 Marla homes near the airport and motorway. Enjoy luxury, convenience, and high rental returns in a prime location.
Referans Bahcesehir which is being constructed, in the center of the most regional destination as Bahçeşehir, shines out with its central location and unique landscape including social facilities such as a fitness center, sauna, sports facilities, children’s playground and recreational areas.
Not only drawing attention for immediate surroundings including commercial centers and private schools but also providing the easily accessible location with closeness to Tem Highway and connection roads, ongoing construction of 3rd Bridge Connection roads and Metro Projects
Bahcesehir is a rising value in the great city of Istanbul… Located at a new transportation junction in the northwest of the City… Located at such a spot that the access roads for the 3rd bridge and for the 3rd Airport will reach the region in 2016. The Marmaray and the Subway will extend all the way to Referans Bahcesehir respectively in 2018 and 2019.
465 flats and 34 stores are designed with an outstanding approach and arranged with a unique perspective offering the following options: 1 plus 1, 2 plus 1, 3 plus 1, 3.5 plus 1, 4 plus 1, and 4.5 plus 1. It is planned so as to safeguard you and your loved ones based upon a modern, technological safety approach. As you experience the joy and luxury here, you will be content and feet at ease.
It is worth seeing both inside and outside with heart-warming cafes, tasty restaurants and elegant stores… And it is ready to offer a vivacious social life with a warm and cozy space design.
A folding swimming pool and indoor swimming pools, playgrounds, Turkish bath, sauna… It has them all. Everything you need for your well-being and for having a pleasant time will be at your service. You simply need to align the rhythm of life with the rhythm of Referans Bahcesehir.
https://listingturkey.com/property/referans-bahcesehir/
Lixin Azarmehr, a Los Angeles-based real estate development trailblazer, co-founded JL Real Estate Development (JL RED) in 2015 and serves as its CEO. Her expertise has propelled the firm to specialize in luxury residential and mixed-use commercial projects, with a portfolio that features upscale retail spaces and sophisticated care facilities.
Need MCA leads? No sweat! MCAs are great for small biz funding. Learn how to snag top-notch leads: businesses needing cash, with repayment ability, decision-makers, and accurate contacts. Use content, social ads, lead platforms, partnerships, and capture processes for quality leads.
https://www.leadgeneration.media/blog/b/streamline-your-mca-sales-process-with-pre-qualified-leads
Flat available for sale
Location- Tupudana, Ranchi
Savitri enclave
Area- 3BHK
Rate- 4000/sq.ft.
Super Build Up Area-1629 sq.ft.
Build-up area-1253 sq.ft.
Rate- 65lakh16k(approx)
Floor available- Flat available in all floor(G+12)
Balcony- 2
Washroom- 2
Parking - CAR PARKING
Amenities- Joggers track,temple, children's park,gym,banquet hall (5 Lakh)
Possession year (Handover year)- Dec 2025
Outside View from the apartment and flat balcony is very beautiful.
For more information contact AASHIYANA STAR PROPERTIES
7766900371
Urbanrise Paradise on Earth - Unveiling Unprecedented Luxury in Exquisite Vil...JagadishKR1
Immerse yourself in the epitome of luxury living at Urbanrise Paradise on Earth. These opulent 4 BHK villas, nestled off the prestigious Kanakapura Road in Bangalore, redefine elegance and sophistication. With meticulous craftsmanship, breathtaking design, and unparalleled amenities, Urbanrise Paradise on Earth offers a sanctuary where every moment is infused with luxury and serenity. Experience a life of grandeur and indulgence at this exclusive residential enclave.
Presentation to Windust Meadows HOA Board of Directors June 4, 2024: Focus o...Joseph Lewis Aguirre
Presentation to Windust Meadows HOA Board of Directors June 4, 2024: Focus on Public Safety as Job #1, Engagement, Wealth of HOA, Branding, Communication, Culture, Civic Responsibility
Torun Center Residences Istanbul - Listing TurkeyListing Turkey
THERE IS LIFE IN ITS CENTER!
The most energetic spot of the city that will add utterly different pleasures to your life, with a park that will make Istanbul breathe, delighting indoor and outdoor bistros, cafes, restaurants, the brand-new Food Hall concept, where dozens of unique tastes are served together, market area, cinema, theater, fitness club, SPA and event venue...
All the pleasures that will enrich your lives are awaiting you on the most beautiful side of the city, at Torun Center Residences. In Mecidiyeköy, where the heart of Istanbul beats, business, life and entertainment opportunities are located at the exact center, at Torun Center, the most beautiful side of the city.
Penthouse apartments and different styles of flats from 1 + 1 to 4 + 1, from 100 to 425 square meters in a 42-story residence tower, have been designed for those who want to live in the center of magnificence. Torun Center is the redefinition of a better life with specially landscaped floor gardens, apartment options with private balconies, and automatic glass systems equipped with Trickle Ventilation that offers clean air comfort.
Business and life in the same place
Excellent service
Torun Center has many delightful details, from a swimming pool to sunbathing and resting terrace. With 24/7 concierge services, 24/7 security, valet, technical service, closed-circuit camera system (CCTV), central heating and cooling system, it makes your life easier.
Delightful details
The two-story Torun Center Lounge, with its indoor and outdoor seating areas, children's playroom, private dining and TV lounge, promises unforgettable memories to you and your loved ones with its unique Istanbul view.
Neighboring to the most pleasant square of Istanbul
A few steps from the Torun Center Residences, you can reach the city's most modern city square and open the doors of a quality city life. Torun Center Residences brings together on the same project the long-awaited city life for Istanbul and gourmet restaurants, cafes, gym and SPA, and state-of-the-art cinema and Artı Stage, hosting the most famous plays of the season.
Located at the intersection of alternative public transportation options such as the metro and Metrobus, Torun Center comes to the fore as the most accessible office for both sides of Istanbul. With a central location and rich transportation lines, Torun Center offices make life easier for employees and increase productivity.
Scanning tenants in NYC requires a thorough and compliant approach to ensure you find reliable renters. For a positive rental experience, consider hiring a property management service. Belgium Management LLC specializes in NYC rental property management and tenant relationship management. We prioritize tenant satisfaction, making us a trusted name in New York property management. Our dedicated team ensures tenants feel valued and supported throughout their lease.
500 acres of brilliance await you here at Riverview City which offers modern living, effortless convenience, and a beautiful natural setting. It is a mega township by Magarpatta City in Loni Kalbhor, Pune. Enjoy easy access to work, schools, and fun while experiencing a perfect work-life balance.
Visit - magarpattacity.developerprojects.in
Oeiras Tech City, Developed by RE Capital and REIG, Will Become Lisbon's Futu...Newman George Leech
Oeiras Tech City, a historic development in the Oeiras municipality of Lisbon, is acquired by RE Capital and REIG. It is located on a 93,000-square-meter plot of land and combines co-living, business, and residential areas. It highlights ESG principles and is close to Tagus Park, which improves the urban landscape of Lisbon.
Rixos Tersane Istanbul Residences Brochure_May2024_ENG.pdfListing Turkey
Tersane Suites Residences is a luxurious real estate project located in the heart of Istanbul, next to the beautiful Golden Horn. This unique development offers hotel concept residences with Rixos management, making it the perfect choice for both homeowners and investors.
The Tersane Suites Residences offers a wide range of options, from studio apartments to spacious four-bedroom units, all designed to the highest standard. The suites are finished with high-quality materials and feature modern, open-plan living spaces, fully-equipped kitchens, and large balconies with stunning views of the city and sea.
One of the standout features of Tersane Suites Residences is the Rixos management, which provides a truly exclusive and upscale living experience. Residents will have access to a range of luxury amenities, including a fitness center, spa, and indoor and outdoor swimming pools. Plus, the on-site restaurants and cafes provide a taste of the local and international cuisine.
The Tersane Suites Residences also offers a great opportunity for investors, as it provides a rental guarantee program. This means that investors can enjoy a steady income stream, with the peace of mind that their property is being managed by a reputable and experienced team.
The location of Tersane Suites Residences is also unbeatable, with easy access to the city’s main transportation links and within close proximity to the historic center, making it the perfect base for exploring all that Istanbul has to offer.
Rixos Tersane Istanbul Residences Brochure_May2024_ENG.pdf
Market Stats for October 2021
1. Sales
New Listings
Active Listings
Average Price
Avg. LDOM
Avg. PDOM
10,503 9,783 -6.9%
17,806 11,740 -34.1%
17,313 7,750 -55.2%
$968,535 $1,155,345 19.3%
17 13 -23.5%
24 18 -25%
2020 2021 % Chg.
Year
Market Watch
OCTOBER 2021
Economic Indicators
October 2021
GTA REALTORS®
RELEASE OCTOBER STATS
TORONTO, ONTARIO, November 3, 2021 – Home sales in the Greater Toronto Area (GTA) reached the second-highest
level on record for the month of October. However, the inventory of homes for sale did not keep up with demand. The
number of new listings was down by approximately one-third compared to October 2020. Market conditions tightened
across all major home types compared to last year, and the annual rate of average price growth remained in the double
digits, including for the resurgent condominium apartment segment.
“The only sustainable way to address housing affordability in the GTA is to deal with the persistent mismatch between
demand and supply. Demand isn’t going away. And that’s why all three levels of government need to focus on supply. The
federal government has stated that collaboration with provinces and municipalities is required. This collaboration could be
spearheaded, at least in part, with housing-related incentives tied to federal infrastructure investment,” said TRREB
President Kevin Crigger.
GTA REALTORS® reported 9,783 sales through TRREB’s MLS® System in October 2021 – down by 6.9 per cent
compared to the October 2020 record of 10,503. A strong double-digit increase in condominium apartment sales mitigated
annual declines in low-rise home sales. The number of new listings entered into the system was down by almost a third
over the same period, with consistent declines across all major home types.
The MLS® Home Price Index Composite Benchmark was up by 24.2 per cent year-over-year. The average selling price for
all homes combined rose by 19.3 per cent year-over-year to $1,155,345. The low-rise market continued to drive price
growth in October, but the annual price growth for condominium apartments was in the double digits as well.
“The tight market conditions across all market segments and areas of the GTA is testament to the broadening scope of
economic recovery in the region and household confidence that this recovery will continue. A key part of future economic
development in the GTA will be the ability to provide adequate ownership and rental housing supply so that people can
continue to move to the region to live, work and spend money in the local economy,” said TRREB Chief Market Analyst
Jason Mercer.
Sources and Notes:
i - Statistics Canada, Quarter-over-quarter
growth, annualized
ii - Statistics Canada, Year-over-year
growth for the most recently reported
month
iii - Bank of Canada, Rate from most
recent Bank of Canada announcement
iv - Bank of Canada, Rates for most
recently completed month
For All TRREB Member Inquiries:
For All Media/Public Inquiries:
(416) 443-8152
(416) 443-8158
October 2020
October 2021
9,783 10,503
Detached
Semi-Detached
Townhouse
Condo Apt
1,061 3,218 4,279 1,784,979 1,459,803 1,540,432
367 511 878 1,322,229 1,029,347 1,151,770
428 1,201 1,629 1,025,257 932,815 957,103
1,913 986 2,899 739,647 633,951 703,698
Sales Average Price
416 905 Total 416 905 Total
Home Type
Year-Over-Year Per Cent Change
October 2020
October 2021
$1,155,345
$968,535
Detached
Semi-Detached
Townhouse
Condo Apt
-13.1% -19.9% -18.3% 21.2% 29.7% 27.7%
-11.1% -20.9% -17.1% 14.4% 31.5% 24.1%
5.4% -15.8% -11.1% 23.5% 28.6% 27.9%
33.7% 20.5% 28.9% 10.6% 17.0% 13.0%
TRREB MLS®
Sales Activity1,7
TRREB MLS®
Average Price1,7
Sales & Average Price By Major Home Type1,7
Year-Over-Year Summary1,7
October 2021 0.25%
October 2021 2.45%
1 Year 2.79%
3 Year 3.49%
5 Year 4.79%
September 2021 4.4%
September 2021 8.9%
September 2021 7.5%
Q2 2021 -1.2%
Real GDP Growth
Toronto Employment Growth
Toronto Unemployment Rate (SA)
Inflation (Yr./Yr. CPI Growth)
Bank of Canada Overnight Rate
Prime Rate
1
Market Watch, October 2021
Copyright®
2021 Toronto Regional Real Estate Board
October 2021
Mortgage Rates
2
3
1
5
5
2. Toronto Regional Real Estate Board
YEAR-TO-DATE, 2021
$0 to $99,999
$100,000 to $199,999
$200,000 to $299,999
$300,000 to $399,999
$400,000 to $499,999
$500,000 to $599,999
$600,000 to $699,999
$700,000 to $799,999
$800,000 to $899,999
$900,000 to $999,999
$1,000,000 to $1,249,999
$1,250,000 to $1,499,999
$1,500,000 to $1,749,999
$1,750,000 to $1,999,999
$2,000,000+
0 0 0 0 0 0 0 0 0 0
0 0 0 0 0 0 0 0 0 0
3 0 0 0 5 0 1 0 0 9
5 0 0 1 32 0 2 0 4 44
5 0 0 14 285 0 1 0 1 306
22 3 1 62 816 0 0 0 2 906
56 16 10 146 802 1 1 1 0 1,033
129 41 59 207 394 6 0 2 0 838
227 90 136 190 236 11 0 0 1 891
312 192 206 94 107 12 0 3 1 927
860 324 237 49 103 24 1 2 0 1,600
1,024 105 122 13 60 14 1 1 0 1,340
608 54 37 7 17 2 0 0 0 725
363 23 11 5 13 0 0 0 0 415
665 30 12 9 29 0 1 2 0 748
Detached Semi-Detached Att/Row/Twnhouse Condo Townhouse Condo Apt Link Co-Op Apt Det Condo Co-Ownership Apt Total
Name
$0 to $99,999
$100,000 to $199,999
$200,000 to $299,999
$300,000 to $399,999
$400,000 to $499,999
$500,000 to $599,999
$600,000 to $699,999
$700,000 to $799,999
$800,000 to $899,999
$900,000 to $999,999
$1,000,000 to $1,249,999
$1,250,000 to $1,499,999
$1,500,000 to $1,749,999
$1,750,000 to $1,999,999
$2,000,000+
0 0 0 0 4 0 0 0 0 4
2 0 0 0 28 0 2 0 0 32
22 0 0 3 81 0 11 0 2 119
54 1 7 26 460 0 22 1 18 589
145 8 4 297 3,746 0 13 0 11 4,224
476 60 36 980 8,931 3 11 4 12 10,513
1,044 397 516 2,204 7,256 30 20 25 6 11,498
2,233 729 1,684 2,411 3,415 89 4 18 1 10,584
3,759 1,843 2,516 1,454 2,017 143 4 16 4 11,756
4,959 2,515 2,088 508 1,082 134 4 16 1 11,307
10,838 2,533 2,002 398 930 222 4 11 0 16,938
10,115 856 725 165 411 107 6 7 0 12,392
5,646 468 209 64 182 9 1 3 0 6,582
3,150 199 63 29 111 1 3 1 0 3,557
6,059 229 90 36 224 0 1 3 0 6,642
Detached Semi-Detached Att/Row/Twnhouse Condo Townhouse Condo Apt Link Co-Op Apt Det Condo Co-Ownership Apt Total
Name
OCTOBER 2021
SALES BY PRICE RANGE AND HOUSE TYPE 1,7
Total Sales
Share of Total Sales (%)
Average Price ($)
4,279 878 832 797 2,899 70 8 11 9 9,783
43.7% 9.0% 8.5% 8.1% 29.6% 0.7% 0.1% 0.1% 0.1% 100.0%
$1,540,432 $1,151,770 $1,085,547 $823,017 $703,698 $1,074,616 $843,625 $1,283,046 $527,778 $1,155,345
48,505 9,842 9,941 8,575 28,878 738 106 105 55 106,745
45.4% 9.2% 9.3% 8.0% 27.1% 0.7% 0.1% 0.1% 0.1% 100.0%
$1,420,747 $1,063,098 $965,382 $762,315 $675,645 $1,007,608 $644,483 $925,284 $493,062 $1,086,304
Total Sales
Share of Total Sales (%)
Average Price ($)
27. 2009 86,980 $395,234
2010 85,860 $431,262
2011 89,110 $464,989
2012 85,488 $497,073
2013 87,047 $522,951
2014 92,776 $566,611
2015 101,213 $622,118
2016 113,040 $729,821
2017 92,340 $822,496
2018 78,017 $787,800
2019 87,747 $819,043
Year Sales Average Price
Toronto Regional Real Estate Board
January 4,546 838,087
February 7,193 910,068
March 7,942 902,788
April 2,957 820,226
May 4,594 863,563
June 8,645 931,131
July 11,033 943,594
August 10,738 951,219
September 11,033 960,613
October 10,503 968,535
November 8,728 955,889
December 7,155 932,306
January 6,888 $966,068
February 10,931 $1,044,933
March 15,628 $1,097,351
April 13,617 $1,090,590
May 11,905 $1,108,077
June 11,061 $1,089,118
July 9,340 $1,062,071
August 8,563 $1,069,981
September 9,029 $1,136,119
October 9,783 $1,155,345
November - -
December - -
Annual 95,067 $929,636
HISTORIC ANNUAL STATISTICS1,6,7
Year to Date 106,745 $1,086,304
NOTES
*For historic annual sales and average price data over a longer time frame go to:
http://www.torontorealestateboard.com/market_news/market_watch/historic_stats/
pdf/TREB_historic_statistics.pdf
Ajax
Aurora
Bradford West
Gwillimbury
Brampton
Brock
Burlington
C01
C02
C03
C04
C06
C07
C08
C10 C11
C12 C13
C14
C15
Caledon
Clarington
E01
E02
E03
E04
E06
E07
E08
E09
E10
E11
East Gwillimbury
Essa
Georgina
Halton Hills
Innisfil
King
Markham
Milton
Mississauga
New Tecumseth
Newmarket
Oakville
Oshawa
Pickering
Richmond
Hill
Scugog
Uxbridge
Vaughan
W02
W03
W04
W05
W06
W07
W08
W09
W10
Whitchurch-Stouffville
Adjala-Tosorontio
Orangeville
Whitby
Dufferin
Durham
Halton
Peel
Simcoe
Toronto
York
27
Market Watch, October 2021
Copyright® 2021 Toronto Regional Real Estate Board
1 - Sales, dollar volume, average sale prices and median sale prices are based on firm transactions entered into the TRREB
MLS® system between the first and last day of the month/period being reported.
2 - New listings entered into the TRREB MLS® system between the first and last day of the month/period being reported.
3 - Active listings at the end of the last day of the month/period being reported.
4 - Ratio of the average selling price to the average listing price for firm transactions entered into the TRREB MLS® system
between the first and last day of the month/period being reported.
5 - Average Listing Days on Market (Avg. LDOM) refers to the average number of days sold listings were on the market.
Average Property Days on Market (Avg. PDOM) refers to the average number of days a property was on the market before
selling irrespective of whether the property was listed more than once by the same combination of seller and brokerage during
the original listing contract period.
6 - Active listings at the end of the last day of the month/period being reported.
7 - Past monthly and year-to-date figures are revised on a monthly basis.
8 - SNLR = Sales-to-New Listings Ratio. Calculated using a 12-month moving average (sales/new listings).
9 - Mos. Inv. = Months of Inventory. Calculated using a 12-month moving average (active listings/sales).
2021 MONTHLY STATISTICS1,7
2020 MONTHLY STATISTICS1,7