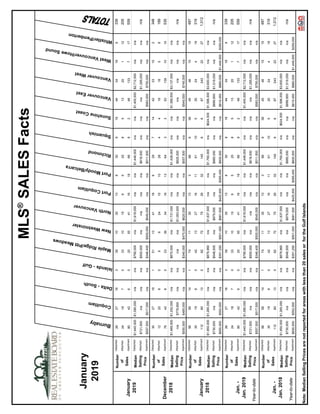
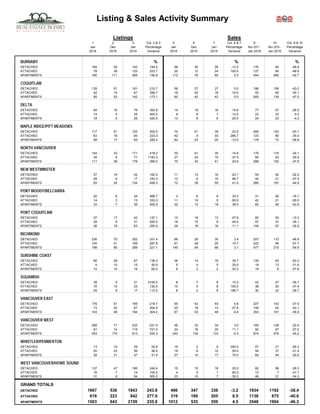
Home listings continue to increase across all housing categories in the Metro Vancouver housing market while home buyer activity remains below historical averages.
Housing market conditions continue to favour home buyers VANCOUVER, BC – March 4, 2019 – The Metro Vancouver* housing market saw increased
supply from home sellers and below average demand from home buyers in February.
The Real Estate Board of Greater Vancouver (REBGV) reports that residential home sales in the region totalled 1,727 in March 2019, a 31.4 per cent decrease from the 2,517 sales recorded in March 2018, and a 16.4 per cent increase from the 1,484 homes sold in February 2019.
Prospective home buyers remain on the sidelines in March VANCOUVER, BC – April 2, 2019 – Metro Vancouver* home sales dipped to the lowest
levels seen in March in more than three decades.
The Real Estate Board of Greater Vancouver (REBGV) reports that residential home sales in the region totalled 1,727 in March 2019, a 31.4 per cent decrease from the 2,517 sales recorded in March 2018, and a 16.4 per cent increase from the 1,484 homes sold in February 2019.
Last month’s sales were 46.3 per cent below the 10-year March sales average and was the lowest total for the month since 1986.
"Housing demand today isn’t aligning with our growing economy and low unemployment rates. The market trends we’re seeing are largely policy-induced," Ashley Smith, REBGV president said. "For three years, governments at all levels have imposed new taxes and borrowing requirements on to the housing market.”
The Real Estate Board of Greater Vancouver (REBGV) reports that residential home sales totalled 1,608 in the region in November 2018, a 42.5 per cent decrease from the 2,795 sales recorded in November 2017, and an 18.2 per cent decrease compared to October 2018 when 1,966 homes sold.
The Real Estate Board of Greater Vancouver (REBGV) reports that residential property sales in the region totalled 2,070 in July 2018, a 30.1 per cent decrease from the 2,960 sales recorded in July 2017, and a decrease of 14.6 per cent compared to June 2018 when 2,425 homes sold.
The Real Estate Board of Greater Vancouver (REBGV) reports that residential property sales in the region totalled 2,833 in May 2018, a 35.1 per cent decrease from the 4,364 sales recorded in May 2017, and a 9.8 per cent increase compared to April 2018 when 2,579 homes sold.
The Real Estate Board of Greater Vancouver (REBGV) reports that residential home sales in the
region totalled 1,929 in August 2018, a 36.6 per cent decrease from the 3,043 sales record
“Buyers are less active today. This is allowing the supply of homes for sale to accumulate to levels we haven’t seen in the last few years,” Phil Moore, REBGV president said. “Rising interest rates, high prices and more restrictive mortgage requirements are among the factors dampening home buyer activity today.”
Planning for Broadway now provides an opportunity to
coordinate transit-supportive land use, affordable housing
policies, transportation connectivity and public realm
design with the rapid transit project.
The Real Estate Board of Greater Vancouver (REBGV) reports that residential property sales in the region totalled 2,579 in April 2018, a 27.4 per cent decrease from the 3,553 sales recorded in April 2017, and a 2.5 per cent increase compared to March 2018 when 2,517 homes sold.
500 acres of brilliance await you here at Riverview City which offers modern living, effortless convenience, and a beautiful natural setting. It is a mega township by Magarpatta City in Loni Kalbhor, Pune. Enjoy easy access to work, schools, and fun while experiencing a perfect work-life balance.
Visit - magarpattacity.developerprojects.in
BricknBolt Understanding Load-Bearing Walls and Their Structural Support in H...BrickAndBolt
Load-bearing walls are the backbone of any home construction, providing crucial structural support that carries the weight of the house above. For companies like Brick and Bolt Mysore and Bricknbolt Faridabad, understanding and properly implementing these elements are key to constructing safe and durable buildings.
Keep Your Home Naturally Cool and Warm Out Change in Seasons
Vinra Construction is a private limited company registered under the ROC. The management has an experience of over 15 years of understanding the needs and delivering apt solutions to the end users We are providing turnkey solutions in construction fields. like Construction, Interior Designing Facility Management, Plantation Management, etc..
Vinra Construction Tech Enabled Company for Eco-Friendly Home Construction
Contact With Vinra for a Greener Future >>> Call us @ 888 4898 765
Flat available for sale
Location- Tupudana, Ranchi
Savitri enclave
Area- 3BHK
Rate- 4000/sq.ft.
Super Build Up Area-1629 sq.ft.
Build-up area-1253 sq.ft.
Rate- 65lakh16k(approx)
Floor available- Flat available in all floor(G+12)
Balcony- 2
Washroom- 2
Parking - CAR PARKING
Amenities- Joggers track,temple, children's park,gym,banquet hall (5 Lakh)
Possession year (Handover year)- Dec 2025
Outside View from the apartment and flat balcony is very beautiful.
For more information contact AASHIYANA STAR PROPERTIES
7766900371
Avrupa Konutlari Yenimahalle - Listing TurkeyListing Turkey
Welcome to Avrupa Konutları Yenimahalle, where luxury living meets unparalleled convenience in the heart of Istanbul. Developed by Artaş Holding, one of Turkey’s leading construction companies, this prestigious residential project offers a contemporary lifestyle experience like no other.
https://listingturkey.com/property/avrupa-konutlari-yenimahalle/
Omaxe Sports City Dwarka stands out as a premier residential and recreational destination, offering a blend of luxury and sports-centric living. Located in the thriving area of Dwarka, this project by Omaxe Limited is designed to cater to modern lifestyle needs while promoting a healthy, active living environment.
Green Homes, Islamabad Presentation .pdfticktoktips
Green Homes Islamabad offers beautifully designed 5, 8, and 10 Marla homes near the airport and motorway. Enjoy luxury, convenience, and high rental returns in a prime location.
Brigade Insignia offers meticulously designed apartments with modern architecture and premium finishes. The project features spacious 3,3.5,4 and 5 BHK units, each thoughtfully planned to provide maximum comfort, natural light, and ventilation.
https://www.newprojectbangalore.com/brigade-insignia-yelahanka-bangalore.html
Referans Bahcesehir which is being constructed, in the center of the most regional destination as Bahçeşehir, shines out with its central location and unique landscape including social facilities such as a fitness center, sauna, sports facilities, children’s playground and recreational areas.
Not only drawing attention for immediate surroundings including commercial centers and private schools but also providing the easily accessible location with closeness to Tem Highway and connection roads, ongoing construction of 3rd Bridge Connection roads and Metro Projects
Bahcesehir is a rising value in the great city of Istanbul… Located at a new transportation junction in the northwest of the City… Located at such a spot that the access roads for the 3rd bridge and for the 3rd Airport will reach the region in 2016. The Marmaray and the Subway will extend all the way to Referans Bahcesehir respectively in 2018 and 2019.
465 flats and 34 stores are designed with an outstanding approach and arranged with a unique perspective offering the following options: 1 plus 1, 2 plus 1, 3 plus 1, 3.5 plus 1, 4 plus 1, and 4.5 plus 1. It is planned so as to safeguard you and your loved ones based upon a modern, technological safety approach. As you experience the joy and luxury here, you will be content and feet at ease.
It is worth seeing both inside and outside with heart-warming cafes, tasty restaurants and elegant stores… And it is ready to offer a vivacious social life with a warm and cozy space design.
A folding swimming pool and indoor swimming pools, playgrounds, Turkish bath, sauna… It has them all. Everything you need for your well-being and for having a pleasant time will be at your service. You simply need to align the rhythm of life with the rhythm of Referans Bahcesehir.
https://listingturkey.com/property/referans-bahcesehir/
Torun Center Residences Istanbul - Listing TurkeyListing Turkey
THERE IS LIFE IN ITS CENTER!
The most energetic spot of the city that will add utterly different pleasures to your life, with a park that will make Istanbul breathe, delighting indoor and outdoor bistros, cafes, restaurants, the brand-new Food Hall concept, where dozens of unique tastes are served together, market area, cinema, theater, fitness club, SPA and event venue...
All the pleasures that will enrich your lives are awaiting you on the most beautiful side of the city, at Torun Center Residences. In Mecidiyeköy, where the heart of Istanbul beats, business, life and entertainment opportunities are located at the exact center, at Torun Center, the most beautiful side of the city.
Penthouse apartments and different styles of flats from 1 + 1 to 4 + 1, from 100 to 425 square meters in a 42-story residence tower, have been designed for those who want to live in the center of magnificence. Torun Center is the redefinition of a better life with specially landscaped floor gardens, apartment options with private balconies, and automatic glass systems equipped with Trickle Ventilation that offers clean air comfort.
Business and life in the same place
Excellent service
Torun Center has many delightful details, from a swimming pool to sunbathing and resting terrace. With 24/7 concierge services, 24/7 security, valet, technical service, closed-circuit camera system (CCTV), central heating and cooling system, it makes your life easier.
Delightful details
The two-story Torun Center Lounge, with its indoor and outdoor seating areas, children's playroom, private dining and TV lounge, promises unforgettable memories to you and your loved ones with its unique Istanbul view.
Neighboring to the most pleasant square of Istanbul
A few steps from the Torun Center Residences, you can reach the city's most modern city square and open the doors of a quality city life. Torun Center Residences brings together on the same project the long-awaited city life for Istanbul and gourmet restaurants, cafes, gym and SPA, and state-of-the-art cinema and Artı Stage, hosting the most famous plays of the season.
Located at the intersection of alternative public transportation options such as the metro and Metrobus, Torun Center comes to the fore as the most accessible office for both sides of Istanbul. With a central location and rich transportation lines, Torun Center offices make life easier for employees and increase productivity.
Scanning tenants in NYC requires a thorough and compliant approach to ensure you find reliable renters. For a positive rental experience, consider hiring a property management service. Belgium Management LLC specializes in NYC rental property management and tenant relationship management. We prioritize tenant satisfaction, making us a trusted name in New York property management. Our dedicated team ensures tenants feel valued and supported throughout their lease.
MC Heights-Best Construction Company in jhanglaraibfatim009
MC Heights stands as the epitome of excellence in construction within Jhang. With a commitment to unparalleled quality and innovative design, MC Heights redefines urban living in the heart of Jhang. Offering luxurious residential spaces, cutting-edge commercial complexes, and vibrant community areas, MC Heights caters to the diverse needs of modern lifestyles. Our dedication to superior craftsmanship and customer satisfaction ensures that every aspect of MC Heights exceeds expectations, making it the premier choice for those seeking unparalleled sophistication and comfort in Jhang.
Elegant Evergreen Homes - Luxury Apartments Redefining Comfort in Yelahanka, ...JagadishKR1
Experience unmatched luxury at Elegant Evergreen Homes, offering exquisite 2, 3, and 4 BHK apartments in the serene locality of Yelahanka, Bangalore. These meticulously crafted homes blend modern design with timeless elegance, providing a harmonious living environment. Enjoy top-tier amenities and a prime location, making Elegant Evergreen Homes the ideal choice for discerning homeowners.
Urbanrise Paradise on Earth - Unveiling Unprecedented Luxury in Exquisite Vil...JagadishKR1
Immerse yourself in the epitome of luxury living at Urbanrise Paradise on Earth. These opulent 4 BHK villas, nestled off the prestigious Kanakapura Road in Bangalore, redefine elegance and sophistication. With meticulous craftsmanship, breathtaking design, and unparalleled amenities, Urbanrise Paradise on Earth offers a sanctuary where every moment is infused with luxury and serenity. Experience a life of grandeur and indulgence at this exclusive residential enclave.
Presentation to Windust Meadows HOA Board of Directors June 4, 2024: Focus o...Joseph Lewis Aguirre
Presentation to Windust Meadows HOA Board of Directors June 4, 2024: Focus on Public Safety as Job #1, Engagement, Wealth of HOA, Branding, Communication, Culture, Civic Responsibility
Oeiras Tech City, Developed by RE Capital and REIG, Will Become Lisbon's Futu...Newman George Leech
Oeiras Tech City, a historic development in the Oeiras municipality of Lisbon, is acquired by RE Capital and REIG. It is located on a 93,000-square-meter plot of land and combines co-living, business, and residential areas. It highlights ESG principles and is close to Tagus Park, which improves the urban landscape of Lisbon.
Lixin Azarmehr, a Los Angeles-based real estate development trailblazer, co-founded JL Real Estate Development (JL RED) in 2015 and serves as its CEO. Her expertise has propelled the firm to specialize in luxury residential and mixed-use commercial projects, with a portfolio that features upscale retail spaces and sophisticated care facilities.
One FNG by Group 108 Sector 142 Noida Construction UpdateOne FNG
One FNG by Group 108 is launching a new commercial project in Sector 142 Noida. Office space and high street retail shops on the FNG and Noida Expressway. For more information visit the website https://www.onefng.com/
One FNG by Group 108 Sector 142 Noida Construction Update
Rebgv stats-pkg-january-2019
1. News Release
FOR IMMEDIATE RELEASE:
Home listings increase while buyers remain in holding pattern
VANCOUVER, BC – February 4, 2019 – Home listings continue to increase across all housing
categories in the Metro Vancouver* housing market while home buyer activity remains below
historical averages.
The Real Estate Board of Greater Vancouver (REBGV) reports that residential home sales in the
region totalled 1,103 in January 2019, a 39.3 per cent decrease from the 1,818 sales recorded in
January 2018, and a 2.9 per cent increase from the 1,072 homes sold in December 2018.
Last month’s sales were 36.3 per cent below the 10-year January sales average and were the
lowest January-sales total since 2009.
“REALTORS® are seeing more traffic at open houses compared to recent months, however,
buyers are choosing to remain in a holding pattern for the time being,” Phil Moore, REBGV
president said.
There were 4,848 detached, attached and apartment homes newly listed for sale on the Multiple
Listing Service® (MLS®) in Metro Vancouver in January 2019. This represents a 27.7 per cent
increase compared to the 3,796 homes listed in January 2018 and a 244.6 per cent increase
compared to the 1,407 homes listed in December 2018.
The total number of homes currently listed for sale on the MLS® system in Metro Vancouver is
10,808, a 55.6 per cent increase compared to January 2018 (6,947) and a 5.2 per cent increase
compared to December 2018 (10,275).
For all property types, the sales-to-active listings ratio for January 2019 is 10.2 per cent. By
property type, the ratio is 6.8 per cent for detached homes, 11.9 per cent for townhomes, and
13.6 per cent for condominiums.
Generally, analysts say that downward pressure on home prices occurs when the ratio dips below
the 12 per cent mark for a sustained period, while home prices often experience upward pressure
when it surpasses 20 per cent over several months.
“Home prices have edged down across all home types in the region over the last seven months,”
Moore said.
The MLS® Home Price Index composite benchmark price for all residential homes in Metro
Vancouver is currently $1,019,600. This represents a 4.5 per cent decrease over January 2018,
and a 7.2 per cent decrease over the past six months.
2. “Economic fundamentals underpinning our market for home buyers and sellers remain strong.
Today’s market conditions are largely the result of the mortgage stress test that the federal
government imposed at the beginning of last year,” Moore said. “This measure, coupled with an
increase in mortgage rates, took away as much as 25 per cent of purchasing power from many
home buyers trying to enter the market.”
Sales of detached homes in January 2019 reached 339, a 30.4 per cent decrease from the 487
detached sales recorded in January 2018. The benchmark price for detached homes is
$1,453,400. This represents a 9.1 per cent decrease from January 2018, and an 8.3 per cent
decrease over the past six months.
Sales of apartment homes reached 559 in January 2019, a 44.8 per cent decrease compared to the
1,012 sales in January 2018. The benchmark price of an apartment property is $658,600. This
represents a 1.7 per cent decrease from January 2018, and a 6.6 per cent decrease over the past
six months.
Attached home sales in January 2019 totalled 205, a 35.7 per cent decrease compared to the 319
sales in January 2018. The benchmark price of an attached unit is $800,600. This represents a 0.5
per cent decrease from January 2018, and a 6.2 per cent decrease over the past six months.
-30-
*Editor’s Note: Areas covered by the Real Estate Board of Greater Vancouver include: Whistler, Sunshine Coast,
Squamish, West Vancouver, North Vancouver, Vancouver, Burnaby, New Westminster, Richmond, Port Moody,
Port Coquitlam, Coquitlam, Pitt Meadows, Maple Ridge, and South Delta.
The real estate industry is a key economic driver in British Columbia. In 2018, 24,619 homes changed ownership in
the Board’s area, generating $1.7 billion in economic spin-off activity and an estimated 11,720 jobs. The total dollar
value of residential sales transacted through the MLS® system in Greater Vancouver totalled $26 billion in 2018.
The Real Estate Board of Greater Vancouver is an association representing more than 14,000 REALTORS® and
their companies. The Board provides a variety of member services, including the Multiple Listing Service®. For
more information on real estate, statistics, and buying or selling a home, contact a local REALTOR® or visit
www.rebgv.org.
For more information please contact:
Craig Munn
Manager, Communication
Real Estate Board of Greater Vancouver
604.730.3146
cmunn@rebgv.org
3. Property Type Area
Benchmark
Price
Price
Index
1 Month
Change %
3 Month
Change %
6 Month
Change %
1 Year
Change %
3 Year
Change %
5 Year
Change %
10 Year
Change %
Residential / Composite Lower Mainland $956,200 262.5 -1.4% -4.0% -7.2% -3.3% 35.4% 69.6% 99.8%
Greater Vancouver $1,019,600 264.0 -1.2% -4.0% -7.2% -4.5% 29.2% 64.9% 101.2%
Bowen Island $969,500 210.2 -3.2% 0.1% -4.8% 3.0% 49.3% 72.2% 73.1%
Burnaby East $956,200 265.2 -1.3% -4.6% -8.5% -3.4% 32.8% 64.1% 103.1%
Burnaby North $874,300 264.0 -1.8% -4.3% -8.4% -4.6% 34.9% 67.8% 101.1%
Burnaby South $988,800 279.3 -0.4% -3.0% -6.8% -3.2% 39.0% 69.6% 111.4%
Coquitlam $912,300 270.6 -0.9% -3.1% -6.9% -2.2% 37.7% 77.2% 109.9%
Ladner $835,100 234.4 -1.9% -3.6% -6.0% -3.7% 19.6% 58.5% 78.3%
Maple Ridge $752,400 239.6 -2.0% -3.9% -6.9% -1.1% 53.3% 81.8% 87.9%
New Westminster $658,200 289.2 -3.0% -6.1% -8.3% -0.4% 49.8% 80.1% 112.3%
North Vancouver $1,019,500 232.4 -1.6% -4.3% -8.1% -5.4% 22.1% 57.2% 87.7%
Pitt Meadows $759,800 276.2 -0.4% -2.0% -6.0% 3.2% 62.6% 92.6% 113.1%
Port Coquitlam $756,000 258.8 0.7% -1.4% -5.9% -0.4% 43.9% 79.1% 95.9%
Port Moody $912,800 252.3 -1.0% -4.0% -6.1% -1.8% 37.8% 78.8% 96.2%
Richmond $976,300 281.3 -1.4% -3.9% -6.8% -5.1% 29.0% 66.9% 109.0%
Squamish $758,600 238.1 1.1% -2.8% -7.5% -1.2% 49.9% 96.1% 83.0%
Sunshine Coast $604,500 211.8 -2.6% 0.9% -3.4% 3.3% 51.0% 79.3% 70.0%
Tsawwassen $944,500 237.2 -2.3% -5.2% -7.2% -5.4% 16.2% 60.5% 86.2%
Vancouver East $1,025,200 300.2 -1.3% -4.8% -6.9% -6.3% 25.1% 65.8% 118.5%
Vancouver West $1,262,400 266.2 -0.8% -4.0% -7.0% -6.9% 18.9% 53.4% 103.2%
West Vancouver $2,238,000 240.6 -2.2% -5.1% -10.4% -14.3% 1.0% 39.5% 101.0%
Whistler $901,800 195.3 0.5% -4.2% -7.7% -2.0% 51.0% 98.7% 48.9%
Single Family Detached Lower Mainland $1,233,400 261.8 -1.5% -4.0% -7.6% -6.7% 21.9% 61.7% 104.2%
Greater Vancouver $1,453,400 267.6 -1.7% -4.6% -8.3% -9.1% 13.8% 55.8% 107.6%
Bowen Island $969,500 210.2 -3.2% 0.1% -4.8% 3.0% 49.3% 72.2% 73.1%
Burnaby East $1,167,600 261.1 1.0% -6.6% -11.9% -7.8% 13.9% 56.8% 107.9%
Burnaby North $1,415,300 273.7 -2.3% -4.8% -9.0% -9.7% 9.7% 52.9% 111.5%
Burnaby South $1,533,700 293.6 -2.3% -5.9% -9.0% -8.0% 16.6% 57.8% 127.8%
Coquitlam $1,195,000 265.2 -1.6% -4.6% -8.7% -6.7% 21.4% 65.1% 105.7%
Ladner $943,400 227.4 -2.2% -4.2% -7.2% -7.3% 8.9% 56.7% 76.1%
Maple Ridge $804,500 229.2 -2.4% -5.7% -8.1% -3.5% 43.9% 76.9% 86.6%
New Westminster $1,053,500 262.8 -0.4% -6.0% -9.7% -8.3% 16.4% 58.7% 105.3%
North Vancouver $1,512,200 236.5 -1.9% -5.2% -9.7% -9.5% 10.3% 57.5% 93.9%
Pitt Meadows $901,400 254.0 -1.2% -0.8% -5.7% -0.4% 45.4% 83.1% 105.8%
Port Coquitlam $943,200 251.5 -0.4% -3.3% -7.2% -3.6% 23.0% 67.7% 98.3%
Port Moody $1,454,500 268.6 -2.1% -2.3% -4.9% -2.7% 27.8% 69.7% 106.6%
Richmond $1,581,600 306.4 -0.7% -3.3% -7.0% -9.7% 14.1% 62.3% 123.8%
Squamish $982,700 248.4 0.7% 1.5% -5.4% -1.8% 48.4% 96.2% 98.9%
Sunshine Coast $600,000 210.2 -2.2% 0.4% -3.6% 2.8% 50.4% 78.7% 68.7%
Tsawwassen $1,152,200 248.1 -3.4% -6.9% -9.0% -8.7% 10.2% 63.4% 101.2%
Vancouver East $1,428,700 315.8 -1.3% -3.5% -6.9% -8.6% 15.8% 64.6% 140.3%
Vancouver West $3,049,700 313.1 -2.7% -6.7% -9.1% -14.1% 4.1% 42.1% 129.5%
West Vancouver $2,622,800 247.6 -1.9% -4.9% -10.0% -15.4% -1.6% 36.7% 108.4%
Whistler $1,705,000 217.8 0.3% -0.3% -3.6% -2.4% 48.6% 85.0% 70.3%
HOW TO READ THE TABLE:
• Benchmark Price: Estimated sale price of a benchmark property. Benchmarks represent a typical property within each market.
• Price Index: Index numbers estimate the percentage change in price on typical and constant quality properties over time. All figures are based on past sales.
• x Month/Year Change %: Percentage change of index over a period of x month(s)/year(s) *
In January 2005, the indexes are set to 100.
Townhome properties are similar to Attached properties, a category that was used in the previous MLSLink HPI, but do not included duplexes.
The above info is deemed reliable, but is not guaranteed. All dollar amounts in CDN.
January 2019*
* MLS®, Multiple Listing Service®, and all related graphics are trademarks of The Canadian Real Estate Association 1 of 15
4. Property Type Area
Benchmark
Price
Price
Index
1 Month
Change %
3 Month
Change %
6 Month
Change %
1 Year
Change %
3 Year
Change %
5 Year
Change %
10 Year
Change %
January 2019*
Townhouse Lower Mainland $675,700 243.7 -1.5% -3.3% -6.3% -0.3% 45.7% 70.1% 85.3%
Greater Vancouver $800,600 254.8 -1.1% -3.4% -6.2% -0.5% 40.2% 69.1% 92.9%
Burnaby East $680,300 251.3 -2.3% -4.5% -7.2% 1.9% 60.4% 63.7% 86.8%
Burnaby North $723,900 270.2 -0.1% -4.9% -7.5% -1.4% 42.1% 68.8% 98.2%
Burnaby South $792,800 273.1 0.3% -2.3% -6.3% 0.8% 49.4% 69.1% 105.0%
Coquitlam $672,300 246.7 0.7% -1.3% -5.4% 1.4% 42.1% 73.2% 90.9%
Ladner $740,500 258.2 -2.6% -4.5% -7.1% -4.6% 35.5% 60.6% 91.8%
Maple Ridge $538,700 250.1 -2.5% -2.6% -5.1% 0.9% 63.6% 85.0% 85.3%
New Westminster $696,200 275.3 -2.5% -4.1% -5.2% 0.3% 46.6% 71.6% 109.4%
North Vancouver $979,900 238.1 -1.4% -4.5% -5.2% -1.2% 33.4% 65.3% 93.7%
Pitt Meadows $634,200 274.4 -0.3% -4.2% -6.1% 7.4% 66.6% 95.7% 107.3%
Port Coquitlam $637,700 241.4 0.6% -1.3% -7.1% 0.5% 44.6% 67.3% 84.7%
Port Moody $643,900 217.6 -2.6% -4.9% -6.6% 1.8% 24.1% 63.0% 68.0%
Richmond $808,200 265.6 -1.4% -5.1% -7.0% -1.7% 36.6% 62.4% 97.8%
Squamish $661,600 225.6 -0.7% -8.7% -7.5% 0.6% 49.9% 92.0% 71.3%
Tsawwassen $732,200 272.7 -2.2% -2.6% -3.6% -4.1% 40.9% 71.2% 102.6%
Vancouver East $848,200 278.4 -0.2% 1.8% -5.0% -1.1% 28.1% 62.5% 102.6%
Vancouver West $1,216,600 268.7 -1.6% -1.3% -5.6% -2.5% 32.0% 71.4% 109.3%
Whistler $872,400 218.2 -1.1% -8.3% -6.8% 1.6% 56.2% 101.5% 65.7%
Apartment Lower Mainland $642,500 271.5 -1.2% -4.1% -7.2% -0.7% 53.1% 80.0% 100.2%
Greater Vancouver $658,600 264.3 -0.8% -3.6% -6.6% -1.7% 45.6% 73.7% 98.9%
Burnaby East $743,900 285.4 -3.4% -2.3% -5.6% -4.0% 50.3% 70.6% 106.8%
Burnaby North $606,400 258.9 -2.0% -3.9% -8.3% -1.9% 60.8% 81.8% 97.9%
Burnaby South $687,900 276.2 0.3% -1.9% -6.0% -1.4% 54.4% 78.3% 106.7%
Coquitlam $515,500 282.9 -0.7% -2.5% -6.1% 0.6% 61.4% 93.4% 119.3%
Ladner $463,400 219.6 0.3% -0.3% -1.9% 7.4% 41.3% 52.6% 60.3%
Maple Ridge $359,500 256.7 -0.3% -1.2% -6.8% 1.8% 74.3% 86.8% 86.7%
New Westminster $524,400 297.1 -3.6% -6.4% -8.5% 1.2% 63.9% 87.1% 113.1%
North Vancouver $559,300 224.4 -1.4% -3.9% -8.0% -2.8% 37.2% 54.2% 78.2%
Pitt Meadows $503,300 296.8 0.1% -2.2% -7.3% 1.4% 77.2% 97.3% 115.9%
Port Coquitlam $458,700 274.3 1.7% 0.1% -4.6% 1.6% 70.6% 100.1% 96.1%
Port Moody $629,400 262.3 0.3% -4.5% -6.6% -2.1% 59.9% 97.1% 107.0%
Richmond $657,500 274.5 -1.6% -3.6% -6.1% -1.2% 53.5% 80.0% 106.5%
Squamish $468,200 225.5 2.7% -4.0% -12.7% -4.5% 49.8% 110.6% 66.5%
Tsawwassen $497,500 209.8 1.1% 0.1% -1.2% 8.0% 46.4% 57.7% 53.1%
Vancouver East $530,500 292.7 -1.4% -6.8% -6.8% -3.9% 41.9% 72.0% 101.2%
Vancouver West $783,400 254.2 0.0% -3.2% -6.2% -3.6% 30.5% 62.1% 95.8%
West Vancouver $1,108,800 224.6 -2.8% -4.2% -10.2% -6.0% 23.7% 63.6% 84.1%
Whistler $506,000 165.9 1.8% -3.3% -11.6% -5.2% 52.3% 137.7% 24.8%
HOW TO READ THE TABLE:
• Benchmark Price: Estimated sale price of a benchmark property. Benchmarks represent a typical property within each market.
• Price Index: Index numbers estimate the percentage change in price on typical and constant quality properties over time. All figures are based on past sales.
• x Month/Year Change %: Percentage change of index over a period of x month(s)/year(s)
In January 2005, the indexes are set to 100. *
Townhome properties are similar to attached properties, a category that was used in the previous MLSLink HPI, but do not included duplexes.
Lower Mainland includes areas serviced by both Real Estate Board of Greater Vancouver & Fraser Valley Real Estate Board.
The above info is deemed reliable, but is not guaranteed. All dollar amounts in CDN.
* MLS®, Multiple Listing Service®, and all related graphics are trademarks of The Canadian Real Estate Association 2 of 15