April 2021 - TRREB Market Report
•
0 likes•220 views

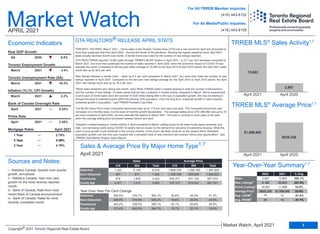
Home sales in the GTA set a new record for April 2021 at 13,663 sales, more than quadruple the sales in April 2020 during the first full month of the pandemic. While sales remained strong, there was a marked slowing in both transactions and new listings in April 2021 compared to March 2021. The average home price in April 2021 was $1,090,992, up 33% from April 2020 but flat compared to March 2021.

Recommended
More Related Content
What's hot
What's hot (18)
Similar to April 2021 - TRREB Market Report
Similar to April 2021 - TRREB Market Report (20)
More from Michelle Makos
More from Michelle Makos (13)
Recently uploaded
Recently uploaded (20)
April 2021 - TRREB Market Report
- 1. Sales New Listings Active Listings Average Price Avg. LDOM Avg. PDOM 2,957 13,663 362.1% 6,180 20,825 237.0% 10,561 11,668 10.5% $820,226 $1,090,992 33.0% 19 10 -47.4% 24 14 -41.7% 2020 2021 % Chg. Year Market Watch APRIL 2021 Economic Indicators April 2021 GTA REALTORS® RELEASE APRIL STATS TORONTO, ONTARIO, May 5, 2021 – Home sales in the Greater Toronto Area (GTA) set a new record for April and amounted to more than quadruple that from April 2020 – the first full month of the pandemic. Bucking the regular seasonal trend, April 2021 sales actually declined month-over-month. A similar trend was noted for the number of new listings reported. GTA REALTORS® reported 13,663 sales through TRREB’s MLS® System in April 2021 – a 12.7 per cent decrease compared to March 2021, but more than quadruple the number of sales reported in April 2020, when the economic impact of COVID-19 was arguably the worst. Compared to the ten-year sales average of 10,000 for the April 2010 to April 2019 period, the April 2021 sales result was up by 36.6 per cent. New listings followed a similar track – down by 8.4 per cent compared to March 2021, but more than triple the number of new listings reported in April 2020. Compared to the ten-year new listings average for the April 2010 to April 2019 period, the April 2021 new listings count was up by 18.3 per cent. “While sales remained very strong last month, many REALTORS® noted a marked slowing in both the number of transactions and the number of new listings. It makes sense that we had a pullback in market activity compared to March. We’ve experienced a torrid pace of home sales since the summer of 2020 while seeing little in the way of population growth. We may be starting to exhaust the pool of potential buyers within the existing GTA population. Over the long term, sustained growth in sales requires sustained growth in population,” said TRREB President Lisa Patel. The MLS® Home Price Index Composite benchmark was up by 17.8 per cent year-over-year. The Composite benchmark also increased on a monthly basis, but the pace of monthly growth decelerated. The average selling price of $1,090,992 was up by 33 per cent compared to April 2020, but was basically flat relative to March 2021. This was in contrast to most years in the past when the average selling price increased between March and April. “Despite a modest slowing in market activity in April compared to March, selling prices for all major home types remained very high. Low borrowing costs during COVID-19 clearly had an impact on the demand for and price of ownership housing. While the pace of price growth could moderate in the coming months, home prices will likely continue on the upward trend. Renewed population growth over the next year coupled with a persistent lack of new inventory will underpin home price appreciation,” said TRREB Chief Market Analyst Jason Mercer. Sources and Notes: i - Statistics Canada, Quarter-over-quarter growth, annualized ii - Statistics Canada, Year-over-year growth for the most recently reported month iii - Bank of Canada, Rate from most recent Bank of Canada announcement iv - Bank of Canada, Rates for most recently completed month For All TRREB Member Inquiries: For All Media/Public Inquiries: (416) 443-8152 (416) 443-8158 April 2020 April 2021 13,663 2,957 Detached Semi-Detached Townhouse Condo Apt 1,322 5,194 6,516 1,699,756 1,308,185 1,387,629 487 817 1,304 1,308,799 925,938 1,068,923 578 1,855 2,433 942,371 831,152 857,574 2,277 1,013 3,290 727,137 612,341 691,791 Sales Average Price 416 905 Total 416 905 Total Home Type Year-Over-Year Per Cent Change April 2020 April 2021 $1,090,992 $820,226 Detached Semi-Detached Townhouse Condo Apt 326.5% 376.1% 365.1% 36.8% 44.0% 41.3% 289.6% 316.8% 306.2% 19.6% 28.9% 23.6% 440.2% 338.5% 359.1% 20.1% 26.8% 25.9% 373.4% 450.5% 394.7% 18.7% 25.1% 19.6% TRREB MLS® Sales Activity1,7 TRREB MLS® Average Price1,7 Sales & Average Price By Major Home Type1,7 Year-Over-Year Summary1,7 April 2021 0.25% April 2021 2.45% 1 Year 2.79% 3 Year 3.49% 5 Year 4.79% March 2021 2.2% March 2021 10.3% March 2021 -3.4% Q4 2020 9.5% Real GDP Growth Toronto Employment Growth Toronto Unemployment Rate (SA) Inflation (Yr./Yr. CPI Growth) Bank of Canada Overnight Rate Prime Rate 1 Market Watch, April 2021 Copyright® 2021 Toronto Regional Real Estate Board April 2021 Mortgage Rates 2 3 1 5 5
- 2. Toronto Regional Real Estate Board YEAR-TO-DATE, 2021 $0 to $99,999 $100,000 to $199,999 $200,000 to $299,999 $300,000 to $399,999 $400,000 to $499,999 $500,000 to $599,999 $600,000 to $699,999 $700,000 to $799,999 $800,000 to $899,999 $900,000 to $999,999 $1,000,000 to $1,249,999 $1,250,000 to $1,499,999 $1,500,000 to $1,749,999 $1,750,000 to $1,999,999 $2,000,000+ 0 0 0 0 0 0 0 0 0 0 0 0 0 0 1 0 0 0 0 1 2 0 0 1 8 0 1 0 0 12 10 0 2 1 41 0 4 0 1 59 19 1 2 38 389 0 2 0 2 453 78 15 10 144 980 0 1 0 0 1,228 168 49 91 314 873 6 2 2 3 1,508 326 99 251 296 382 10 0 1 0 1,365 573 247 336 183 230 19 1 0 1 1,590 698 342 271 60 140 17 0 3 0 1,531 1,499 293 205 60 122 36 0 2 0 2,217 1,241 117 91 14 57 4 1 0 0 1,525 715 71 27 2 21 1 0 0 0 837 401 38 11 5 12 0 0 0 0 467 786 32 13 5 34 0 0 0 0 870 Detached Semi-Detached Att/Row/Twnhouse Condo Townhouse Condo Apt Link Co-Op Apt Det Condo Co-Ownership Apt Total Name $0 to $99,999 $100,000 to $199,999 $200,000 to $299,999 $300,000 to $399,999 $400,000 to $499,999 $500,000 to $599,999 $600,000 to $699,999 $700,000 to $799,999 $800,000 to $899,999 $900,000 to $999,999 $1,000,000 to $1,249,999 $1,250,000 to $1,499,999 $1,500,000 to $1,749,999 $1,750,000 to $1,999,999 $2,000,000+ 0 0 0 0 4 0 0 0 0 4 0 0 0 0 23 0 1 0 0 24 9 0 0 2 41 0 8 0 0 60 20 0 4 14 241 0 12 1 12 304 66 4 4 155 2,003 0 7 0 7 2,246 241 34 25 489 3,967 3 6 3 5 4,773 532 190 285 957 3,075 16 10 9 3 5,077 1,105 329 800 1,013 1,358 35 1 4 0 4,645 1,828 885 1,182 540 809 61 4 4 1 5,314 2,409 1,123 873 178 462 52 3 7 0 5,107 4,991 977 826 178 367 97 1 3 0 7,440 4,326 339 255 55 158 29 3 2 0 5,167 2,382 192 80 25 69 1 1 1 0 2,751 1,300 93 22 12 39 1 2 1 0 1,470 2,549 97 35 12 80 0 0 0 0 2,773 Detached Semi-Detached Att/Row/Twnhouse Condo Townhouse Condo Apt Link Co-Op Apt Det Condo Co-Ownership Apt Total Name APRIL 2021 SALES BY PRICE RANGE AND HOUSE TYPE 1,7 SALES BY PRICE RANGE AND HOUSE TYPE 1,7 Total Sales Share of Total Sales (%) Average Price ($) 6,516 1,304 1,310 1,123 3,290 93 12 8 7 13,663 47.7% 9.5% 9.6% 8.2% 24.1% 0.7% 0.1% 0.1% 0.1% 100.0% $1,387,629 $1,068,923 $946,412 $753,943 $691,791 $968,531 $568,541 $884,938 $587,059 $1,090,992 21,759 4,264 4,391 3,630 12,696 295 59 35 28 47,157 46.1% 9.0% 9.3% 7.7% 26.9% 0.6% 0.1% 0.1% 0.1% 100.0% $1,385,624 $1,048,252 $943,053 $747,051 $657,365 $978,721 $630,332 $870,328 $456,533 $1,064,261 Total Sales Share of Total Sales (%) Average Price ($)
- 3. TRREB Total 13,663 $14,906,219,168 $1,090,992 $940,000 20,825 64.3% 11,668 1.3 106% 10 14 Halton Region 1,403 $1,695,667,838 $1,208,601 $1,045,000 1,964 74.0% 947 1.0 105% 10 12 Burlington 391 $412,514,057 $1,055,023 $931,000 502 76.9% 255 0.9 105% 12 13 Halton Hills 147 $157,224,045 $1,069,551 $975,000 202 80.6% 88 0.8 107% 8 9 Milton 342 $362,981,013 $1,061,348 $972,500 521 76.5% 212 0.7 107% 9 11 Oakville 523 $762,948,723 $1,458,793 $1,265,000 739 68.7% 392 1.3 104% 10 14 Peel Region 2,733 $2,829,586,241 $1,035,341 $935,000 4,224 67.3% 2,111 1.0 105% 10 13 Brampton 1,331 $1,338,194,311 $1,005,405 $930,000 2,144 69.2% 989 0.8 105% 9 12 Caledon 159 $217,986,473 $1,370,984 $1,180,000 249 70.3% 150 1.2 103% 11 14 Mississauga 1,243 $1,273,405,457 $1,024,461 $907,000 1,831 64.9% 972 1.2 105% 10 13 City of Toronto 4,694 $5,107,168,556 $1,088,021 $875,000 7,481 56.8% 4,627 1.7 107% 11 14 Toronto West 1,231 $1,274,823,361 $1,035,600 $910,000 1,897 62.0% 1,089 1.4 108% 10 13 Toronto Central 2,250 $2,590,882,339 $1,151,503 $799,500 3,782 50.1% 2,680 2.2 105% 12 17 Toronto East 1,213 $1,241,462,856 $1,023,465 $968,800 1,802 67.3% 858 1.0 112% 9 10 York Region 2,454 $3,149,183,412 $1,283,286 $1,175,000 4,031 61.0% 2,706 1.6 105% 12 16 Aurora 190 $242,823,901 $1,278,021 $1,200,000 268 63.7% 152 1.4 105% 10 13 East Gwillimbury 118 $147,952,114 $1,253,831 $1,180,500 137 67.6% 87 1.3 105% 17 19 Georgina 150 $124,693,987 $831,293 $780,000 212 72.6% 120 1.1 105% 13 17 King 68 $128,897,650 $1,895,554 $1,889,400 123 58.9% 145 2.9 100% 15 20 Markham 613 $799,139,136 $1,303,653 $1,228,000 1,003 61.2% 607 1.4 109% 10 13 Newmarket 206 $222,419,052 $1,079,704 $1,022,500 338 68.8% 182 1.0 106% 9 13 Richmond Hill 392 $543,626,089 $1,386,801 $1,252,500 762 54.8% 585 2.0 105% 13 18 Vaughan 582 $764,394,541 $1,313,393 $1,200,000 1,000 57.9% 714 1.7 104% 11 16 Whitchurch-Stouffville 135 $175,236,942 $1,298,051 $1,134,500 188 66.4% 114 1.6 105% 12 17 Durham Region 1,771 $1,589,900,104 $897,741 $830,000 2,336 78.5% 882 0.7 111% 9 11 Ajax 283 $267,376,960 $944,795 $895,000 400 77.8% 134 0.5 110% 9 11 Brock 39 $31,891,600 $817,733 $775,000 57 79.4% 34 1.0 107% 9 9 Clarington 329 $282,583,913 $858,918 $811,000 395 80.7% 137 0.7 114% 9 11 Oshawa 517 $402,699,910 $778,917 $750,000 661 79.4% 243 0.6 113% 9 11 Pickering 198 $200,849,425 $1,014,391 $892,500 300 74.0% 134 0.8 107% 9 12 Scugog 43 $43,264,478 $1,006,151 $826,000 51 74.3% 35 1.4 104% 20 25 Uxbridge 51 $61,518,600 $1,206,247 $1,011,000 62 80.5% 32 1.2 107% 21 21 Whitby 311 $299,715,218 $963,715 $905,000 410 78.9% 133 0.6 112% 8 10 Dufferin County 83 $65,256,217 $786,219 $780,000 88 89.4% 35 0.5 106% 10 12 Orangeville 83 $65,256,217 $786,219 $780,000 88 89.4% 35 0.5 106% 10 12 Simcoe County 525 $469,456,800 $894,203 $840,000 701 77.2% 360 1.0 104% 11 14 Adjala-Tosorontio 34 $36,301,200 $1,067,682 $938,500 52 79.3% 26 1.4 101% 10 10 Bradford West Gwillimbury 126 $131,636,009 $1,044,730 $965,500 178 73.2% 86 0.9 104% 10 16 Essa 74 $56,681,341 $765,964 $713,000 79 86.5% 25 0.8 106% 7 8 Innisfil 173 $147,802,740 $854,351 $815,000 219 74.9% 127 1.3 104% 13 16 New Tecumseth 118 $97,035,510 $822,335 $797,500 173 79.7% 96 1.0 103% 11 13 Sub_Municipality # of Sales Dollar Volume Average Price Median Price New Listings SNLR (Trend) Active Listings Mos Inv (Trend) Avg. SP/LP Avg. LDOM Avg. PDOM Toronto Regional Real Estate Board SUMMARY OF EXISTING HOME TRANSACTIONS ALL TRREB AREAS ALL HOME TYPES, APRIL 2021 1 1 1 2 8 3 9 4 5 3 Market Watch, April 2021 Copyright® 2021 Toronto Regional Real Estate Board 5
- 4. TRREB Total 13,663 $14,906,219,168 $1,090,992 $940,000 20,825 64.3% 11,668 1.3 106% 10 14 City of Toronto Total 4,694 $5,107,168,556 $1,088,021 $875,000 7,481 56.8% 4,627 1.7 107% 11 14 Toronto West 1,231 $1,274,823,361 $1,035,600 $910,000 1,897 62.0% 1,089 1.4 108% 10 13 Toronto W01 91 $119,740,635 $1,315,831 $1,100,000 132 61.5% 56 1.1 112% 7 8 Toronto W02 124 $160,916,127 $1,297,711 $1,214,000 172 69.5% 67 0.8 113% 8 10 Toronto W03 96 $97,463,536 $1,015,245 $968,250 148 62.6% 82 1.1 115% 7 11 Toronto W04 114 $98,283,551 $862,136 $825,000 173 59.0% 119 1.7 107% 13 17 Toronto W05 158 $139,122,946 $880,525 $900,000 280 63.3% 188 1.4 106% 13 15 Toronto W06 206 $187,758,989 $911,451 $823,000 357 57.1% 229 1.7 106% 10 13 Toronto W07 38 $64,148,871 $1,688,128 $1,632,500 50 61.5% 26 1.4 110% 8 17 Toronto W08 238 $272,635,661 $1,145,528 $796,444 329 62.5% 173 1.4 107% 9 12 Toronto W09 60 $56,023,775 $933,730 $892,500 100 62.0% 61 1.4 107% 10 13 Toronto W10 106 $78,729,270 $742,729 $715,000 156 66.1% 88 1.2 105% 10 12 Toronto Central 2,250 $2,590,882,339 $1,151,503 $799,500 3,782 50.1% 2,680 2.2 105% 12 17 Toronto C01 703 $634,260,799 $902,220 $735,277 1,166 46.7% 782 2.4 106% 12 19 Toronto C02 114 $189,644,779 $1,663,551 $1,405,400 197 43.7% 205 2.9 103% 15 23 Toronto C03 71 $123,317,989 $1,736,873 $1,300,000 126 57.7% 75 1.6 104% 11 15 Toronto C04 127 $272,305,052 $2,144,134 $2,050,018 201 55.5% 127 1.7 105% 12 19 Toronto C06 56 $67,773,188 $1,210,236 $1,087,500 99 55.9% 56 1.6 104% 8 12 Toronto C07 138 $167,101,702 $1,210,882 $890,750 257 53.5% 192 2.0 105% 12 16 Toronto C08 325 $260,494,671 $801,522 $692,800 555 45.8% 390 2.5 105% 13 18 Toronto C09 38 $84,130,222 $2,213,953 $1,619,950 55 50.3% 54 2.6 100% 16 17 Toronto C10 118 $132,352,912 $1,121,635 $798,750 178 54.8% 113 1.9 106% 14 18 Toronto C11 58 $69,736,027 $1,202,345 $745,000 100 57.0% 62 1.7 107% 11 13 Toronto C12 41 $115,464,500 $2,816,207 $2,520,000 96 43.9% 116 4.0 102% 17 17 Toronto C13 86 $120,011,500 $1,395,483 $994,000 161 59.1% 110 1.6 106% 10 13 Toronto C14 162 $166,131,401 $1,025,502 $731,500 283 53.3% 207 2.2 104% 10 14 Toronto C15 213 $188,157,597 $883,369 $660,000 308 58.1% 191 1.8 107% 11 15 Toronto East 1,213 $1,241,462,856 $1,023,465 $968,800 1,802 67.3% 858 1.0 112% 9 10 Toronto E01 135 $168,800,325 $1,250,373 $1,280,000 182 65.9% 73 0.8 118% 6 8 Toronto E02 102 $153,685,784 $1,506,723 $1,350,500 153 64.2% 54 0.9 115% 7 8 Toronto E03 136 $168,615,677 $1,239,821 $1,238,000 212 64.2% 96 0.9 114% 7 8 Toronto E04 149 $128,364,665 $861,508 $882,000 234 69.3% 97 0.8 109% 9 11 Toronto E05 104 $90,376,440 $869,004 $791,500 172 65.4% 113 1.2 110% 9 12 Toronto E06 61 $79,013,017 $1,295,295 $1,100,000 79 64.6% 39 1.1 108% 9 11 Toronto E07 132 $114,830,241 $869,926 $820,000 189 68.9% 93 1.0 111% 9 10 Toronto E08 82 $75,394,927 $919,450 $757,500 117 66.6% 68 1.2 108% 11 13 Toronto E09 123 $95,834,630 $779,143 $690,000 200 68.1% 86 1.0 109% 9 11 Toronto E10 79 $83,371,749 $1,055,339 $999,999 123 69.5% 71 1.0 109% 11 14 Toronto E11 110 $83,175,401 $756,140 $745,000 141 74.0% 68 0.8 109% 11 12 Municipality # of Sales Dollar Volume Average Price Median Price New Listings SNLR (Trend) Active Listings Mos Inv (Trend) Avg. SP/LP Avg. LDOM Avg. PDOM Toronto Regional Real Estate Board ALL HOME TYPES, APRIL 2021 SUMMARY OF EXISTING HOME TRANSACTIONS CITY OF TORONTO MUNICIPAL BREAKDOWN 1 1 1 2 8 3 9 4 5 4 Market Watch, April 2021 Copyright® 2021 Toronto Regional Real Estate Board 5
- 5. TRREB Total 47,157 $50,187,336,409 $1,064,261 $920,000 68,156 106% 13 17 Halton Region 4,812 $5,848,594,590 $1,215,419 $1,070,000 6,626 106% 11 14 Burlington 1,337 $1,416,506,404 $1,059,466 $952,000 1,766 106% 12 14 Halton Hills 435 $479,755,230 $1,102,886 $990,000 579 108% 9 12 Milton 1,199 $1,242,678,316 $1,036,429 $952,000 1,739 107% 8 9 Oakville 1,841 $2,709,654,640 $1,471,838 $1,300,000 2,542 104% 13 17 Peel Region 9,621 $9,891,354,391 $1,028,100 $931,000 14,133 105% 10 14 Brampton 4,799 $4,842,345,790 $1,009,032 $940,000 7,334 106% 8 10 Caledon 517 $708,075,146 $1,369,584 $1,208,500 791 104% 12 15 Mississauga 4,305 $4,340,933,455 $1,008,347 $883,000 6,008 105% 12 17 City of Toronto 16,215 $16,679,759,992 $1,028,662 $810,000 22,976 106% 16 23 Toronto West 4,101 $4,023,992,896 $981,222 $856,500 5,741 107% 15 21 Toronto Central 8,256 $8,847,049,644 $1,071,590 $740,000 11,854 103% 19 28 Toronto East 3,858 $3,808,717,452 $987,226 $950,000 5,381 112% 11 14 York Region 8,667 $10,762,144,327 $1,241,738 $1,145,000 13,597 106% 14 19 Aurora 575 $733,900,250 $1,276,348 $1,165,000 879 105% 13 17 East Gwillimbury 382 $455,027,554 $1,191,172 $1,150,000 571 107% 13 15 Georgina 544 $453,270,311 $833,217 $790,000 805 106% 13 16 King 218 $432,367,079 $1,983,335 $1,900,000 398 98% 28 39 Markham 2,110 $2,622,981,399 $1,243,119 $1,183,000 3,209 109% 13 18 Newmarket 751 $813,205,062 $1,082,830 $1,020,000 1,173 108% 8 10 Richmond Hill 1,497 $1,978,152,474 $1,321,411 $1,222,000 2,511 106% 16 22 Vaughan 2,140 $2,701,876,353 $1,262,559 $1,163,500 3,390 104% 15 20 Whitchurch-Stouffville 450 $571,363,845 $1,269,697 $1,137,500 661 105% 17 22 Durham Region 5,876 $5,262,362,089 $895,569 $840,000 8,096 112% 8 10 Ajax 872 $835,797,783 $958,484 $910,000 1,257 112% 7 9 Brock 106 $79,624,577 $751,175 $730,000 148 107% 13 17 Clarington 1,101 $932,272,944 $846,751 $805,000 1,411 114% 8 10 Oshawa 1,703 $1,313,422,783 $771,241 $745,000 2,366 115% 8 9 Pickering 714 $723,927,243 $1,013,904 $903,750 1,050 109% 9 11 Scugog 130 $129,094,185 $993,032 $857,000 180 107% 19 22 Uxbridge 161 $193,458,159 $1,201,603 $1,010,000 200 106% 17 19 Whitby 1,089 $1,054,764,415 $968,562 $915,000 1,484 113% 7 8 Dufferin County 291 $229,221,388 $787,702 $775,000 352 108% 9 10 Orangeville 291 $229,221,388 $787,702 $775,000 352 108% 9 10 Simcoe County 1,675 $1,513,899,632 $903,821 $845,000 2,376 105% 12 14 Adjala-Tosorontio 95 $104,935,891 $1,104,588 $1,020,000 121 103% 17 19 Bradford West Gwillimbury 409 $416,338,640 $1,017,943 $961,000 615 106% 9 12 Essa 222 $175,386,049 $790,027 $735,000 275 105% 12 13 Innisfil 536 $472,178,095 $880,929 $810,000 786 104% 14 17 New Tecumseth 413 $345,060,957 $835,499 $800,000 579 105% 11 13 Sub_Municipality Number of Sales Dollar Volume Average Price Median Price New Listings Avg. SP/LP Avg. LDOM Avg. PDOM Toronto Regional Real Estate Board SUMMARY OF EXISTING HOME TRANSACTIONS ALL TRREB AREAS ALL HOME TYPES, YEAR-TO-DATE 2021 1 1 1 2 4 5 5 Market Watch, April 2021 Copyright® 2021 Toronto Regional Real Estate Board 5
- 6. TRREB Total 47,157 $50,187,336,409 $1,064,261 $920,000 68,156 106% 13 17 City of Toronto Total 16,215 $16,679,759,992 $1,028,662 $810,000 22,976 106% 16 23 Toronto West 4,101 $4,023,992,896 $981,222 $856,500 5,741 107% 15 21 Toronto W01 255 $313,316,690 $1,228,693 $950,000 335 112% 12 16 Toronto W02 387 $478,325,429 $1,235,983 $1,177,000 507 113% 10 14 Toronto W03 293 $294,076,924 $1,003,676 $970,000 447 113% 12 17 Toronto W04 431 $363,586,051 $843,587 $791,000 618 106% 18 24 Toronto W05 523 $431,905,260 $825,823 $850,000 783 106% 16 21 Toronto W06 760 $670,000,603 $881,580 $755,250 1,089 104% 17 23 Toronto W07 113 $174,114,339 $1,540,835 $1,465,000 160 107% 16 27 Toronto W08 792 $868,553,715 $1,096,659 $712,500 1,022 104% 17 23 Toronto W09 209 $188,246,826 $900,703 $852,000 306 106% 15 20 Toronto W10 338 $241,867,059 $715,583 $591,775 474 104% 16 21 Toronto Central 8,256 $8,847,049,644 $1,071,590 $740,000 11,854 103% 19 28 Toronto C01 2,677 $2,210,206,179 $825,628 $700,000 3,649 103% 20 30 Toronto C02 369 $575,082,880 $1,558,490 $1,181,000 664 102% 24 33 Toronto C03 235 $380,835,707 $1,620,577 $1,271,018 371 105% 15 20 Toronto C04 389 $845,571,742 $2,173,706 $2,140,000 599 103% 14 21 Toronto C06 174 $200,595,702 $1,152,849 $1,010,005 260 105% 14 21 Toronto C07 554 $607,475,759 $1,096,527 $780,500 826 103% 20 28 Toronto C08 1,253 $969,610,399 $773,831 $676,000 1,746 103% 21 31 Toronto C09 141 $299,444,465 $2,123,720 $1,560,000 203 100% 22 30 Toronto C10 409 $404,857,646 $989,872 $755,000 545 104% 20 31 Toronto C11 175 $198,563,720 $1,134,650 $660,000 288 104% 15 22 Toronto C12 149 $464,927,677 $3,120,320 $2,825,000 301 99% 22 34 Toronto C13 309 $390,957,917 $1,265,236 $915,000 486 105% 16 20 Toronto C14 635 $623,817,632 $982,390 $690,000 867 101% 19 27 Toronto C15 787 $675,102,219 $857,817 $658,000 1,049 105% 18 26 Toronto East 3,858 $3,808,717,452 $987,226 $950,000 5,381 112% 11 14 Toronto E01 396 $489,020,447 $1,234,900 $1,250,000 546 117% 10 12 Toronto E02 299 $443,590,150 $1,483,579 $1,350,000 417 113% 10 13 Toronto E03 424 $499,626,075 $1,178,363 $1,194,000 618 115% 10 13 Toronto E04 440 $379,768,271 $863,110 $880,500 612 111% 12 13 Toronto E05 338 $303,531,501 $898,022 $795,500 514 111% 11 14 Toronto E06 176 $205,170,864 $1,165,744 $1,060,889 257 108% 11 13 Toronto E07 430 $346,019,354 $804,696 $726,500 593 111% 11 14 Toronto E08 277 $265,885,731 $959,876 $875,000 381 108% 14 19 Toronto E09 465 $347,916,231 $748,207 $645,000 583 110% 15 20 Toronto E10 254 $257,515,155 $1,013,839 $995,000 380 109% 12 15 Toronto E11 359 $270,673,673 $753,966 $750,000 480 110% 11 13 Municipality Number of Sales Dollar Volume Average Price Median Price New Listings Avg. SP/LP Avg. LDOM Avg. PDOM Toronto Regional Real Estate Board SUMMARY OF EXISTING HOME TRANSACTIONS CITY OF TORONTO MUNICIPAL BREAKDOWN ALL HOME TYPES, YEAR-TO-DATE 2021 1 1 1 2 4 5 6 Market Watch, April 2021 Copyright® 2021 Toronto Regional Real Estate Board 5
- 7. TRREB Total 6,516 $9,041,788,349 $1,387,629 $1,225,000 10,047 5,601 106% 10 Halton Region 748 $1,148,472,624 $1,535,391 $1,322,500 1,058 525 105% 11 Burlington 195 $271,246,707 $1,391,009 $1,240,000 243 126 105% 12 Halton Hills 115 $133,248,327 $1,158,681 $1,070,000 154 69 107% 9 Milton 158 $212,581,282 $1,345,451 $1,210,750 247 107 106% 10 Oakville 280 $531,396,308 $1,897,844 $1,650,944 414 223 104% 10 Peel Region 1,323 $1,754,292,057 $1,325,996 $1,225,000 2,058 997 105% 9 Brampton 730 $856,849,858 $1,173,767 $1,120,000 1,161 505 105% 9 Caledon 127 $189,870,893 $1,495,046 $1,299,000 199 129 103% 13 Mississauga 466 $707,571,306 $1,518,393 $1,359,500 698 363 105% 10 City of Toronto 1,322 $2,247,077,654 $1,699,756 $1,401,400 2,286 1,398 107% 10 Toronto West 432 $637,327,906 $1,475,296 $1,321,500 710 388 109% 9 Toronto Central 390 $958,618,031 $2,457,995 $2,186,515 781 622 104% 12 Toronto East 500 $651,131,717 $1,302,263 $1,158,250 795 388 111% 9 York Region 1,454 $2,255,955,125 $1,551,551 $1,423,500 2,446 1,778 105% 12 Aurora 125 $185,277,191 $1,482,218 $1,437,500 188 111 104% 11 East Gwillimbury 99 $130,757,614 $1,320,784 $1,245,000 117 80 105% 18 Georgina 131 $112,303,287 $857,277 $815,000 183 102 105% 12 King 54 $114,689,550 $2,123,881 $2,049,000 106 137 100% 16 Markham 316 $526,852,845 $1,667,256 $1,535,000 541 360 109% 10 Newmarket 139 $168,442,864 $1,211,819 $1,160,000 226 125 106% 9 Richmond Hill 195 $364,573,117 $1,869,606 $1,606,000 423 381 105% 15 Vaughan 302 $515,257,514 $1,706,151 $1,557,500 534 397 103% 12 Whitchurch-Stouffville 93 $137,801,143 $1,481,733 $1,280,288 128 85 104% 11 Durham Region 1,215 $1,208,176,505 $994,384 $925,000 1,573 575 111% 9 Ajax 178 $185,836,833 $1,044,027 $987,500 238 75 110% 8 Brock 39 $31,891,600 $817,733 $775,000 56 33 107% 9 Clarington 236 $220,568,123 $934,611 $877,750 283 96 114% 10 Oshawa 360 $308,824,167 $857,845 $823,500 447 135 113% 8 Pickering 114 $141,060,297 $1,237,371 $1,180,000 178 84 107% 9 Scugog 43 $43,264,478 $1,006,151 $826,000 50 29 104% 20 Uxbridge 38 $52,340,200 $1,377,374 $1,323,500 48 29 106% 26 Whitby 207 $224,390,807 $1,084,014 $1,020,000 273 94 113% 8 Dufferin County 54 $47,152,970 $873,203 $858,250 54 21 106% 10 Orangeville 54 $47,152,970 $873,203 $858,250 54 21 106% 10 Simcoe County 400 $380,661,414 $951,654 $890,000 572 307 104% 10 Adjala-Tosorontio 34 $36,301,200 $1,067,682 $938,500 52 26 101% 10 Bradford West Gwillimbury 101 $111,900,519 $1,107,926 $1,060,000 146 73 104% 9 Essa 54 $44,287,955 $820,147 $794,500 60 19 106% 8 Innisfil 136 $121,216,440 $891,297 $857,500 188 111 105% 12 New Tecumseth 75 $66,955,300 $892,737 $835,000 126 78 103% 11 Municipality Number of Sales Dollar Volume Average Price Median Price New Listings Active Listings Avg. SP/LP Avg. LDOM DETACHED, APRIL 2021 Toronto Regional Real Estate Board SUMMARY OF EXISTING HOME TRANSACTIONS ALL TRREB AREAS 1 1 2 4 5 1 1 3 7 Market Watch, April 2021 Copyright® 2021 Toronto Regional Real Estate Board
- 8. TRREB Total 6,516 $9,041,788,349 $1,387,629 $1,225,000 10,047 5,601 106% 10 City of Toronto 1,322 $2,247,077,654 $1,699,756 $1,401,400 2,286 1,398 107% 10 Toronto West 432 $637,327,906 $1,475,296 $1,321,500 710 388 109% 9 Toronto W01 22 $47,070,500 $2,139,568 $2,029,000 29 12 110% 6 Toronto W02 35 $64,583,671 $1,845,248 $1,755,000 54 21 111% 6 Toronto W03 37 $41,691,128 $1,126,787 $1,010,000 73 45 113% 7 Toronto W04 55 $63,898,263 $1,161,787 $1,100,000 103 71 108% 10 Toronto W05 42 $50,878,913 $1,211,403 $1,187,000 72 42 110% 11 Toronto W06 44 $57,422,367 $1,305,054 $1,249,784 78 52 110% 9 Toronto W07 29 $54,754,871 $1,888,099 $1,800,000 36 15 111% 8 Toronto W08 98 $176,963,948 $1,805,755 $1,658,464 147 64 108% 8 Toronto W09 29 $39,419,975 $1,359,309 $1,330,000 51 30 109% 10 Toronto W10 41 $40,644,270 $991,324 $970,000 67 36 105% 9 Toronto Central 390 $958,618,031 $2,457,995 $2,186,515 781 622 104% 12 Toronto C01 10 $22,371,000 $2,237,100 $2,228,000 18 13 105% 15 Toronto C02 20 $58,225,915 $2,911,296 $2,665,500 25 18 102% 9 Toronto C03 32 $77,018,190 $2,406,818 $1,862,900 67 43 102% 9 Toronto C04 85 $223,316,411 $2,627,252 $2,620,000 147 91 104% 8 Toronto C06 28 $49,729,800 $1,776,064 $1,533,500 49 32 104% 10 Toronto C07 54 $103,468,988 $1,916,092 $1,697,500 104 91 105% 15 Toronto C08 1 $1,340,000 $1,340,000 $1,340,000 1 1 96% 25 Toronto C09 10 $37,910,000 $3,791,000 $3,515,000 12 13 102% 9 Toronto C10 23 $50,407,688 $2,191,639 $1,968,000 36 20 106% 26 Toronto C11 15 $38,447,000 $2,563,133 $2,275,000 19 11 109% 6 Toronto C12 26 $96,868,000 $3,725,692 $3,385,000 70 90 102% 18 Toronto C13 31 $77,442,388 $2,498,142 $1,888,000 65 37 106% 9 Toronto C14 25 $64,113,075 $2,564,523 $2,188,000 82 99 101% 17 Toronto C15 30 $57,959,576 $1,931,986 $1,729,000 86 63 109% 11 Toronto East 500 $651,131,717 $1,302,263 $1,158,250 795 388 111% 9 Toronto E01 25 $41,420,736 $1,656,829 $1,530,000 27 12 111% 8 Toronto E02 31 $59,871,310 $1,931,333 $1,850,250 43 16 109% 8 Toronto E03 76 $106,782,111 $1,405,028 $1,375,000 127 63 112% 7 Toronto E04 67 $73,795,677 $1,101,428 $1,055,000 108 47 112% 9 Toronto E05 40 $47,959,188 $1,198,980 $1,153,250 65 40 112% 9 Toronto E06 49 $68,786,917 $1,403,815 $1,155,000 58 20 108% 9 Toronto E07 46 $56,150,488 $1,220,663 $1,183,400 70 37 113% 10 Toronto E08 34 $46,916,271 $1,379,890 $1,230,051 64 37 111% 7 Toronto E09 53 $55,218,570 $1,041,860 $1,015,000 105 46 112% 9 Toronto E10 50 $64,641,349 $1,292,827 $1,172,500 84 44 108% 11 Toronto E11 29 $29,589,100 $1,020,314 $980,000 44 26 111% 9 Municipality Number of Sales Dollar Volume Average Price Median Price New Listings Active Listings Avg. SP/LP Avg. LDOM DETACHED, APRIL 2021 Toronto Regional Real Estate Board SUMMARY OF EXISTING HOME TRANSACTIONS CITY OF TORONTO MUNICIPAL BREAKDOWN 1 1 2 4 5 1 1 3 8 Market Watch, April 2021 Copyright® 2021 Toronto Regional Real Estate Board
- 9. TRREB Total 1,304 $1,393,876,135 $1,068,923 $975,000 1,906 828 111% 8 Halton Region 83 $82,381,941 $992,554 $967,000 121 48 107% 7 Burlington 18 $16,660,123 $925,562 $933,000 20 9 108% 9 Halton Hills 9 $7,538,218 $837,580 $839,000 15 4 108% 7 Milton 33 $31,600,100 $957,579 $935,000 55 26 107% 6 Oakville 23 $26,583,500 $1,155,804 $1,175,000 31 9 106% 7 Peel Region 426 $393,447,070 $923,585 $920,000 645 284 107% 8 Brampton 251 $223,420,131 $890,120 $880,000 390 163 106% 8 Caledon 7 $6,332,000 $904,571 $890,000 9 4 108% 6 Mississauga 168 $163,694,939 $974,375 $960,000 246 117 107% 8 City of Toronto 487 $637,385,075 $1,308,799 $1,215,000 723 320 116% 7 Toronto West 155 $182,905,476 $1,180,035 $1,017,000 226 106 116% 7 Toronto Central 141 $217,262,967 $1,540,872 $1,468,000 237 128 114% 8 Toronto East 191 $237,216,632 $1,241,972 $1,215,000 260 86 120% 7 York Region 174 $181,234,249 $1,041,576 $1,046,500 252 121 107% 10 Aurora 15 $14,163,499 $944,233 $930,000 21 10 107% 10 East Gwillimbury 9 $8,678,000 $964,222 $1,000,000 7 2 101% 12 Georgina 5 $3,045,000 $609,000 $580,000 6 1 99% 9 King 0 $0 $0 - 1 0 - - Markham 38 $41,756,664 $1,098,860 $1,066,500 48 22 112% 9 Newmarket 18 $14,762,000 $820,111 $775,000 33 13 104% 11 Richmond Hill 24 $28,551,500 $1,189,646 $1,197,500 38 29 108% 13 Vaughan 57 $62,451,586 $1,095,642 $1,100,000 87 40 106% 10 Whitchurch-Stouffville 8 $7,826,000 $978,250 $980,000 11 4 112% 5 Durham Region 109 $80,882,800 $742,044 $735,000 133 41 114% 8 Ajax 28 $23,354,000 $834,071 $845,000 35 10 108% 12 Brock 0 $0 $0 - 0 0 - - Clarington 8 $4,937,200 $617,150 $614,000 9 4 116% 8 Oshawa 48 $32,239,500 $671,656 $658,000 62 22 120% 6 Pickering 14 $11,904,500 $850,321 $859,000 15 2 110% 6 Scugog 0 $0 $0 - 0 0 - - Uxbridge 1 $760,000 $760,000 $760,000 0 0 104% 13 Whitby 10 $7,687,600 $768,760 $786,000 12 3 112% 7 Dufferin County 5 $3,230,000 $646,000 $680,000 11 7 104% 10 Orangeville 5 $3,230,000 $646,000 $680,000 11 7 104% 10 Simcoe County 20 $15,315,000 $765,750 $772,500 21 7 103% 11 Adjala-Tosorontio 0 $0 $0 - 0 0 - - Bradford West Gwillimbury 11 $8,703,000 $791,182 $775,000 12 2 105% 10 Essa 1 $506,000 $506,000 $506,000 1 0 115% 4 Innisfil 1 $845,000 $845,000 $845,000 0 0 96% 16 New Tecumseth 7 $5,261,000 $751,571 $770,000 8 5 101% 13 Municipality Number of Sales Dollar Volume Average Price Median Price New Listings Active Listings Avg. SP/LP Avg. LDOM SEMI-DETACHED, APRIL 2021 Toronto Regional Real Estate Board SUMMARY OF EXISTING HOME TRANSACTIONS ALL TRREB AREAS 1 1 2 4 5 1 1 3 9 Market Watch, April 2021 Copyright® 2021 Toronto Regional Real Estate Board
- 10. TRREB Total 1,304 $1,393,876,135 $1,068,923 $975,000 1,906 828 111% 8 City of Toronto 487 $637,385,075 $1,308,799 $1,215,000 723 320 116% 7 Toronto West 155 $182,905,476 $1,180,035 $1,017,000 226 106 116% 7 Toronto W01 17 $28,926,244 $1,701,544 $1,690,000 25 10 123% 5 Toronto W02 38 $53,316,506 $1,403,066 $1,374,400 45 10 119% 7 Toronto W03 38 $40,716,027 $1,071,474 $999,500 42 21 118% 8 Toronto W04 3 $3,040,000 $1,013,333 $1,010,000 8 6 115% 7 Toronto W05 43 $40,846,900 $949,928 $958,000 79 42 107% 9 Toronto W06 4 $4,945,800 $1,236,450 $1,240,450 9 7 105% 6 Toronto W07 1 $1,185,000 $1,185,000 $1,185,000 1 0 119% 5 Toronto W08 2 $2,032,999 $1,016,500 $1,016,500 5 4 107% 8 Toronto W09 0 $0 $0 - 3 3 - - Toronto W10 9 $7,896,000 $877,333 $875,000 9 3 110% 6 Toronto Central 141 $217,262,967 $1,540,872 $1,468,000 237 128 114% 8 Toronto C01 28 $48,606,009 $1,735,929 $1,704,444 61 31 119% 6 Toronto C02 22 $42,844,144 $1,947,461 $1,740,278 39 24 112% 8 Toronto C03 17 $22,869,799 $1,345,282 $1,260,000 28 10 115% 6 Toronto C04 16 $27,113,322 $1,694,583 $1,660,500 12 4 115% 6 Toronto C06 0 $0 $0 - 1 3 - - Toronto C07 3 $3,481,900 $1,160,633 $1,210,900 12 7 112% 8 Toronto C08 9 $14,532,000 $1,614,667 $1,620,000 8 10 109% 6 Toronto C09 2 $4,430,000 $2,215,000 $2,215,000 4 4 103% 14 Toronto C10 10 $15,622,328 $1,562,233 $1,567,500 16 6 113% 7 Toronto C11 5 $6,995,220 $1,399,044 $1,350,000 10 6 111% 17 Toronto C12 2 $2,010,000 $1,005,000 $1,005,000 3 1 106% 9 Toronto C13 10 $11,046,645 $1,104,665 $985,000 16 9 114% 7 Toronto C14 0 $0 $0 - 0 1 - - Toronto C15 17 $17,711,600 $1,041,859 $1,050,000 27 12 110% 12 Toronto East 191 $237,216,632 $1,241,972 $1,215,000 260 86 120% 7 Toronto E01 51 $69,889,663 $1,370,386 $1,362,000 68 25 126% 5 Toronto E02 48 $70,384,856 $1,466,351 $1,388,000 56 15 120% 7 Toronto E03 42 $51,220,836 $1,219,544 $1,202,500 60 18 120% 6 Toronto E04 9 $7,885,777 $876,197 $885,000 13 5 111% 11 Toronto E05 6 $5,864,000 $977,333 $960,600 16 11 113% 9 Toronto E06 5 $5,250,500 $1,050,100 $961,500 7 1 111% 7 Toronto E07 10 $9,185,900 $918,590 $932,450 12 3 110% 8 Toronto E08 3 $2,610,000 $870,000 $890,000 2 1 110% 9 Toronto E09 4 $3,378,000 $844,500 $839,000 6 1 108% 6 Toronto E10 1 $850,000 $850,000 $850,000 5 2 106% 8 Toronto E11 12 $10,697,100 $891,425 $880,500 15 4 107% 12 Municipality Number of Sales Dollar Volume Average Price Median Price New Listings Active Listings Avg. SP/LP Avg. LDOM SEMI-DETACHED, APRIL 2021 Toronto Regional Real Estate Board SUMMARY OF EXISTING HOME TRANSACTIONS CITY OF TORONTO MUNICIPAL BREAKDOWN 1 1 2 4 5 1 1 3 10 Market Watch, April 2021 Copyright® 2021 Toronto Regional Real Estate Board
- 11. TRREB Total 1,310 $1,239,799,878 $946,412 $885,000 1,987 951 108% 9 Halton Region 248 $235,411,975 $949,242 $910,500 351 137 106% 8 Burlington 36 $31,163,600 $865,656 $852,500 56 21 105% 7 Halton Hills 14 $11,292,500 $806,607 $837,500 16 3 108% 6 Milton 96 $82,486,786 $859,237 $862,500 148 51 108% 7 Oakville 102 $110,469,089 $1,083,030 $1,013,500 131 62 104% 9 Peel Region 247 $211,485,571 $856,217 $850,000 396 186 106% 9 Brampton 191 $160,430,403 $839,950 $835,000 301 143 105% 10 Caledon 23 $20,260,580 $880,895 $885,000 35 12 105% 6 Mississauga 33 $30,794,588 $933,169 $928,000 60 31 108% 7 City of Toronto 174 $211,698,300 $1,216,657 $1,096,000 286 159 109% 12 Toronto West 47 $53,547,908 $1,139,317 $1,050,000 75 45 106% 13 Toronto Central 59 $90,086,804 $1,526,895 $1,500,128 105 67 109% 17 Toronto East 68 $68,063,588 $1,000,935 $906,000 106 47 113% 7 York Region 346 $358,891,297 $1,037,258 $1,000,000 566 315 108% 10 Aurora 24 $23,304,050 $971,002 $950,000 27 8 109% 7 East Gwillimbury 10 $8,516,500 $851,650 $860,000 13 5 108% 9 Georgina 10 $6,981,000 $698,100 $675,000 17 8 105% 8 King 8 $9,213,100 $1,151,638 $1,185,000 6 2 104% 11 Markham 75 $85,055,292 $1,134,071 $1,120,000 123 72 111% 13 Newmarket 28 $24,763,400 $884,407 $859,500 54 33 106% 9 Richmond Hill 81 $89,285,455 $1,102,290 $1,080,888 131 73 107% 11 Vaughan 88 $91,560,701 $1,040,463 $1,005,000 164 100 107% 8 Whitchurch-Stouffville 22 $20,211,799 $918,718 $934,000 31 14 107% 10 Durham Region 212 $161,858,913 $763,485 $757,500 309 126 111% 8 Ajax 49 $39,992,127 $816,166 $802,500 84 33 110% 8 Brock 0 $0 $0 - 0 0 - - Clarington 45 $33,332,077 $740,713 $727,000 54 20 115% 8 Oshawa 34 $23,418,000 $688,765 $692,450 53 26 109% 10 Pickering 21 $16,673,900 $793,995 $800,000 29 13 106% 7 Scugog 0 $0 $0 - 1 6 - - Uxbridge 6 $4,531,500 $755,250 $731,750 8 2 116% 6 Whitby 57 $43,911,309 $770,374 $780,000 80 26 111% 7 Dufferin County 12 $8,955,747 $746,312 $743,874 12 3 109% 6 Orangeville 12 $8,955,747 $746,312 $743,874 12 3 109% 6 Simcoe County 71 $51,498,075 $725,325 $710,000 67 25 104% 11 Adjala-Tosorontio 0 $0 $0 - 0 0 - - Bradford West Gwillimbury 11 $9,102,490 $827,499 $835,000 15 9 103% 12 Essa 15 $8,941,886 $596,126 $609,000 13 3 108% 5 Innisfil 25 $19,433,100 $777,324 $722,100 19 6 104% 14 New Tecumseth 20 $14,020,599 $701,030 $715,000 20 7 103% 11 Municipality Number of Sales Dollar Volume Average Price Median Price New Listings Active Listings Avg. SP/LP Avg. LDOM ATT/ROW/TWNHOUSE, APRIL 2021 Toronto Regional Real Estate Board SUMMARY OF EXISTING HOME TRANSACTIONS ALL TRREB AREAS 1 1 2 4 5 1 1 3 11 Market Watch, April 2021 Copyright® 2021 Toronto Regional Real Estate Board
- 12. TRREB Total 1,310 $1,239,799,878 $946,412 $885,000 1,987 951 108% 9 City of Toronto 174 $211,698,300 $1,216,657 $1,096,000 286 159 109% 12 Toronto West 47 $53,547,908 $1,139,317 $1,050,000 75 45 106% 13 Toronto W01 2 $3,229,000 $1,614,500 $1,614,500 4 4 98% 16 Toronto W02 6 $7,585,750 $1,264,292 $1,191,625 11 8 102% 15 Toronto W03 5 $4,887,500 $977,500 $967,500 8 2 122% 6 Toronto W04 1 $900,000 $900,000 $900,000 3 3 113% 2 Toronto W05 11 $11,726,000 $1,066,000 $885,000 19 19 96% 29 Toronto W06 10 $10,689,520 $1,068,952 $1,082,000 16 6 107% 4 Toronto W07 4 $4,901,000 $1,225,250 $1,230,000 5 1 112% 3 Toronto W08 5 $6,556,138 $1,311,228 $1,360,138 7 2 125% 5 Toronto W09 2 $2,198,000 $1,099,000 $1,099,000 1 0 98% 19 Toronto W10 1 $875,000 $875,000 $875,000 1 0 100% 3 Toronto Central 59 $90,086,804 $1,526,895 $1,500,128 105 67 109% 17 Toronto C01 24 $36,518,016 $1,521,584 $1,500,064 36 20 112% 13 Toronto C02 5 $11,138,000 $2,227,600 $2,110,000 13 12 107% 8 Toronto C03 2 $2,810,000 $1,405,000 $1,405,000 2 1 109% 6 Toronto C04 3 $2,984,999 $995,000 $699,999 5 3 95% 100 Toronto C06 0 $0 $0 - 0 0 - - Toronto C07 2 $2,441,000 $1,220,500 $1,220,500 7 5 113% 4 Toronto C08 11 $17,086,999 $1,553,364 $1,410,000 25 13 115% 9 Toronto C09 1 $1,580,000 $1,580,000 $1,580,000 0 0 94% 62 Toronto C10 1 $1,750,000 $1,750,000 $1,750,000 1 0 110% 6 Toronto C11 0 $0 $0 - 0 0 - - Toronto C12 0 $0 $0 - 2 3 - - Toronto C13 3 $3,014,990 $1,004,997 $1,000,000 7 5 100% 8 Toronto C14 6 $9,548,000 $1,591,333 $1,579,500 7 5 99% 16 Toronto C15 1 $1,214,800 $1,214,800 $1,214,800 0 0 99% 28 Toronto East 68 $68,063,588 $1,000,935 $906,000 106 47 113% 7 Toronto E01 12 $16,405,888 $1,367,157 $1,330,000 23 10 122% 3 Toronto E02 5 $6,748,000 $1,349,600 $1,328,000 5 1 119% 5 Toronto E03 3 $3,085,000 $1,028,333 $1,055,000 7 4 133% 3 Toronto E04 15 $13,750,000 $916,667 $925,000 29 12 105% 8 Toronto E05 3 $2,710,800 $903,600 $905,000 6 4 111% 12 Toronto E06 0 $0 $0 - 0 0 - - Toronto E07 7 $6,170,800 $881,543 $880,000 11 6 115% 7 Toronto E08 6 $4,763,000 $793,833 $755,000 4 1 100% 10 Toronto E09 0 $0 $0 - 1 0 - - Toronto E10 6 $5,342,000 $890,333 $870,500 6 2 111% 7 Toronto E11 11 $9,088,100 $826,191 $810,000 14 7 108% 9 Municipality Number of Sales Dollar Volume Average Price Median Price New Listings Active Listings Avg. SP/LP Avg. LDOM ATT/ROW/TWNHOUSE, APRIL 2021 Toronto Regional Real Estate Board SUMMARY OF EXISTING HOME TRANSACTIONS CITY OF TORONTO MUNICIPAL BREAKDOWN 1 1 2 4 5 1 1 3 12 Market Watch, April 2021 Copyright® 2021 Toronto Regional Real Estate Board
- 13. TRREB Total 1,123 $846,677,587 $753,943 $720,000 1,706 921 107% 10 Halton Region 136 $98,175,329 $721,877 $700,000 193 88 106% 9 Burlington 60 $44,344,828 $739,080 $723,000 81 37 106% 9 Halton Hills 8 $4,555,000 $569,375 $555,000 11 6 107% 7 Milton 21 $14,368,000 $684,190 $685,000 34 13 107% 8 Oakville 47 $34,907,501 $742,713 $695,000 67 32 105% 9 Peel Region 304 $221,096,051 $727,290 $725,200 502 263 106% 10 Brampton 85 $56,841,433 $668,723 $662,500 174 109 104% 12 Caledon 1 $765,000 $765,000 $765,000 4 3 109% 11 Mississauga 218 $163,489,618 $749,952 $752,000 324 151 106% 9 City of Toronto 404 $332,991,875 $824,237 $760,500 627 370 107% 10 Toronto West 137 $104,010,532 $759,201 $749,900 220 116 107% 9 Toronto Central 137 $134,361,755 $980,743 $835,000 221 162 105% 11 Toronto East 130 $94,619,588 $727,843 $690,000 186 92 111% 9 York Region 116 $94,725,472 $816,599 $785,000 182 122 105% 14 Aurora 14 $11,677,161 $834,083 $760,000 16 10 102% 10 East Gwillimbury 0 $0 $0 - 0 0 - - Georgina 3 $1,789,800 $596,600 $639,900 3 3 101% 77 King 0 $0 $0 - 1 1 - - Markham 48 $40,177,823 $837,038 $820,000 84 44 107% 11 Newmarket 13 $9,832,888 $756,376 $740,000 17 6 108% 8 Richmond Hill 14 $11,205,000 $800,357 $776,000 25 29 104% 13 Vaughan 17 $14,996,800 $882,165 $845,000 30 26 105% 16 Whitchurch-Stouffville 7 $5,046,000 $720,857 $723,000 6 3 104% 28 Durham Region 150 $92,274,860 $615,166 $620,000 192 75 110% 10 Ajax 20 $13,492,000 $674,600 $678,000 29 9 108% 11 Brock 0 $0 $0 - 1 1 - - Clarington 12 $7,062,000 $588,500 $592,750 10 2 120% 8 Oshawa 53 $29,602,855 $558,544 $555,000 65 35 114% 11 Pickering 40 $25,889,328 $647,233 $645,000 58 21 107% 10 Scugog 0 $0 $0 - 0 0 - - Uxbridge 3 $1,935,900 $645,300 $499,900 4 1 106% 9 Whitby 22 $14,292,777 $649,672 $640,000 25 6 108% 9 Dufferin County 7 $3,900,000 $557,143 $535,000 5 2 103% 11 Orangeville 7 $3,900,000 $557,143 $535,000 5 2 103% 11 Simcoe County 6 $3,514,000 $585,667 $551,500 5 1 104% 9 Adjala-Tosorontio 0 $0 $0 - 0 0 - - Bradford West Gwillimbury 1 $670,000 $670,000 $670,000 0 0 99% 17 Essa 0 $0 $0 - 0 0 - - Innisfil 0 $0 $0 - 0 0 - - New Tecumseth 5 $2,844,000 $568,800 $548,000 5 1 106% 7 Municipality Number of Sales Dollar Volume Average Price Median Price New Listings Active Listings Avg. SP/LP Avg. LDOM CONDO TOWNHOUSE, APRIL 2021 Toronto Regional Real Estate Board SUMMARY OF EXISTING HOME TRANSACTIONS ALL TRREB AREAS 1 1 2 4 5 1 1 3 13 Market Watch, April 2021 Copyright® 2021 Toronto Regional Real Estate Board
- 14. TRREB Total 1,123 $846,677,587 $753,943 $720,000 1,706 921 107% 10 City of Toronto 404 $332,991,875 $824,237 $760,500 627 370 107% 10 Toronto West 137 $104,010,532 $759,201 $749,900 220 116 107% 9 Toronto W01 13 $11,487,360 $883,643 $860,000 15 2 109% 7 Toronto W02 14 $13,105,700 $936,121 $922,800 22 9 110% 7 Toronto W03 4 $3,044,777 $761,194 $811,500 8 5 106% 6 Toronto W04 10 $7,037,000 $703,700 $697,500 13 10 105% 13 Toronto W05 38 $23,713,633 $624,043 $615,000 61 33 106% 8 Toronto W06 23 $20,963,036 $911,436 $905,000 41 19 109% 6 Toronto W07 0 $0 $0 - 1 1 - - Toronto W08 18 $13,997,526 $777,640 $777,500 32 22 104% 12 Toronto W09 3 $2,100,500 $700,167 $685,000 8 6 109% 11 Toronto W10 14 $8,561,000 $611,500 $629,000 19 9 103% 12 Toronto Central 137 $134,361,755 $980,743 $835,000 221 162 105% 11 Toronto C01 36 $41,316,445 $1,147,679 $993,167 61 34 105% 8 Toronto C02 2 $2,564,420 $1,282,210 $1,282,210 7 12 98% 7 Toronto C03 2 $3,437,500 $1,718,750 $1,718,750 1 3 100% 35 Toronto C04 0 $0 $0 - 5 4 - - Toronto C06 2 $1,755,000 $877,500 $877,500 9 5 101% 8 Toronto C07 19 $15,098,736 $794,670 $775,000 34 21 110% 9 Toronto C08 8 $7,341,000 $917,625 $745,000 17 12 101% 12 Toronto C09 2 $6,275,088 $3,137,544 $3,137,544 3 5 105% 8 Toronto C10 5 $5,092,000 $1,018,400 $868,000 6 5 105% 25 Toronto C11 6 $4,903,000 $817,167 $781,250 14 11 102% 14 Toronto C12 6 $6,870,000 $1,145,000 $1,205,000 7 7 101% 21 Toronto C13 4 $3,520,000 $880,000 $872,500 4 2 111% 9 Toronto C14 16 $12,755,811 $797,238 $752,900 21 14 103% 8 Toronto C15 29 $23,432,755 $808,026 $815,000 32 27 106% 13 Toronto East 130 $94,619,588 $727,843 $690,000 186 92 111% 9 Toronto E01 12 $13,691,300 $1,140,942 $1,175,000 17 6 114% 6 Toronto E02 6 $5,810,500 $968,417 $891,500 8 3 118% 7 Toronto E03 0 $0 $0 - 1 1 - - Toronto E04 18 $12,323,000 $684,611 $675,000 29 10 106% 9 Toronto E05 20 $14,667,000 $733,350 $735,000 34 21 110% 9 Toronto E06 0 $0 $0 - 2 4 - - Toronto E07 12 $9,229,688 $769,141 $764,400 16 6 112% 10 Toronto E08 11 $6,553,600 $595,782 $599,000 11 7 112% 8 Toronto E09 7 $4,455,000 $636,429 $685,000 13 8 104% 12 Toronto E10 13 $8,271,500 $636,269 $655,000 13 9 112% 8 Toronto E11 31 $19,618,000 $632,839 $615,000 42 17 110% 10 Municipality Number of Sales Dollar Volume Average Price Median Price New Listings Active Listings Avg. SP/LP Avg. LDOM CONDO TOWNHOUSE, APRIL 2021 Toronto Regional Real Estate Board SUMMARY OF EXISTING HOME TRANSACTIONS CITY OF TORONTO MUNICIPAL BREAKDOWN 1 1 2 4 5 1 1 3 14 Market Watch, April 2021 Copyright® 2021 Toronto Regional Real Estate Board
- 15. TRREB Total 3,290 $2,275,992,460 $691,791 $620,000 4,981 3,266 104% 12 Halton Region 174 $118,066,869 $678,545 $584,000 227 145 101% 14 Burlington 75 $43,751,699 $583,356 $546,000 94 60 103% 16 Halton Hills 1 $590,000 $590,000 $590,000 6 6 98% 21 Milton 31 $18,545,845 $598,253 $603,500 37 15 104% 13 Oakville 67 $55,179,325 $823,572 $610,000 90 64 100% 13 Peel Region 421 $237,933,992 $565,164 $545,000 599 368 102% 12 Brampton 66 $33,331,486 $505,023 $497,750 101 59 102% 13 Caledon 1 $758,000 $758,000 $758,000 2 2 100% 15 Mississauga 354 $203,844,506 $575,832 $550,000 496 307 102% 11 City of Toronto 2,277 $1,655,691,451 $727,137 $645,000 3,518 2,351 104% 12 Toronto West 453 $293,735,039 $648,422 $600,000 662 431 104% 11 Toronto Central 1,508 $1,178,458,382 $781,471 $680,000 2,415 1,683 104% 13 Toronto East 316 $183,498,030 $580,690 $550,000 441 237 107% 11 York Region 330 $220,397,269 $667,871 $628,000 518 336 104% 11 Aurora 10 $6,334,000 $633,400 $589,000 16 12 101% 11 East Gwillimbury 0 $0 $0 - 0 0 - - Georgina 1 $574,900 $574,900 $574,900 3 6 100% 94 King 4 $2,700,000 $675,000 $695,000 6 4 98% 14 Markham 111 $77,126,512 $694,833 $650,000 177 100 107% 9 Newmarket 8 $4,617,900 $577,238 $532,500 8 5 100% 17 Richmond Hill 76 $47,791,017 $628,829 $590,900 134 69 107% 7 Vaughan 117 $79,080,940 $675,905 $640,000 166 133 101% 13 Whitchurch-Stouffville 3 $2,172,000 $724,000 $715,000 8 7 99% 27 Durham Region 67 $32,931,068 $491,508 $505,000 96 52 107% 11 Ajax 7 $3,862,000 $551,714 $528,000 12 5 110% 7 Brock 0 $0 $0 - 0 0 - - Clarington 19 $10,127,980 $533,052 $513,000 23 9 109% 12 Oshawa 20 $7,182,888 $359,144 $389,944 28 22 107% 13 Pickering 8 $4,581,400 $572,675 $526,500 18 13 104% 14 Scugog 0 $0 $0 - 0 0 - - Uxbridge 2 $1,061,000 $530,500 $530,500 1 0 108% 5 Whitby 11 $6,115,800 $555,982 $549,900 14 3 106% 6 Dufferin County 5 $2,017,500 $403,500 $360,000 6 2 100% 24 Orangeville 5 $2,017,500 $403,500 $360,000 6 2 100% 24 Simcoe County 16 $8,954,311 $559,644 $510,000 17 12 101% 19 Adjala-Tosorontio 0 $0 $0 - 0 0 - - Bradford West Gwillimbury 1 $490,000 $490,000 $490,000 2 1 115% 4 Essa 0 $0 $0 - 0 0 - - Innisfil 11 $6,308,200 $573,473 $520,000 10 9 101% 24 New Tecumseth 4 $2,156,111 $539,028 $550,556 5 2 100% 12 Municipality Number of Sales Dollar Volume Average Price Median Price New Listings Active Listings Avg. SP/LP Avg. LDOM CONDO APT, APRIL 2021 Toronto Regional Real Estate Board SUMMARY OF EXISTING HOME TRANSACTIONS ALL TRREB AREAS 1 1 2 4 5 1 1 3 15 Market Watch, April 2021 Copyright® 2021 Toronto Regional Real Estate Board
- 16. TRREB Total 3,290 $2,275,992,460 $691,791 $620,000 4,981 3,266 104% 12 City of Toronto 2,277 $1,655,691,451 $727,137 $645,000 3,518 2,351 104% 12 Toronto West 453 $293,735,039 $648,422 $600,000 662 431 104% 11 Toronto W01 35 $27,656,018 $790,172 $750,000 57 28 107% 6 Toronto W02 31 $22,324,500 $720,145 $671,000 40 19 110% 9 Toronto W03 12 $7,124,104 $593,675 $580,000 17 9 105% 8 Toronto W04 45 $23,408,288 $520,184 $505,000 46 29 102% 18 Toronto W05 24 $11,957,500 $498,229 $519,000 49 51 101% 21 Toronto W06 122 $92,617,278 $759,158 $670,000 212 144 104% 12 Toronto W07 4 $3,308,000 $827,000 $847,500 7 9 100% 7 Toronto W08 113 $72,281,051 $639,655 $600,000 138 81 104% 10 Toronto W09 26 $12,305,300 $473,281 $450,500 37 22 103% 10 Toronto W10 41 $20,753,000 $506,171 $525,000 59 39 102% 11 Toronto Central 1,508 $1,178,458,382 $781,471 $680,000 2,415 1,683 104% 13 Toronto C01 604 $484,576,829 $802,280 $705,450 988 683 104% 13 Toronto C02 64 $74,217,300 $1,159,645 $890,000 111 136 99% 21 Toronto C03 17 $16,507,500 $971,029 $872,000 28 18 103% 17 Toronto C04 21 $17,592,320 $837,730 $672,500 28 22 101% 18 Toronto C06 26 $16,288,388 $626,476 $627,500 40 16 107% 7 Toronto C07 59 $41,613,078 $705,306 $660,000 99 68 105% 10 Toronto C08 296 $220,194,672 $743,901 $680,400 500 350 104% 14 Toronto C09 20 $31,281,134 $1,564,057 $779,617 31 26 96% 19 Toronto C10 78 $59,055,896 $757,127 $677,500 118 82 103% 11 Toronto C11 32 $19,390,807 $605,963 $576,500 57 34 102% 12 Toronto C12 7 $9,716,500 $1,388,071 $935,000 14 15 101% 10 Toronto C13 38 $24,987,477 $657,565 $600,000 69 57 102% 11 Toronto C14 114 $79,374,615 $696,269 $650,000 172 88 106% 9 Toronto C15 132 $83,661,866 $633,802 $597,450 160 88 104% 11 Toronto East 316 $183,498,030 $580,690 $550,000 441 237 107% 11 Toronto E01 35 $27,392,738 $782,650 $735,000 47 20 111% 7 Toronto E02 12 $10,871,118 $905,927 $968,000 40 19 111% 7 Toronto E03 15 $7,527,730 $501,849 $470,000 17 10 98% 11 Toronto E04 40 $20,610,211 $515,255 $525,000 55 23 106% 11 Toronto E05 35 $19,175,452 $547,870 $542,000 50 36 106% 9 Toronto E06 7 $4,975,600 $710,800 $640,500 12 14 102% 14 Toronto E07 51 $28,790,065 $564,511 $560,000 72 36 110% 9 Toronto E08 28 $14,552,056 $519,716 $505,000 36 21 103% 17 Toronto E09 59 $32,783,060 $555,645 $542,680 74 31 105% 10 Toronto E10 9 $4,266,900 $474,100 $480,000 15 14 107% 16 Toronto E11 25 $12,553,100 $502,124 $515,000 23 13 106% 15 Municipality Number of Sales Dollar Volume Average Price Median Price New Listings Active Listings Avg. SP/LP Avg. LDOM CONDO APT, APRIL 2021 Toronto Regional Real Estate Board SUMMARY OF EXISTING HOME TRANSACTIONS CITY OF TORONTO MUNICIPAL BREAKDOWN 1 1 2 4 5 1 1 3 16 Market Watch, April 2021 Copyright® 2021 Toronto Regional Real Estate Board
- 17. TRREB Total 93 $90,073,359 $968,531 $968,800 141 56 108% 9 Halton Region 12 $12,443,100 $1,036,925 $1,053,000 11 3 110% 10 Burlington 5 $4,631,100 $926,220 $905,100 5 1 104% 13 Halton Hills 0 $0 $0 - 0 0 - - Milton 3 $3,399,000 $1,133,000 $1,132,000 0 0 110% 10 Oakville 4 $4,413,000 $1,103,250 $1,100,000 6 2 116% 7 Peel Region 9 $8,676,000 $964,000 $950,000 19 9 105% 9 Brampton 6 $5,431,000 $905,167 $923,000 13 6 103% 11 Caledon 0 $0 $0 - 0 0 - - Mississauga 3 $3,245,000 $1,081,667 $1,075,000 6 3 108% 7 City of Toronto 13 $12,108,301 $931,408 $922,000 16 9 108% 8 Toronto West 0 $0 $0 - 0 0 - - Toronto Central 5 $5,175,000 $1,035,000 $998,000 4 1 107% 8 Toronto East 8 $6,933,301 $866,663 $835,000 12 8 108% 9 York Region 33 $36,790,000 $1,114,848 $1,100,000 50 17 109% 8 Aurora 2 $2,068,000 $1,034,000 $1,034,000 0 1 105% 9 East Gwillimbury 0 $0 $0 - 0 0 - - Georgina 0 $0 $0 - 0 0 - - King 2 $2,295,000 $1,147,500 $1,147,500 3 1 104% 2 Markham 24 $26,980,000 $1,124,167 $1,102,000 29 8 110% 9 Newmarket 0 $0 $0 - 0 0 - - Richmond Hill 2 $2,220,000 $1,110,000 $1,110,000 11 4 104% 5 Vaughan 1 $1,047,000 $1,047,000 $1,047,000 3 2 99% 12 Whitchurch-Stouffville 2 $2,180,000 $1,090,000 $1,090,000 4 1 116% 8 Durham Region 18 $13,775,958 $765,331 $748,750 32 12 111% 10 Ajax 1 $840,000 $840,000 $840,000 1 1 105% 21 Brock 0 $0 $0 - 0 0 - - Clarington 9 $6,556,533 $728,504 $717,000 16 6 114% 7 Oshawa 2 $1,432,500 $716,250 $716,250 6 3 117% 16 Pickering 1 $740,000 $740,000 $740,000 2 1 106% 1 Scugog 0 $0 $0 - 0 0 - - Uxbridge 1 $890,000 $890,000 $890,000 1 0 111% 7 Whitby 4 $3,316,925 $829,231 $845,013 6 1 106% 12 Dufferin County 0 $0 $0 - 0 0 - - Orangeville 0 $0 $0 - 0 0 - - Simcoe County 8 $6,280,000 $785,000 $801,500 13 6 102% 11 Adjala-Tosorontio 0 $0 $0 - 0 0 - - Bradford West Gwillimbury 1 $770,000 $770,000 $770,000 3 1 98% 33 Essa 4 $2,945,500 $736,375 $707,750 5 3 103% 7 Innisfil 0 $0 $0 - 2 1 - - New Tecumseth 3 $2,564,500 $854,833 $861,500 3 1 102% 10 Municipality Number of Sales Dollar Volume Average Price Median Price New Listings Active Listings Avg. SP/LP Avg. LDOM LINK, APRIL 2021 Toronto Regional Real Estate Board SUMMARY OF EXISTING HOME TRANSACTIONS ALL TRREB AREAS 1 1 2 4 5 1 1 3 17 Market Watch, April 2021 Copyright® 2021 Toronto Regional Real Estate Board
- 18. TRREB Total 93 $90,073,359 $968,531 $968,800 141 56 108% 9 City of Toronto 13 $12,108,301 $931,408 $922,000 16 9 108% 8 Toronto West 0 $0 $0 - 0 0 - - Toronto W01 0 $0 $0 - 0 0 - - Toronto W02 0 $0 $0 - 0 0 - - Toronto W03 0 $0 $0 - 0 0 - - Toronto W04 0 $0 $0 - 0 0 - - Toronto W05 0 $0 $0 - 0 0 - - Toronto W06 0 $0 $0 - 0 0 - - Toronto W07 0 $0 $0 - 0 0 - - Toronto W08 0 $0 $0 - 0 0 - - Toronto W09 0 $0 $0 - 0 0 - - Toronto W10 0 $0 $0 - 0 0 - - Toronto Central 5 $5,175,000 $1,035,000 $998,000 4 1 107% 8 Toronto C01 0 $0 $0 - 0 0 - - Toronto C02 0 $0 $0 - 0 0 - - Toronto C03 0 $0 $0 - 0 0 - - Toronto C04 0 $0 $0 - 0 0 - - Toronto C06 0 $0 $0 - 0 0 - - Toronto C07 1 $998,000 $998,000 $998,000 1 0 100% 6 Toronto C08 0 $0 $0 - 0 0 - - Toronto C09 0 $0 $0 - 0 0 - - Toronto C10 0 $0 $0 - 0 0 - - Toronto C11 0 $0 $0 - 0 0 - - Toronto C12 0 $0 $0 - 0 0 - - Toronto C13 0 $0 $0 - 0 0 - - Toronto C14 0 $0 $0 - 0 0 - - Toronto C15 4 $4,177,000 $1,044,250 $1,017,500 3 1 109% 8 Toronto East 8 $6,933,301 $866,663 $835,000 12 8 108% 9 Toronto E01 0 $0 $0 - 0 0 - - Toronto E02 0 $0 $0 - 0 0 - - Toronto E03 0 $0 $0 - 0 0 - - Toronto E04 0 $0 $0 - 0 0 - - Toronto E05 0 $0 $0 - 1 1 - - Toronto E06 0 $0 $0 - 0 0 - - Toronto E07 6 $5,303,300 $883,883 $844,500 8 5 108% 8 Toronto E08 0 $0 $0 - 0 1 - - Toronto E09 0 $0 $0 - 0 0 - - Toronto E10 0 $0 $0 - 0 0 - - Toronto E11 2 $1,630,001 $815,001 $815,001 3 1 109% 10 Municipality Number of Sales Dollar Volume Average Price Median Price New Listings Active Listings Avg. SP/LP Avg. LDOM LINK, APRIL 2021 Toronto Regional Real Estate Board SUMMARY OF EXISTING HOME TRANSACTIONS CITY OF TORONTO MUNICIPAL BREAKDOWN 1 1 2 4 5 1 1 3 18 Market Watch, April 2021 Copyright® 2021 Toronto Regional Real Estate Board
- 19. TRREB Total 12 $6,822,487 $568,541 $458,494 31 29 100% 18 Halton Region 2 $716,000 $358,000 $358,000 3 1 105% 7 Burlington 2 $716,000 $358,000 $358,000 3 1 105% 7 Halton Hills 0 $0 $0 - 0 0 - - Milton 0 $0 $0 - 0 0 - - Oakville 0 $0 $0 - 0 0 - - Peel Region 0 $0 $0 - 0 0 - - Brampton 0 $0 $0 - 0 0 - - Caledon 0 $0 $0 - 0 0 - - Mississauga 0 $0 $0 - 0 0 - - City of Toronto 10 $6,106,487 $610,649 $543,994 12 12 99% 20 Toronto West 5 $1,924,987 $384,997 $387,000 1 1 99% 31 Toronto Central 5 $4,181,500 $836,300 $655,000 10 11 100% 8 Toronto East 0 $0 $0 - 1 0 - - York Region 0 $0 $0 - 16 16 - - Aurora 0 $0 $0 - 0 0 - - East Gwillimbury 0 $0 $0 - 0 0 - - Georgina 0 $0 $0 - 0 0 - - King 0 $0 $0 - 0 0 - - Markham 0 $0 $0 - 0 0 - - Newmarket 0 $0 $0 - 0 0 - - Richmond Hill 0 $0 $0 - 0 0 - - Vaughan 0 $0 $0 - 16 16 - - Whitchurch-Stouffville 0 $0 $0 - 0 0 - - Durham Region 0 $0 $0 - 0 0 - - Ajax 0 $0 $0 - 0 0 - - Brock 0 $0 $0 - 0 0 - - Clarington 0 $0 $0 - 0 0 - - Oshawa 0 $0 $0 - 0 0 - - Pickering 0 $0 $0 - 0 0 - - Scugog 0 $0 $0 - 0 0 - - Uxbridge 0 $0 $0 - 0 0 - - Whitby 0 $0 $0 - 0 0 - - Dufferin County 0 $0 $0 - 0 0 - - Orangeville 0 $0 $0 - 0 0 - - Simcoe County 0 $0 $0 - 0 0 - - Adjala-Tosorontio 0 $0 $0 - 0 0 - - Bradford West Gwillimbury 0 $0 $0 - 0 0 - - Essa 0 $0 $0 - 0 0 - - Innisfil 0 $0 $0 - 0 0 - - New Tecumseth 0 $0 $0 - 0 0 - - Municipality Number of Sales Dollar Volume Average Price Median Price New Listings Active Listings Avg. SP/LP Avg. LDOM CO-OP APT, APRIL 2021 Toronto Regional Real Estate Board SUMMARY OF EXISTING HOME TRANSACTIONS ALL TRREB AREAS 1 1 2 4 5 1 1 3 19 Market Watch, April 2021 Copyright® 2021 Toronto Regional Real Estate Board
- 20. TRREB Total 12 $6,822,487 $568,541 $458,494 31 29 100% 18 City of Toronto 10 $6,106,487 $610,649 $543,994 12 12 99% 20 Toronto West 5 $1,924,987 $384,997 $387,000 1 1 99% 31 Toronto W01 0 $0 $0 - 0 0 - - Toronto W02 0 $0 $0 - 0 0 - - Toronto W03 0 $0 $0 - 0 0 - - Toronto W04 0 $0 $0 - 0 0 - - Toronto W05 0 $0 $0 - 0 0 - - Toronto W06 3 $1,120,988 $373,663 $360,000 0 0 99% 36 Toronto W07 0 $0 $0 - 0 0 - - Toronto W08 2 $803,999 $402,000 $402,000 0 0 99% 23 Toronto W09 0 $0 $0 - 0 0 - - Toronto W10 0 $0 $0 - 1 1 - - Toronto Central 5 $4,181,500 $836,300 $655,000 10 11 100% 8 Toronto C01 1 $872,500 $872,500 $872,500 2 1 109% 4 Toronto C02 1 $655,000 $655,000 $655,000 1 2 99% 2 Toronto C03 0 $0 $0 - 0 0 - - Toronto C04 0 $0 $0 - 2 2 - - Toronto C06 0 $0 $0 - 0 0 - - Toronto C07 0 $0 $0 - 0 0 - - Toronto C08 0 $0 $0 - 0 0 - - Toronto C09 3 $2,654,000 $884,667 $616,000 5 6 97% 12 Toronto C10 0 $0 $0 - 0 0 - - Toronto C11 0 $0 $0 - 0 0 - - Toronto C12 0 $0 $0 - 0 0 - - Toronto C13 0 $0 $0 - 0 0 - - Toronto C14 0 $0 $0 - 0 0 - - Toronto C15 0 $0 $0 - 0 0 - - Toronto East 0 $0 $0 - 1 0 - - Toronto E01 0 $0 $0 - 0 0 - - Toronto E02 0 $0 $0 - 0 0 - - Toronto E03 0 $0 $0 - 0 0 - - Toronto E04 0 $0 $0 - 0 0 - - Toronto E05 0 $0 $0 - 0 0 - - Toronto E06 0 $0 $0 - 0 0 - - Toronto E07 0 $0 $0 - 0 0 - - Toronto E08 0 $0 $0 - 0 0 - - Toronto E09 0 $0 $0 - 1 0 - - Toronto E10 0 $0 $0 - 0 0 - - Toronto E11 0 $0 $0 - 0 0 - - Municipality Number of Sales Dollar Volume Average Price Median Price New Listings Active Listings Avg. SP/LP Avg. LDOM CO-OP APT, APRIL 2021 Toronto Regional Real Estate Board SUMMARY OF EXISTING HOME TRANSACTIONS CITY OF TORONTO MUNICIPAL BREAKDOWN 1 1 2 4 5 1 1 3 20 Market Watch, April 2021 Copyright® 2021 Toronto Regional Real Estate Board
- 21. TRREB Total 8 $7,079,500 $884,938 $927,500 13 8 103% 9 Halton Region 0 $0 $0 - 0 0 - - Burlington 0 $0 $0 - 0 0 - - Halton Hills 0 $0 $0 - 0 0 - - Milton 0 $0 $0 - 0 0 - - Oakville 0 $0 $0 - 0 0 - - Peel Region 3 $2,655,500 $885,167 $925,000 5 4 104% 11 Brampton 2 $1,890,000 $945,000 $945,000 4 4 105% 13 Caledon 0 $0 $0 - 0 0 - - Mississauga 1 $765,500 $765,500 $765,500 1 0 102% 6 City of Toronto 0 $0 $0 - 0 0 - - Toronto West 0 $0 $0 - 0 0 - - Toronto Central 0 $0 $0 - 0 0 - - Toronto East 0 $0 $0 - 0 0 - - York Region 1 $1,190,000 $1,190,000 $1,190,000 1 1 101% 7 Aurora 0 $0 $0 - 0 0 - - East Gwillimbury 0 $0 $0 - 0 0 - - Georgina 0 $0 $0 - 0 0 - - King 0 $0 $0 - 0 0 - - Markham 1 $1,190,000 $1,190,000 $1,190,000 1 1 101% 7 Newmarket 0 $0 $0 - 0 0 - - Richmond Hill 0 $0 $0 - 0 0 - - Vaughan 0 $0 $0 - 0 0 - - Whitchurch-Stouffville 0 $0 $0 - 0 0 - - Durham Region 0 $0 $0 - 1 1 - - Ajax 0 $0 $0 - 1 1 - - Brock 0 $0 $0 - 0 0 - - Clarington 0 $0 $0 - 0 0 - - Oshawa 0 $0 $0 - 0 0 - - Pickering 0 $0 $0 - 0 0 - - Scugog 0 $0 $0 - 0 0 - - Uxbridge 0 $0 $0 - 0 0 - - Whitby 0 $0 $0 - 0 0 - - Dufferin County 0 $0 $0 - 0 0 - - Orangeville 0 $0 $0 - 0 0 - - Simcoe County 4 $3,234,000 $808,500 $791,500 6 2 104% 8 Adjala-Tosorontio 0 $0 $0 - 0 0 - - Bradford West Gwillimbury 0 $0 $0 - 0 0 - - Essa 0 $0 $0 - 0 0 - - Innisfil 0 $0 $0 - 0 0 - - New Tecumseth 4 $3,234,000 $808,500 $791,500 6 2 104% 8 Municipality Number of Sales Dollar Volume Average Price Median Price New Listings Active Listings Avg. SP/LP Avg. LDOM DET CONDO, APRIL 2021 Toronto Regional Real Estate Board SUMMARY OF EXISTING HOME TRANSACTIONS ALL TRREB AREAS 1 1 2 4 5 1 1 3 21 Market Watch, April 2021 Copyright® 2021 Toronto Regional Real Estate Board
- 22. TRREB Total 8 $7,079,500 $884,938 $927,500 13 8 103% 9 City of Toronto 0 $0 $0 - 0 0 - - Toronto West 0 $0 $0 - 0 0 - - Toronto W01 0 $0 $0 - 0 0 - - Toronto W02 0 $0 $0 - 0 0 - - Toronto W03 0 $0 $0 - 0 0 - - Toronto W04 0 $0 $0 - 0 0 - - Toronto W05 0 $0 $0 - 0 0 - - Toronto W06 0 $0 $0 - 0 0 - - Toronto W07 0 $0 $0 - 0 0 - - Toronto W08 0 $0 $0 - 0 0 - - Toronto W09 0 $0 $0 - 0 0 - - Toronto W10 0 $0 $0 - 0 0 - - Toronto Central 0 $0 $0 - 0 0 - - Toronto C01 0 $0 $0 - 0 0 - - Toronto C02 0 $0 $0 - 0 0 - - Toronto C03 0 $0 $0 - 0 0 - - Toronto C04 0 $0 $0 - 0 0 - - Toronto C06 0 $0 $0 - 0 0 - - Toronto C07 0 $0 $0 - 0 0 - - Toronto C08 0 $0 $0 - 0 0 - - Toronto C09 0 $0 $0 - 0 0 - - Toronto C10 0 $0 $0 - 0 0 - - Toronto C11 0 $0 $0 - 0 0 - - Toronto C12 0 $0 $0 - 0 0 - - Toronto C13 0 $0 $0 - 0 0 - - Toronto C14 0 $0 $0 - 0 0 - - Toronto C15 0 $0 $0 - 0 0 - - Toronto East 0 $0 $0 - 0 0 - - Toronto E01 0 $0 $0 - 0 0 - - Toronto E02 0 $0 $0 - 0 0 - - Toronto E03 0 $0 $0 - 0 0 - - Toronto E04 0 $0 $0 - 0 0 - - Toronto E05 0 $0 $0 - 0 0 - - Toronto E06 0 $0 $0 - 0 0 - - Toronto E07 0 $0 $0 - 0 0 - - Toronto E08 0 $0 $0 - 0 0 - - Toronto E09 0 $0 $0 - 0 0 - - Toronto E10 0 $0 $0 - 0 0 - - Toronto E11 0 $0 $0 - 0 0 - - Municipality Number of Sales Dollar Volume Average Price Median Price New Listings Active Listings Avg. SP/LP Avg. LDOM DET CONDO, APRIL 2021 Toronto Regional Real Estate Board SUMMARY OF EXISTING HOME TRANSACTIONS CITY OF TORONTO MUNICIPAL BREAKDOWN 1 1 2 4 5 1 1 3 22 Market Watch, April 2021 Copyright® 2021 Toronto Regional Real Estate Board
- 23. TRREB Total 7 $4,109,413 $587,059 $675,000 13 8 108% 12 Halton Region 0 $0 $0 - 0 0 - - Burlington 0 $0 $0 - 0 0 - - Halton Hills 0 $0 $0 - 0 0 - - Milton 0 $0 $0 - 0 0 - - Oakville 0 $0 $0 - 0 0 - - Peel Region 0 $0 $0 - 0 0 - - Brampton 0 $0 $0 - 0 0 - - Caledon 0 $0 $0 - 0 0 - - Mississauga 0 $0 $0 - 0 0 - - City of Toronto 7 $4,109,413 $587,059 $675,000 13 8 108% 12 Toronto West 2 $1,371,513 $685,757 $685,757 3 2 124% 9 Toronto Central 5 $2,737,900 $547,580 $493,000 9 6 102% 14 Toronto East 0 $0 $0 - 1 0 - - York Region 0 $0 $0 - 0 0 - - Aurora 0 $0 $0 - 0 0 - - East Gwillimbury 0 $0 $0 - 0 0 - - Georgina 0 $0 $0 - 0 0 - - King 0 $0 $0 - 0 0 - - Markham 0 $0 $0 - 0 0 - - Newmarket 0 $0 $0 - 0 0 - - Richmond Hill 0 $0 $0 - 0 0 - - Vaughan 0 $0 $0 - 0 0 - - Whitchurch-Stouffville 0 $0 $0 - 0 0 - - Durham Region 0 $0 $0 - 0 0 - - Ajax 0 $0 $0 - 0 0 - - Brock 0 $0 $0 - 0 0 - - Clarington 0 $0 $0 - 0 0 - - Oshawa 0 $0 $0 - 0 0 - - Pickering 0 $0 $0 - 0 0 - - Scugog 0 $0 $0 - 0 0 - - Uxbridge 0 $0 $0 - 0 0 - - Whitby 0 $0 $0 - 0 0 - - Dufferin County 0 $0 $0 - 0 0 - - Orangeville 0 $0 $0 - 0 0 - - Simcoe County 0 $0 $0 - 0 0 - - Adjala-Tosorontio 0 $0 $0 - 0 0 - - Bradford West Gwillimbury 0 $0 $0 - 0 0 - - Essa 0 $0 $0 - 0 0 - - Innisfil 0 $0 $0 - 0 0 - - New Tecumseth 0 $0 $0 - 0 0 - - Municipality Number of Sales Dollar Volume Average Price Median Price New Listings Active Listings Avg. SP/LP Avg. LDOM CO-OWNERSHIP APT, APRIL 2021 Toronto Regional Real Estate Board SUMMARY OF EXISTING HOME TRANSACTIONS ALL TRREB AREAS 1 1 2 4 5 1 1 3 23 Market Watch, April 2021 Copyright® 2021 Toronto Regional Real Estate Board
- 24. TRREB Total 7 $4,109,413 $587,059 $675,000 13 8 108% 12 City of Toronto 7 $4,109,413 $587,059 $675,000 13 8 108% 12 Toronto West 2 $1,371,513 $685,757 $685,757 3 2 124% 9 Toronto W01 2 $1,371,513 $685,757 $685,757 2 0 124% 9 Toronto W02 0 $0 $0 - 0 0 - - Toronto W03 0 $0 $0 - 0 0 - - Toronto W04 0 $0 $0 - 0 0 - - Toronto W05 0 $0 $0 - 0 1 - - Toronto W06 0 $0 $0 - 1 1 - - Toronto W07 0 $0 $0 - 0 0 - - Toronto W08 0 $0 $0 - 0 0 - - Toronto W09 0 $0 $0 - 0 0 - - Toronto W10 0 $0 $0 - 0 0 - - Toronto Central 5 $2,737,900 $547,580 $493,000 9 6 102% 14 Toronto C01 0 $0 $0 - 0 0 - - Toronto C02 0 $0 $0 - 1 1 - - Toronto C03 1 $675,000 $675,000 $675,000 0 0 98% 10 Toronto C04 2 $1,298,000 $649,000 $649,000 2 1 106% 22 Toronto C06 0 $0 $0 - 0 0 - - Toronto C07 0 $0 $0 - 0 0 - - Toronto C08 0 $0 $0 - 4 4 - - Toronto C09 0 $0 $0 - 0 0 - - Toronto C10 1 $425,000 $425,000 $425,000 1 0 97% 10 Toronto C11 0 $0 $0 - 0 0 - - Toronto C12 0 $0 $0 - 0 0 - - Toronto C13 0 $0 $0 - 0 0 - - Toronto C14 1 $339,900 $339,900 $339,900 1 0 100% 7 Toronto C15 0 $0 $0 - 0 0 - - Toronto East 0 $0 $0 - 1 0 - - Toronto E01 0 $0 $0 - 0 0 - - Toronto E02 0 $0 $0 - 1 0 - - Toronto E03 0 $0 $0 - 0 0 - - Toronto E04 0 $0 $0 - 0 0 - - Toronto E05 0 $0 $0 - 0 0 - - Toronto E06 0 $0 $0 - 0 0 - - Toronto E07 0 $0 $0 - 0 0 - - Toronto E08 0 $0 $0 - 0 0 - - Toronto E09 0 $0 $0 - 0 0 - - Toronto E10 0 $0 $0 - 0 0 - - Toronto E11 0 $0 $0 - 0 0 - - Municipality Number of Sales Dollar Volume Average Price Median Price New Listings Active Listings Avg. SP/LP Avg. LDOM CO-OWNERSHIP APT, APRIL 2021 Toronto Regional Real Estate Board SUMMARY OF EXISTING HOME TRANSACTIONS CITY OF TORONTO MUNICIPAL BREAKDOWN 1 1 2 4 5 1 1 3 24 Market Watch, April 2021 Copyright® 2021 Toronto Regional Real Estate Board
- 25. 337.7 $1,025,200 17.83% 340.9 $1,259,500 24.51% 352.0 $988,900 22.99% 345.7 $759,500 17.55% 313.1 $627,600 4.26% 364.5 $1,182,200 24.45% 372.2 $1,372,800 27.73% 385.2 $985,500 28.14% 388.2 $746,500 22.23% 306.8 $625,000 14.99% 376.4 $1,043,900 22.69% 389.0 $1,316,900 27.50% 410.5 $984,800 25.92% 400.4 $750,800 22.15% 314.0 $618,700 14.02% 351.2 $1,044,900 28.98% 351.1 $1,142,500 29.56% 371.9 $842,700 30.86% 347.9 $594,800 25.01% 286.9 $621,100 14.67% 347.6 $1,029,900 25.94% 348.7 $1,246,800 28.86% 369.0 $891,800 29.25% 363.2 $625,100 24.21% 320.2 $612,900 13.51% 364.9 $1,340,500 24.20% 376.9 $1,593,200 26.65% 393.8 $1,099,600 27.57% 382.0 $860,500 23.62% 289.3 $592,500 14.57% 337.0 $955,800 17.83% 333.7 $1,181,800 22.01% 346.4 $885,200 22.32% 335.7 $709,100 15.96% 328.0 $562,400 5.94% 344.2 $877,400 21.37% 335.6 $989,100 22.44% 351.7 $821,400 23.23% 344.1 $618,500 18.13% 319.8 $477,400 9.11% 312.8 $1,148,700 32.54% 316.2 $1,202,000 33.70% 348.2 $860,200 28.68% - - - 266.9 $648,900 6.25% 332.6 $982,400 13.71% 334.9 $1,337,600 19.56% 336.5 $928,000 19.79% 332.2 $734,200 15.03% 329.5 $578,800 5.44% 325.7 $1,056,100 9.11% 329.7 $1,446,700 18.47% 346.3 $1,154,300 17.15% 327.6 $780,600 11.28% 316.4 $651,700 2.49% 330.7 $1,118,000 20.91% 340.7 $1,297,400 24.43% 341.5 $986,900 22.67% 305.5 $792,900 19.52% 276.4 $616,600 7.67% 329.2 $1,086,400 22.15% 330.8 $1,242,900 23.90% 344.9 $889,400 23.58% 322.3 $882,000 24.30% 265.5 $608,800 8.50% 325.7 $1,112,800 38.77% 328.5 $1,170,800 38.20% 347.7 $727,300 38.64% - - - - - - 353.1 $672,100 40.68% 360.7 $679,400 40.40% 347.9 $685,800 37.95% - - - - - - 304.0 $1,271,900 32.75% 306.2 $1,273,800 34.12% 301.5 $706,100 27.81% - - - 273.7 $748,600 8.05% 335.6 $1,166,300 18.04% 360.4 $1,486,600 21.06% 349.0 $1,040,800 21.65% 296.8 $792,500 20.21% 277.9 $664,600 6.72% 311.3 $918,100 24.72% 314.8 $1,061,000 26.17% 317.0 $746,600 27.16% 300.3 $623,500 25.91% 290.7 $518,200 6.76% 341.1 $1,227,500 19.10% 367.8 $1,563,100 21.15% 350.4 $1,065,000 24.26% 285.7 $724,300 16.33% 281.8 $590,200 9.65% 319.3 $1,154,600 16.79% 313.3 $1,302,300 19.08% 333.8 $1,011,100 19.17% 330.8 $934,500 13.09% 270.5 $624,200 7.43% 351.1 $1,223,700 25.08% 355.0 $1,309,500 27.38% 355.7 $887,500 23.76% 294.8 $529,200 24.07% 262.3 $677,000 8.52% 351.9 $820,700 33.45% 341.7 $887,400 33.74% 366.3 $731,500 34.72% 398.4 $619,800 34.87% 327.9 $556,400 21.71% 346.2 $853,100 28.60% 342.9 $919,900 29.30% 358.8 $774,300 30.66% 361.4 $664,200 27.79% 313.0 $507,400 20.76% 316.5 $548,100 39.86% 318.6 $552,000 39.98% 378.7 $649,100 54.45% - - - - - - 353.1 $745,500 39.18% 340.3 $819,600 38.90% 352.9 $674,200 41.61% 409.1 $640,900 35.51% 304.4 $450,700 24.60% 371.9 $709,200 36.38% 352.8 $752,900 35.64% 402.0 $672,800 37.95% 441.6 $550,000 42.82% 326.9 $453,200 23.92% 345.1 $921,500 27.72% 331.1 $1,031,500 28.93% 355.2 $828,800 29.07% 373.7 $639,900 27.98% 372.5 $694,900 20.90% 303.3 $778,400 31.58% 313.7 $798,000 31.81% 298.0 $623,700 31.86% - - - - - - 311.0 $976,100 33.42% 315.5 $1,011,200 33.46% 322.7 $785,700 30.44% - - - - - - 347.2 $901,700 32.12% 344.8 $991,700 32.21% 358.3 $789,300 33.20% 357.9 $601,300 34.10% 294.6 $533,700 20.74% 375.7 $861,100 31.92% 391.3 $891,800 31.53% 374.3 $701,400 32.78% - - - - - - 375.7 $861,200 31.92% 391.3 $891,700 31.53% 374.3 $701,400 32.78% - - - - - - 357.9 $784,100 34.55% 323.1 $728,300 28.37% 369.7 $685,200 33.47% - - - - - - 328.8 $989,500 36.43% 329.1 $992,700 36.56% - - - - - - - - - 357.7 $871,600 28.72% 315.4 $862,700 13.66% 371.5 $772,000 27.10% - - - - - - 378.5 $733,600 37.74% 364.9 $736,200 35.40% 386.8 $600,700 41.22% - - - - - - 374.7 $722,600 37.50% 363.3 $699,600 35.06% 393.0 $600,900 41.83% - - - - - - - - - - - - - - - - - - - - - 321.1 $763,000 31.44% 317.6 $805,500 33.90% 356.0 $645,400 36.87% - - - - - - Composite Single Family Detached Single Family Attached Townhouse Apartment Index Benchmark Yr./Yr. % Chg. Index Benchmark Yr./Yr. % Chg. Index Benchmark Yr./Yr. % Chg. Index Benchmark Yr./Yr. % Chg. Index Benchmark Yr./Yr. % Chg. Toronto Regional Real Estate Board FOCUS ON THE MLS HOME PRICE INDEX ALL TRREB AREAS INDEX AND BENCHMARK PRICE, APRIL 2021 TRREB Total Halton Region Burlington Halton Hills Milton Oakville Peel Region Brampton Caledon Mississauga City of Toronto York Region Aurora East Gwillimbury Georgina King Markham Newmarket Richmond Hill Vaughan Whitchurch-Stouffville Durham Region Ajax Brock Clarington Oshawa Pickering Scugog Uxbridge Whitby Dufferin County Orangeville Simcoe County Adjala-Tosorontio Bradford West Gwillimbury Essa Innisfil Barrie New Tecumseth 25 Market Watch, April 2021 Copyright® 2021 Toronto Regional Real Estate Board
- 26. 337.7 $1,025,200 17.83% 340.9 $1,259,500 24.51% 352.0 $988,900 22.99% 345.7 $759,500 17.55% 313.1 $627,600 4.26% 325.7 $1,056,100 9.11% 329.7 $1,446,700 18.47% 346.3 $1,154,300 17.15% 327.6 $780,600 11.28% 316.4 $651,700 2.49% 304.6 $1,227,500 11.33% 298.2 $1,556,100 15.40% 324.5 $1,251,300 15.69% 300.1 $635,200 8.42% 302.9 $684,800 9.07% 365.2 $1,298,100 14.30% 348.1 $1,472,500 15.84% 393.7 $1,206,800 17.59% 393.1 $758,300 10.33% 349.2 $749,600 9.26% 372.8 $960,900 17.79% 381.0 $1,035,800 18.43% 374.1 $958,200 20.17% 272.1 $659,500 8.49% 345.1 $589,600 10.89% 338.4 $867,700 11.35% 326.5 $1,028,300 16.69% 316.2 $914,400 17.81% 279.6 $654,500 9.35% 364.6 $537,900 6.05% 320.0 $759,900 15.94% 323.9 $1,074,200 17.19% 297.3 $868,100 17.56% 298.4 $541,900 15.12% 356.0 $467,800 15.28% 281.5 $820,800 11.53% 369.0 $1,178,200 20.55% 300.2 $909,700 17.13% 335.5 $994,800 7.39% 234.4 $588,000 5.49% 304.5 $1,303,300 16.98% 327.5 $1,419,400 19.26% 285.9 $1,172,200 15.10% 248.7 $914,200 11.88% 186.5 $756,300 4.19% 280.2 $1,117,100 12.21% 280.5 $1,466,200 22.17% 280.1 $1,037,600 17.99% 324.4 $780,200 14.02% 275.4 $573,500 5.07% 310.5 $781,600 13.11% 311.9 $1,163,200 21.93% 275.3 $791,500 26.00% 327.1 $851,100 8.13% 306.7 $393,300 4.25% 344.3 $781,900 13.67% 336.0 $1,008,000 18.85% 338.6 $866,500 16.36% 400.1 $720,300 23.68% 343.4 $477,000 7.89% 342.1 $845,200 0.47% 358.9 $1,359,200 9.62% 349.4 $1,223,100 10.19% 330.9 $943,200 9.06% 340.7 $709,300 -0.76% 317.2 $1,526,300 10.95% 292.8 $2,339,500 16.05% 326.8 $1,714,000 16.59% 308.6 $1,551,700 1.41% 313.1 $892,000 7.85% 371.4 $1,939,700 14.84% 353.0 $2,169,400 17.28% 381.7 $1,415,400 19.73% - - - 390.8 $1,022,300 8.40% 284.9 $1,773,400 11.33% 291.7 $2,055,200 12.84% 307.4 $1,439,200 14.45% - - - 248.9 $665,800 3.28% 331.0 $1,289,000 8.52% 320.3 $1,368,000 17.15% 267.5 $989,700 11.50% 294.4 $789,600 11.52% 345.4 $763,900 3.23% 305.9 $1,058,300 6.96% 343.1 $1,569,600 14.06% 247.5 $885,700 15.71% 296.0 $834,300 11.82% 287.0 $700,800 1.66% 305.9 $799,900 -3.17% 326.1 $1,909,400 8.34% 343.2 $1,637,200 17.17% 329.4 $851,900 9.04% 302.5 $653,900 -4.81% 221.8 $1,578,100 11.01% 176.3 $2,214,700 18.32% 187.3 $1,524,100 15.90% 300.5 $1,774,800 7.40% 246.5 $816,700 8.35% 317.0 $1,253,000 2.49% 301.8 $1,863,300 7.44% 292.2 $1,443,600 8.58% 284.8 $954,600 4.59% 326.2 $779,000 0.31% 327.4 $1,159,300 11.89% 264.9 $1,804,500 19.70% 303.9 $1,410,100 19.46% 287.4 $497,900 25.61% 374.1 $543,200 8.15% 260.1 $2,219,200 11.77% 242.5 $2,599,000 15.04% 336.1 $1,406,700 21.16% 238.0 $952,200 14.75% 309.9 $971,600 4.41% 308.9 $1,122,400 8.69% 307.7 $1,640,900 21.05% 292.7 $933,900 28.04% 279.3 $807,400 12.53% 312.9 $639,200 -0.03% 304.8 $996,800 1.33% 312.0 $1,687,800 13.74% 246.0 $1,198,000 12.28% 345.7 $931,000 1.53% 298.7 $752,200 -1.26% 295.7 $959,600 7.57% 339.3 $1,593,100 14.13% 284.6 $925,300 16.02% 323.3 $773,800 9.78% 276.3 $642,500 3.37% 420.5 $1,309,500 11.60% 421.6 $1,487,700 17.27% 430.9 $1,359,200 15.83% 479.8 $877,500 12.60% 372.9 $816,800 -3.32% 356.7 $1,335,800 13.96% 318.7 $1,452,000 16.36% 391.3 $1,310,300 16.35% 370.5 $1,067,100 7.80% 283.8 $775,900 3.77% 344.8 $1,060,600 18.45% 355.6 $1,198,900 19.61% 333.3 $1,091,500 19.72% - - - 315.4 $460,900 12.44% 352.7 $871,700 16.60% 338.4 $997,600 20.56% 353.0 $850,700 18.98% 304.3 $659,700 9.90% 399.2 $614,700 14.94% 318.8 $836,500 13.69% 332.8 $1,172,000 18.94% 323.1 $890,400 20.20% 323.5 $703,500 16.07% 301.5 $592,200 6.88% 347.5 $969,000 20.91% 364.8 $1,042,100 24.42% 362.6 $862,400 24.73% - - - 270.0 $571,000 5.30% 333.6 $817,700 10.50% 338.0 $1,107,900 15.32% 329.3 $861,000 17.27% 329.9 $714,700 18.71% 331.6 $567,900 5.54% 352.3 $850,100 18.54% 343.7 $1,071,300 23.59% 308.2 $799,000 25.28% 351.9 $718,300 15.87% 369.1 $588,900 11.44% 335.5 $802,100 12.43% 339.0 $962,500 19.92% 327.3 $800,500 19.85% 363.1 $674,800 10.36% 328.8 $616,700 5.93% 349.5 $979,500 18.80% 338.7 $1,085,200 22.58% 346.5 $898,500 25.09% 394.0 $687,900 10.67% 313.9 $506,400 7.10% 358.1 $783,200 15.67% 356.2 $990,700 16.33% 366.2 $829,500 18.90% 283.7 $556,800 20.06% 423.2 $631,600 15.22% Composite Single Family Detached Single Family Attached Townhouse Apartment Index Benchmark Yr./Yr. % Chg. Index Benchmark Yr./Yr. % Chg. Index Benchmark Yr./Yr. % Chg. Index Benchmark Yr./Yr. % Chg. Index Benchmark Yr./Yr. % Chg. Toronto Regional Real Estate Board FOCUS ON THE MLS HOME PRICE INDEX CITY OF TORONTO INDEX AND BENCHMARK PRICE, APRIL 2021 TRREB Total City of Toronto Toronto W01 Toronto W02 Toronto W03 Toronto W04 Toronto W05 Toronto W06 Toronto W07 Toronto W08 Toronto W09 Toronto W10 Toronto C01 Toronto C02 Toronto C03 Toronto C04 Toronto C06 Toronto C07 Toronto C08 Toronto C09 Toronto C10 Toronto C11 Toronto C12 Toronto C13 Toronto C14 Toronto C15 Toronto E01 Toronto E02 Toronto E03 Toronto E04 Toronto E05 Toronto E06 Toronto E07 Toronto E08 Toronto E09 Toronto E10 Toronto E11 26 Market Watch, April 2021 Copyright® 2021 Toronto Regional Real Estate Board
- 27. 2009 86,980 $395,234 2010 85,860 $431,262 2011 89,110 $464,989 2012 85,488 $497,073 2013 87,047 $522,951 2014 92,776 $566,611 2015 101,214 $622,116 2016 113,040 $729,821 2017 92,340 $822,496 2018 78,017 $787,800 2019 87,749 $819,057 Year Sales Average Price Toronto Regional Real Estate Board January 4,546 838,087 February 7,192 910,024 March 7,945 902,786 April 2,957 820,226 May 4,594 863,563 June 8,646 931,086 July 11,033 943,594 August 10,738 951,219 September 11,033 960,613 October 10,503 968,535 November 8,729 955,873 December 7,156 932,277 January 6,892 $966,158 February 10,947 $1,045,355 March 15,655 $1,097,340 April 13,663 $1,090,992 May - - June - - July - - August - - September - - October - - November - - December - - Annual 95,072 $929,625 HISTORIC ANNUAL STATISTICS1,6,7 Year to Date 47,157 $1,064,261 NOTES *For historic annual sales and average price data over a longer time frame go to: http://www.torontorealestateboard.com/market_news/market_watch/historic_stats/ pdf/TREB_historic_statistics.pdf Ajax Aurora Bradford West Gwillimbury Brampton Brock Burlington C01 C02 C03 C04 C06 C07 C08 C10 C11 C12 C13 C14 C15 Caledon Clarington E01 E02 E03 E04 E06 E07 E08 E09 E10 E11 East Gwillimbury Essa Georgina Halton Hills Innisfil King Markham Milton Mississauga New Tecumseth Newmarket Oakville Oshawa Pickering Richmond Hill Scugog Uxbridge Vaughan W02 W03 W04 W05 W06 W07 W08 W09 W10 Whitchurch-Stouffville Adjala-Tosorontio Orangeville Whitby Dufferin Durham Halton Peel Simcoe Toronto York 27 Market Watch, April 2021 Copyright® 2021 Toronto Regional Real Estate Board 1 - Sales, dollar volume, average sale prices and median sale prices are based on firm transactions entered into the TRREB MLS® system between the first and last day of the month/period being reported. 2 - New listings entered into the TRREB MLS® system between the first and last day of the month/period being reported. 3 - Active listings at the end of the last day of the month/period being reported. 4 - Ratio of the average selling price to the average listing price for firm transactions entered into the TRREB MLS® system between the first and last day of the month/period being reported. 5 - Average Listing Days on Market (Avg. LDOM) refers to the average number of days sold listings were on the market. Average Property Days on Market (Avg. PDOM) refers to the average number of days a property was on the market before selling irrespective of whether the property was listed more than once by the same combination of seller and brokerage during the original listing contract period. 6 - Active listings at the end of the last day of the month/period being reported. 7 - Past monthly and year-to-date figures are revised on a monthly basis. 8 - SNLR = Sales-to-New Listings Ratio. Calculated using a 12-month moving average (sales/new listings). 9 - Mos. Inv. = Months of Inventory. Calculated using a 12-month moving average (active listings/sales). 2021 MONTHLY STATISTICS1,7 2020 MONTHLY STATISTICS1,7