
Recommended
Recommended
More Related Content
What's hot
What's hot (20)
Similar to Rebgv stats-pkg-october-2018 .pdf
Similar to Rebgv stats-pkg-october-2018 .pdf (20)
More from Kathryn Huang
More from Kathryn Huang (10)
Recently uploaded
Recently uploaded (20)
Rebgv stats-pkg-october-2018 .pdf
- 1. News Release FOR IMMEDIATE RELEASE: Home listings at four-year October high as sales remain below typical levels VANCOUVER, BC – November 2, 2018 –Home sale activity across Metro Vancouver* remained below long-term historical averages in October. The Real Estate Board of Greater Vancouver (REBGV) reports that residential home sales in the region totalled 1,966 in October 2018, a 34.9 per cent decrease from the 3,022 sales recorded in October 2017, and a 23.3 per cent increase compared to September 2018 when 1,595 homes sold. Last month’s sales were 26.8 per cent below the 10-year October sales average. “The supply of homes for sale today is beginning to return to levels that we haven’t seen in our market in about four years,” Phil Moore, REBGV president said. “For home buyers, this means you have more selection to choose from. For sellers, it means your home may face more competition, from other listings, in the marketplace.” There were 4,873 detached, attached and apartment homes newly listed for sale on the Multiple Listing Service® (MLS®) in Metro Vancouver in October 2018. This represents a 7.4 per cent increase compared to the 4,539 homes listed in October 2017 and a 7.7 per cent decrease compared to September 2018 when 5,279 homes were listed. The total number of homes currently listed for sale on the MLS® system in Metro Vancouver is 12,984, a 42.1 per cent increase compared to October 2017 (9,137) and a 0.8 per cent decrease compared to September 2018 (13,084). For all property types, the sales-to-active listings ratio for October 2018 is 15.1 per cent. By property type, the ratio is 10.3 per cent for detached homes, 17.3 per cent for townhomes, and 20.6 per cent for condominiums. Generally, analysts say that downward pressure on home prices occurs when the ratio dips below the 12 per cent mark for a sustained period, while home prices often experience upward pressure when it surpasses 20 per cent over several months. “Home prices have edged down between three and five per cent, depending on housing type, in our region since June,” said Moore. “This is providing a little relief for those looking to buy compared to the all-time highs we’ve experienced over the last year.”
- 2. The MLS® Home Price Index composite benchmark price for all residential homes in Metro Vancouver is currently $1,062,100. This represents a one per cent increase over October 2017 and a 3.3 per cent decrease over the last three months. Sales of detached homes in October 2018 reached 637, a 32.2 per cent decrease from the 940 detached sales recorded in October 2017. The benchmark price for detached properties is $1,524,000. This represents a 5.1 per cent decrease from October 2017 and a 3.9 per cent decrease over the last three months. Sales of apartments reached 985 in October 2018, a 35.7 per cent decrease compared to the 1,532 sales in October 2017. The benchmark price of an apartment property is $683,500. This represents a 5.8 per cent increase from October 2017 and a 3.1 per cent decrease over the last three months. Attached homes sales in October 2018 totalled 344, a 37.5 per cent decrease compared to the 550 sales in October 2017. The benchmark price of an attached home is $829,200. This represents a 4.4 per cent increase from October 2017 and a 2.8 per cent decrease over the last three months. -30- *Editor’s Note: Areas covered by the Real Estate Board of Greater Vancouver include: Whistler, Sunshine Coast, Squamish, West Vancouver, North Vancouver, Vancouver, Burnaby, New Westminster, Richmond, Port Moody, Port Coquitlam, Coquitlam, Pitt Meadows, Maple Ridge, and South Delta. The real estate industry is a key economic driver in British Columbia. In 2017, 35,993 homes changed ownership in the Board’s area, generating $2.4 billion in economic spin-off activity and an estimated 17,600 jobs. The total dollar value of residential sales transacted through the MLS® system in Greater Vancouver totalled $37 billion in 2017. The Real Estate Board of Greater Vancouver is an association representing more than 14,000 REALTORS® and their companies. The Board provides a variety of member services, including the Multiple Listing Service®. For more information on real estate, statistics, and buying or selling a home, contact a local REALTOR® or visit www.rebgv.org. For more information please contact: Craig Munn Manager, Communication Real Estate Board of Greater Vancouver 604.730.3146 cmunn@rebgv.org
- 3. Property Type Area Benchmark Price Price Index 1 Month Change % 3 Month Change % 6 Month Change % 1 Year Change % 3 Year Change % 5 Year Change % 10 Year Change % Residential / Composite Lower Mainland $995,500 273.3 -0.8% -3.4% -3.2% 2.9% 48.5% 77.6% 96.2% Greater Vancouver $1,062,100 275.0 -0.8% -3.3% -3.6% 1.0% 41.9% 73.3% 97.0% Bowen Island $968,200 209.9 -0.7% -4.9% -2.5% 1.0% 50.3% 68.6% 58.7% Burnaby East $1,002,700 278.1 -0.3% -4.0% -3.4% 3.9% 44.0% 70.8% 100.9% Burnaby North $914,100 276.0 -1.5% -4.2% -2.8% 2.4% 46.9% 73.8% 97.3% Burnaby South $1,019,600 288.0 -0.3% -3.9% -2.4% 2.4% 46.2% 77.8% 106.2% Coquitlam $941,600 279.3 -1.9% -4.0% -3.2% 3.6% 50.0% 87.4% 104.2% Ladner $866,100 243.1 -1.7% -2.5% -1.3% 0.5% 31.0% 63.6% 79.5% Maple Ridge $782,900 249.3 -1.0% -3.1% -3.4% 6.2% 66.4% 86.3% 83.8% New Westminster $700,700 307.9 1.2% -2.4% -0.7% 10.2% 68.1% 92.3% 112.3% North Vancouver $1,065,500 242.9 -1.6% -4.0% -5.6% -1.1% 37.9% 64.7% 82.9% Pitt Meadows $775,200 281.8 -0.9% -4.1% -2.3% 10.0% 72.2% 95.4% 105.5% Port Coquitlam $766,600 262.4 -0.7% -4.6% -5.3% 3.3% 54.9% 83.5% 87.2% Port Moody $950,400 262.7 -0.8% -2.3% -2.5% 5.0% 52.5% 85.5% 93.3% Richmond $1,016,200 292.8 -1.4% -3.0% -3.4% 1.8% 41.9% 74.4% 105.8% Squamish $780,600 245.0 -0.2% -4.8% -4.4% 4.6% 60.1% 98.5% 83.0% Sunshine Coast $599,400 210.0 -0.7% -4.2% -2.8% 1.8% 56.7% 73.8% 57.0% Tsawwassen $996,200 250.2 -2.0% -2.1% -2.8% -0.5% 31.8% 68.8% 87.4% Vancouver East $1,077,100 315.4 -1.6% -2.2% -3.3% -0.6% 39.4% 76.7% 115.9% Vancouver West $1,315,600 277.4 0.5% -3.1% -4.1% -3.4% 30.9% 64.0% 97.2% West Vancouver $2,357,100 253.4 -1.7% -5.6% -10.0% -9.5% 14.8% 46.4% 89.2% Whistler $941,100 203.8 -0.5% -3.6% -4.8% 5.5% 64.1% 101.2% 52.4% Single Family Detached Lower Mainland $1,285,300 272.8 -0.7% -3.7% -4.0% -2.7% 35.1% 69.5% 101.2% Greater Vancouver $1,524,000 280.6 -1.1% -3.9% -4.9% -5.1% 27.0% 64.6% 104.5% Bowen Island $968,200 209.9 -0.7% -4.9% -2.5% 1.0% 50.3% 68.6% 58.7% Burnaby East $1,250,400 279.6 0.2% -5.6% -6.1% -0.6% 29.9% 65.0% 111.5% Burnaby North $1,487,200 287.6 -0.7% -4.4% -6.8% -5.7% 20.4% 60.0% 111.3% Burnaby South $1,629,300 311.9 2.5% -3.3% -2.8% -4.4% 29.4% 68.1% 128.3% Coquitlam $1,252,200 277.9 -2.6% -4.4% -4.0% -2.0% 36.0% 76.7% 105.7% Ladner $984,900 237.4 -2.1% -3.1% -2.0% -4.2% 23.6% 60.3% 79.4% Maple Ridge $853,000 243.0 -1.3% -2.6% -1.8% 5.1% 60.6% 85.1% 85.2% New Westminster $1,121,200 279.7 0.3% -3.9% -6.0% -1.0% 32.4% 66.6% 108.9% North Vancouver $1,594,700 249.4 -1.6% -4.8% -6.4% -6.2% 28.7% 65.6% 91.3% Pitt Meadows $908,500 256.0 -2.1% -4.9% -3.7% 3.4% 53.5% 80.3% 97.8% Port Coquitlam $975,500 260.1 -0.9% -4.0% -5.9% -1.9% 37.8% 76.6% 92.5% Port Moody $1,489,100 275.0 -1.0% -2.7% -1.4% -1.3% 38.8% 73.9% 101.0% Richmond $1,634,800 316.7 -1.7% -3.9% -6.3% -6.6% 26.5% 69.4% 118.7% Squamish $968,500 244.8 -1.7% -6.8% -5.7% -0.2% 52.9% 93.2% 86.7% Sunshine Coast $597,700 209.4 -0.4% -4.0% -2.7% 2.2% 57.2% 74.4% 56.5% Tsawwassen $1,237,200 266.4 -2.3% -2.2% -2.2% -3.0% 29.6% 73.8% 104.0% Vancouver East $1,480,700 327.3 -1.5% -3.5% -4.1% -5.5% 26.0% 74.3% 135.6% Vancouver West $3,267,800 335.5 0.4% -2.6% -4.0% -9.9% 17.8% 56.5% 127.3% West Vancouver $2,758,400 260.4 -0.7% -5.4% -9.7% -10.9% 10.6% 44.5% 94.8% Whistler $1,709,700 218.4 -1.9% -3.4% -2.4% 1.1% 52.7% 83.4% 64.2% HOW TO READ THE TABLE: • Benchmark Price: Estimated sale price of a benchmark property. Benchmarks represent a typical property within each market. • Price Index: Index numbers estimate the percentage change in price on typical and constant quality properties over time. All figures are based on past sales. • x Month/Year Change %: Percentage change of index over a period of x month(s)/year(s) * In January 2005, the indexes are set to 100. Townhome properties are similar to Attached properties, a category that was used in the previous MLSLink HPI, but do not included duplexes. The above info is deemed reliable, but is not guaranteed. All dollar amounts in CDN. October 2018* * MLS®, Multiple Listing Service®, and all related graphics are trademarks of The Canadian Real Estate Association 1 of 15
- 4. Property Type Area Benchmark Price Price Index 1 Month Change % 3 Month Change % 6 Month Change % 1 Year Change % 3 Year Change % 5 Year Change % 10 Year Change % October 2018* Townhouse Lower Mainland $698,700 252.0 -1.2% -3.2% -2.2% 5.3% 56.8% 75.7% 81.8% Greater Vancouver $829,200 263.9 -1.0% -2.8% -2.0% 4.4% 51.7% 74.9% 89.2% Burnaby East $712,300 263.1 -0.9% -2.9% 1.9% 10.1% 60.9% 70.4% 85.7% Burnaby North $761,100 284.1 -1.0% -2.8% 0.5% 5.9% 59.3% 76.4% 96.5% Burnaby South $811,100 279.4 -1.4% -4.2% -2.9% 6.4% 55.6% 78.5% 99.1% Coquitlam $681,000 249.9 -0.8% -4.2% -3.0% 4.6% 49.6% 77.2% 85.1% Ladner $775,700 270.5 -1.3% -2.7% -1.3% 4.2% 44.3% 71.4% 91.4% Maple Ridge $552,900 256.7 -1.0% -2.6% -5.5% 4.4% 73.3% 86.7% 82.7% New Westminster $726,100 287.1 -0.5% -1.1% 1.5% 7.0% 56.1% 79.3% 103.5% North Vancouver $1,026,400 249.4 0.4% -0.7% -0.4% 5.1% 48.0% 74.4% 91.1% Pitt Meadows $661,900 286.4 0.7% -2.0% 4.3% 15.3% 81.5% 109.2% 106.3% Port Coquitlam $646,400 244.7 -2.1% -5.8% -6.0% 0.7% 54.3% 71.6% 78.1% Port Moody $677,000 228.8 0.1% -1.8% 2.2% 11.7% 41.5% 68.6% 65.4% Richmond $851,700 279.9 -1.2% -2.0% 1.5% 6.5% 49.4% 74.1% 98.7% Squamish $724,900 247.2 -0.2% 1.4% 2.5% 8.9% 64.5% 98.6% 82.0% Tsawwassen $752,000 280.1 -2.4% -1.0% -3.7% 1.6% 50.0% 77.3% 98.2% Vancouver East $833,200 273.5 -4.6% -6.7% -10.7% -2.6% 37.3% 62.3% 83.8% Vancouver West $1,232,500 272.2 0.3% -4.4% -5.4% -2.6% 42.7% 67.2% 96.8% Whistler $951,200 237.9 -0.5% 1.6% 2.5% 9.7% 69.9% 105.3% 75.2% Apartment Lower Mainland $670,000 283.1 -0.7% -3.2% -2.9% 8.7% 66.3% 89.1% 96.2% Greater Vancouver $683,500 274.3 -0.5% -3.1% -3.1% 5.8% 58.3% 82.7% 93.2% Burnaby East $761,400 292.1 -0.8% -3.3% -5.5% 5.1% 62.2% 75.4% 94.0% Burnaby North $631,200 269.5 -2.1% -4.5% -1.4% 7.5% 72.2% 86.2% 91.3% Burnaby South $701,400 281.6 -1.2% -4.2% -2.0% 5.6% 58.2% 85.4% 99.4% Coquitlam $529,000 290.3 -1.6% -3.6% -2.7% 8.7% 72.3% 106.8% 106.6% Ladner $464,800 220.3 -1.2% -1.6% -1.7% 10.0% 37.9% 58.3% 57.2% Maple Ridge $363,700 259.7 -0.1% -5.7% -5.6% 11.7% 77.6% 85.1% 74.6% New Westminster $560,000 317.3 1.6% -2.3% 0.1% 13.4% 83.8% 101.8% 112.8% North Vancouver $582,000 233.5 -2.3% -4.3% -6.3% 3.0% 50.1% 61.7% 71.8% Pitt Meadows $514,800 303.6 -0.9% -5.1% -5.9% 11.0% 84.8% 99.9% 104.2% Port Coquitlam $458,200 274.0 0.2% -4.7% -4.8% 9.6% 77.7% 99.4% 84.1% Port Moody $659,200 274.7 -1.1% -2.2% -4.8% 7.5% 76.0% 106.1% 106.4% Richmond $681,900 284.7 -1.2% -2.6% -2.7% 9.3% 65.7% 84.8% 101.6% Squamish $487,500 234.8 1.0% -9.1% -10.5% 7.4% 66.3% 121.9% 73.0% Tsawwassen $496,800 209.5 -0.9% -1.4% -3.3% 9.9% 44.5% 61.7% 49.5% Vancouver East $569,100 314.0 -1.1% 0.0% -1.0% 5.7% 62.4% 85.5% 102.5% Vancouver West $809,600 262.7 0.7% -3.1% -3.8% 0.4% 42.2% 73.3% 89.3% West Vancouver $1,157,200 234.4 -4.7% -6.3% -10.7% -0.5% 51.2% 61.9% 74.5% Whistler $523,400 171.6 0.5% -8.5% -12.2% 5.0% 78.8% 153.1% 30.0% HOW TO READ THE TABLE: • Benchmark Price: Estimated sale price of a benchmark property. Benchmarks represent a typical property within each market. • Price Index: Index numbers estimate the percentage change in price on typical and constant quality properties over time. All figures are based on past sales. • x Month/Year Change %: Percentage change of index over a period of x month(s)/year(s) In January 2005, the indexes are set to 100. * Townhome properties are similar to attached properties, a category that was used in the previous MLSLink HPI, but do not included duplexes. Lower Mainland includes areas serviced by both Real Estate Board of Greater Vancouver & Fraser Valley Real Estate Board. The above info is deemed reliable, but is not guaranteed. All dollar amounts in CDN. * MLS®, Multiple Listing Service®, and all related graphics are trademarks of The Canadian Real Estate Association 2 of 15
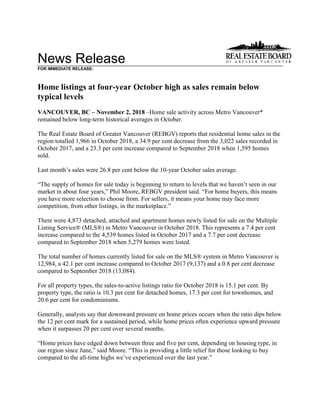
- 5. C:DATAMonthEndHpiexporthi_resgv-hpi2.tifGreaterVancouver 5YearTrend 60 110 160 210 260 310 Oct 2013 Dec 2013 Feb 2014 Apr 2014 Jun 2014 Aug 2014 Oct 2014 Dec 2014 Feb 2015 Apr 2015 Jun 2015 Aug 2015 Oct 2015 Dec 2015 Feb 2016 Apr 2016 Jun 2016 Aug 2016 Oct 2016 Dec 2016 Feb 2017 Apr 2017 Jun 2017 Aug 2017 Oct 2017 Dec 2017 Feb 2018 Apr 2018 Jun 2018 Aug 2018 Oct 2018 Price Index ResidentialDetachedTownhouseApartment Jan2005HPI=100
- 8. Listing & Sales Activity Summary Listings Sales 1 2 3 Col. 2 & 3 5 6 7 Col. 6 & 7 9 10 Col. 9 & 10 Oct Sep Oct Percentage Oct Sep Oct Percentage Aug 2017 - Aug 2018 - Percentage 2017 2018 2018 Variance 2017 2018 2018 Variance Oct 2017 Oct 2018 Variance BURNABY % % % DETACHED 184 172 186 8.1 88 39 45 15.4 215 124 -42.3 ATTACHED 83 107 104 -2.8 70 36 32 -11.1 204 105 -48.5 APARTMENTS 208 259 290 12.0 206 100 103 3.0 626 322 -48.6 COQUITLAM DETACHED 151 191 131 -31.4 88 49 45 -8.2 245 154 -37.1 ATTACHED 55 80 78 -2.5 42 26 28 7.7 124 91 -26.6 APARTMENTS 128 180 152 -15.6 116 55 62 12.7 351 202 -42.5 DELTA DETACHED 87 94 71 -24.5 46 24 27 12.5 137 80 -41.6 ATTACHED 14 34 32 -5.9 11 14 7 -50.0 24 31 29.2 APARTMENTS 14 33 27 -18.2 13 17 12 -29.4 44 38 -13.6 MAPLE RIDGE/PITT MEADOWS DETACHED 154 165 164 -0.6 121 46 85 84.8 396 205 -48.2 ATTACHED 74 89 86 -3.4 50 26 46 76.9 159 112 -29.6 APARTMENTS 60 69 61 -11.6 46 30 43 43.3 124 103 -16.9 NORTH VANCOUVER DETACHED 175 240 176 -26.7 81 41 68 65.9 230 140 -39.1 ATTACHED 62 69 78 13.0 42 21 26 23.8 102 77 -24.5 APARTMENTS 168 226 209 -7.5 125 56 79 41.1 343 205 -40.2 NEW WESTMINSTER DETACHED 38 46 45 -2.2 23 14 14 0.0 64 42 -34.4 ATTACHED 18 14 35 150.0 13 3 3 0.0 45 13 -71.1 APARTMENTS 134 174 157 -9.8 116 64 71 10.9 367 199 -45.8 PORT MOODY/BELCARRA DETACHED 33 44 28 -36.4 22 9 11 22.2 52 25 -51.9 ATTACHED 22 21 13 -38.1 17 8 11 37.5 50 25 -50.0 APARTMENTS 45 50 28 -44.0 36 17 14 -17.6 93 49 -47.3 PORT COQUITLAM DETACHED 52 59 48 -18.6 31 23 17 -26.1 120 58 -51.7 ATTACHED 22 48 46 -4.2 21 14 21 50.0 69 53 -23.2 APARTMENTS 50 57 66 15.8 66 35 37 5.7 165 108 -34.5 RICHMOND DETACHED 225 245 201 -18.0 91 62 59 -4.8 269 176 -34.6 ATTACHED 144 117 120 2.6 117 36 47 30.6 330 140 -57.6 APARTMENTS 247 283 259 -8.5 202 96 124 29.2 644 374 -41.9 SUNSHINE COAST DETACHED 58 66 64 -3.0 65 37 49 32.4 189 140 -25.9 ATTACHED 11 6 6 0.0 10 5 5 0.0 34 16 -52.9 APARTMENTS 7 5 4 -20.0 11 3 4 33.3 31 9 -71.0 SQUAMISH DETACHED 31 36 24 -33.3 21 11 15 36.4 65 48 -26.2 ATTACHED 23 26 25 -3.8 30 3 12 300.0 74 28 -62.2 APARTMENTS 21 14 23 64.3 17 8 6 -25.0 52 30 -42.3 VANCOUVER EAST DETACHED 248 223 197 -11.7 106 72 80 11.1 315 210 -33.3 ATTACHED 101 88 76 -13.6 40 27 35 29.6 112 84 -25.0 APARTMENTS 199 296 254 -14.2 150 95 119 25.3 421 325 -22.8 VANCOUVER WEST DETACHED 220 211 207 -1.9 108 38 66 73.7 233 162 -30.5 ATTACHED 99 136 104 -23.5 54 33 46 39.4 174 117 -32.8 APARTMENTS 602 682 701 2.8 392 208 268 28.8 1201 751 -37.5 WHISTLER/PEMBERTON DETACHED 23 20 14 -30.0 14 12 17 41.7 45 41 -8.9 ATTACHED 28 30 31 3.3 26 21 22 4.8 84 55 -34.5 APARTMENTS 19 33 39 18.2 28 21 28 33.3 90 71 -21.1 WEST VANCOUVER/HOWE SOUND DETACHED 150 162 144 -11.1 29 25 36 44.0 94 88 -6.4 ATTACHED 13 19 21 10.5 7 2 3 50.0 11 9 -18.2 APARTMENTS 31 56 43 -23.2 8 7 15 114.3 44 36 -18.2 GRAND TOTALS DETACHED 1829 1974 1700 -13.9 934 502 634 26.3 2669 1693 -36.6 ATTACHED 769 884 855 -3.3 550 275 344 25.1 1596 956 -40.1 APARTMENTS 1933 2417 2313 -4.3 1532 812 985 21.3 4596 2822 -38.6