TREB October 2017 Market Watch: Sales up 12% YoY as market regains momentum
•
0 likes•1,968 views

October 2017 Market Report on Resale Housing in GTA and Toronto

Recommended
Recommended
More Related Content
What's hot
What's hot (15)
Similar to TREB October 2017 Market Watch: Sales up 12% YoY as market regains momentum
Similar to TREB October 2017 Market Watch: Sales up 12% YoY as market regains momentum (18)
More from Michelle Makos
More from Michelle Makos (12)
Recently uploaded
Recently uploaded (20)
TREB October 2017 Market Watch: Sales up 12% YoY as market regains momentum
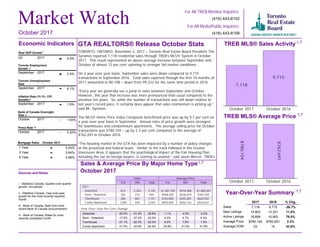
- 1. Toronto Employment Growth September 2017 2.4% Month October 2017 1 Year 3 Year 5 Year 3.24% 3.64% 4.99% October 2017 1 Year 3 Year 5 Year Market Watch For All TREB Member Inquiries: (416) 443-8158 For All Media/Public Inquiries: (416) 443-8152 GTA REALTORS® Release October Stats TORONTO, ONTARIO, November 2, 2017 – Toronto Real Estate Board President Tim Syrianos reported 7,118 residential sales through TREB’s MLS® System in October 2017. This result represented an above-average increase between September and October of almost 12 per cent, pointing to stronger fall market conditions. On a year-over-year basis, September sales were down compared to 9,715 transactions in September 2016. Total sales reported through the first 10 months of 2017 amounted to 80,198 – down from 99,233 for the same time period in 2016. “Every year we generally see a jump in sales between September and October. However, this year that increase was more pronounced than usual compared to the previous ten years. So, while the number of transactions was still down relative to last year’s record pace, it certainly does appear that sales momentum is picking up,” said Mr. Syrianos. The MLS® Home Price Index Composite benchmark price was up by 9.7 per cent on a year-over-year basis in September. Annual rates of price growth were strongest for townhouses and condominium apartments. The average selling price for October transactions was $780,104 – up by 2.3 per cent compared to the average of $762,691 in October 2016. “The housing market in the GTA has been impacted by a number of policy changes at the provincial and federal levels. Similar to the track followed in the Greater Vancouver Area, it appears that the psychological impact of the Fair Housing Plan, including the tax on foreign buyers, is starting to unwind,” said Jason Mercer, TREB’s Director of Market Analysis. TREB MLS® Sales Activity 7,118 9,715 October 2017 October 2016 TREB MLS® Average Price $780,104 $762,691 October 2017 October 2016 Year-Over-Year Summary 2017 2016 % Chg. Sales New Listings Active Listings Average Price Average DOM 7,118 9,715 -26.7% 14,903 13,331 11.8% 18,859 10,563 78.5% $780,104 $762,691 2.3% 23 16 43.8% Sources and Notes: i - Statistics Canada, Quarter-over-quarter growth, annualized ii - Statistics Canada, Year-over-year growth for the most recently reported month iii - Bank of Canada, Rate from most recent Bank of Canada announcement iv - Bank of Canada, Rates for most recently completed month Real GDP Growth Q2 2017 4.5% Toronto Unemployment Rate September 2017 6.1% Inflation Rate (Yr./Yr. CPI Growth) September 2017 1.6% Bank of Canada Overnight Rate October 2017 -- 1.00% Prime Rate October 2017 -- 3.20% Economic Indicators Metrics Sales Average Price 416 905 Total 416 905 Total 2017 Detached Semi - Detached Townhouse Condo Apartment 812 2,323 3,135 $1,287,765 $910,488 $1,008,207 284 410 694 $948,309 $636,829 $764,293 284 867 1,151 $742,845 $592,381 $629,507 1,485 540 2,025 $555,004 $435,142 $523,041 Sales & Average Price By Major Home Type October 2017 October 2017 i ii ii iii iv Detached Semi - Detached Townhouse Condo Apartment -1.1% -4.0% -2.5% 5.2% 4.7% 6.3% 8.0% 7.0% 7.4% 20.9% 21.0% 21.8% Detached Semi - Detached Townhouse Condo Apartment -25.0% -31.4% -29.8% -17.0% -27.4% -23.5% -21.1% -22.2% -22.0% -21.4% -33.0% -24.9% 1,7 1,7 1,7 1,7 Year-Over-Year Per Cent Change Mortgage Rates
- 2. Toronto Real Estate Board Market Watch, October 2017 SALES BY PRICE RANGE AND HOUSE TYPE OCTOBER 2017 2 Price Range Detached Semi-Detached Att/Row/Twnhouse Condo Townhouse Condo Apt Link Co-op Apt Det Condo Co-ownership Apt Total $0 to $99,999 $100,000 to $199,999 $200,000 to $299,999 $300,000 to $399,999 $400,000 to $499,999 $500,000 to $599,999 $600,000 to $699,999 $700,000 to $799,999 $800,000 to $899,999 $900,000 to $999,999 $1,000,000 to $1,249,999 $1,250,000 to $1,499,999 $1,500,000 to $1,749,999 $1,750,000 to $1,999,999 $2,000,000+ 0 0 0 0 4 0 0 0 0 4 5 0 0 2 11 0 2 0 0 20 19 0 0 16 103 0 1 0 1 140 73 14 14 70 516 1 3 0 3 694 175 36 71 162 586 10 1 2 0 1,043 279 125 172 137 339 18 2 1 0 1,073 409 203 141 63 187 12 1 2 0 1,018 439 118 82 33 95 16 0 1 0 784 402 69 46 13 76 15 0 1 0 622 276 40 44 6 28 7 2 0 0 403 435 43 30 13 32 10 0 1 0 564 229 27 17 6 23 0 0 0 0 302 127 11 5 3 8 0 0 0 0 154 81 1 1 2 4 0 0 0 0 89 186 7 1 1 13 0 0 0 0 208 Price Range Detached Semi-Detached Att/Row/Twnhouse Condo Townhouse Condo Apt Link Co-op Apt Det Condo Co-ownership Apt Total $0 to $99,999 $100,000 to $199,999 $200,000 to $299,999 $300,000 to $399,999 $400,000 to $499,999 $500,000 to $599,999 $600,000 to $699,999 $700,000 to $799,999 $800,000 to $899,999 $900,000 to $999,999 $1,000,000 to $1,249,999 $1,250,000 to $1,499,999 $1,500,000 to $1,749,999 $1,750,000 to $1,999,999 $2,000,000+ 0 0 0 0 27 0 0 0 0 27 28 1 1 23 231 0 15 0 3 302 130 8 2 227 1,481 1 28 0 15 1,892 515 166 110 643 6,331 11 17 1 27 7,821 1,416 372 590 1,494 6,352 150 8 10 6 10,398 2,595 915 1,402 1,365 3,658 200 8 14 3 10,160 3,757 1,788 1,726 973 2,063 152 2 17 1 10,479 4,508 1,452 966 422 1,128 120 6 10 1 8,613 4,545 922 656 204 677 141 3 6 0 7,154 3,472 534 458 112 322 116 5 3 0 5,022 5,279 572 408 121 373 127 3 4 0 6,887 3,657 260 170 57 201 31 3 2 0 4,381 2,248 96 48 29 97 2 1 1 0 2,522 1,291 46 11 11 56 1 0 0 0 1,416 2,884 87 12 12 128 0 1 0 0 3,124 SALES BY PRICE RANGE AND HOUSE TYPE YEAR-TO-DATE, 2017 Total Sales Share of Total Sales Average Price 3,135 694 624 527 2,025 89 12 8 4 7,118 44.0% 9.7% 8.8% 7.4% 28.4% 1.3% 0.2% 0.1% 0.1% 100.0% $1,008,207 $764,293 $692,241 $555,226 $523,041 $732,859 $486,417 $692,688 $326,555 $780,104 Total Sales Share of Total Sales Average Price 36,325 7,219 6,560 5,693 23,125 1,052 100 68 56 80,198 45.3% 9.0% 8.2% 7.1% 28.8% 1.3% 0.1% 0.1% 0.1% 100.0% $1,113,757 $791,418 $717,956 $568,165 $512,552 $745,426 $471,786 $701,631 $347,000 $833,763 1,7 1,7
- 3. Toronto Real Estate Board Market Watch, October 2017 Number of Sales Dollar Volume Average Price Median Price New Listings SNLR (Trend) Active Listings Mos. Inv. (Trend) Avg. SP / LP Avg. DOM TREB Total Halton Region Burlington Halton Hills Milton Oakville Peel Region Brampton Caledon Mississauga City of Toronto Toronto West Toronto Central Toronto East York Region Aurora E. Gwillimbury Georgina King Markham Newmarket Richmond Hill Vaughan Whitchurch-Stouffville Durham Region Ajax Brock Clarington Oshawa Pickering Scugog Uxbridge Whitby Dufferin County Orangeville Simcoe County Adjala-Tosorontio Bradford West GwillimburyEssa Innisfil New Tecumseth 7,118 $5,552,778,355 780,104 $655,000 14,903 54.5% 18,859 1.7 98% 23 680 $578,910,510 851,339 $730,000 1,397 56.7% 1,919 1.7 97% 26 203 $147,950,086 728,818 $675,000 333 62.1% 517 1.6 97% 29 88 $63,256,700 718,826 $696,000 122 68.2% 146 1.3 99% 21 159 $114,984,099 723,170 $675,000 333 55.6% 368 1.3 97% 22 230 $252,719,625 1,098,781 $870,000 609 51.5% 888 2.0 96% 28 1,416 $976,039,879 689,294 $645,000 2,959 52.6% 3,592 1.6 97% 24 650 $435,103,106 669,389 $640,000 1,429 50.3% 1,633 1.6 98% 24 77 $68,378,924 888,038 $760,000 161 48.7% 282 2.7 96% 29 689 $472,557,849 685,860 $633,000 1,369 55.4% 1,677 1.6 97% 24 2,885 $2,360,509,668 818,201 $650,000 5,051 61.3% 5,681 1.4 99% 20 783 $586,502,071 749,045 $650,000 1,272 61.3% 1,553 1.5 99% 23 1,373 $1,237,320,519 901,180 $621,000 2,418 63.1% 2,717 1.4 99% 20 729 $536,687,078 736,196 $712,000 1,361 58.0% 1,411 1.4 101% 18 1,072 $1,030,653,567 961,431 $850,000 3,199 44.8% 4,686 2.2 97% 27 56 $56,963,774 1,017,210 $892,500 244 42.6% 342 2.3 97% 30 30 $26,024,500 867,483 $695,000 130 37.0% 232 3.4 96% 34 70 $35,966,100 513,801 $530,000 183 44.9% 321 2.5 96% 27 29 $47,778,500 1,647,534 $1,425,000 103 40.8% 195 3.8 96% 30 265 $274,111,699 1,034,384 $900,000 742 47.7% 1,015 1.9 97% 26 96 $79,077,750 823,727 $744,000 303 42.7% 424 2.1 96% 30 208 $205,855,316 989,689 $922,944 626 43.4% 923 2.3 96% 26 259 $256,088,152 988,757 $900,000 715 46.1% 1,012 2.1 97% 27 59 $48,787,776 826,911 $765,000 153 43.1% 222 2.6 96% 30 845 $486,383,932 575,602 $535,000 1,698 54.7% 1,912 1.4 98% 22 134 $82,518,700 615,811 $584,750 256 55.2% 261 1.3 99% 19 11 $4,755,500 432,318 $390,000 31 55.8% 54 2.8 97% 40 158 $82,893,163 524,640 $477,000 275 56.8% 312 1.3 98% 21 231 $111,769,685 483,851 $464,000 505 52.7% 526 1.4 98% 22 104 $69,889,884 672,018 $650,000 235 53.5% 266 1.5 97% 27 19 $11,614,200 611,274 $538,000 41 57.2% 82 2.1 97% 32 24 $21,984,600 916,025 $807,500 47 55.9% 100 2.4 97% 26 164 $100,958,200 615,599 $570,000 308 55.8% 311 1.2 98% 20 54 $26,023,900 481,924 $504,000 68 70.2% 99 1.2 98% 33 54 $26,023,900 481,924 $504,000 68 70.2% 99 1.2 98% 33 166 $94,256,899 567,813 $542,500 531 46.5% 970 2.6 97% 32 9 $5,927,500 658,611 $640,000 20 56.2% 60 3.1 97% 33 41 $27,670,900 674,900 $653,000 145 44.1% 243 2.4 97% 32 18 $8,418,900 467,717 $440,000 44 56.1% 95 2.3 97% 32 53 $28,115,000 530,472 $505,000 204 37.0% 345 3.5 96% 35 45 $24,124,599 536,102 $514,000 118 55.8% 227 2.1 97% 29 SUMMARY OF EXISTING HOME TRANSACTIONS ALL HOME TYPES, OCTOBER 2017 ALL TREB AREAS 3 1 1 1 2 5498 3
- 4. Toronto Real Estate Board Market Watch, October 2017 SUMMARY OF EXISTING HOME TRANSACTIONS ALL HOME TYPES, OCTOBER 2017 CITY OF TORONTO MUNICIPAL BREAKDOWN 4 Number of Sales Dollar Volume Average Price Median Price New Listings SNLR (Trend) Active Listings Mos. Inv. (Trend) Avg. SP / LP Avg. DOM TREB Total City of Toronto Total Toronto West Toronto W01 Toronto W02 Toronto W03 Toronto W04 Toronto W05 Toronto W06 Toronto W07 Toronto W08 Toronto W09 Toronto W10 Toronto Central Toronto C01 Toronto C02 Toronto C03 Toronto C04 Toronto C06 Toronto C07 Toronto C08 Toronto C09 Toronto C10 Toronto C11 Toronto C12 Toronto C13 Toronto C14 Toronto C15 Toronto East Toronto E01 Toronto E02 Toronto E03 Toronto E04 Toronto E05 Toronto E06 Toronto E07 Toronto E08 Toronto E09 Toronto E10 Toronto E11 7,118 $5,552,778,355 $780,104 $655,000 14,903 54.5% 18,859 1.7 98% 23 2,885 $2,360,509,668 $818,201 $650,000 5,051 61.3% 5,681 1.4 99% 20 783 $586,502,071 $749,045 $650,000 1,272 61.3% 1,553 1.5 99% 23 63 $58,718,700 $932,043 $655,000 82 67.3% 69 1.2 100% 23 94 $89,749,610 $954,783 $899,500 122 64.7% 98 1.1 103% 14 54 $37,664,700 $697,494 $658,500 86 57.8% 96 1.4 100% 20 73 $42,745,485 $585,555 $512,700 139 58.8% 168 1.7 97% 21 88 $49,278,125 $559,979 $625,000 187 56.1% 264 2.0 97% 28 127 $82,272,844 $647,818 $576,500 189 65.0% 241 1.5 99% 21 22 $28,874,100 $1,312,459 $1,182,500 53 63.1% 51 1.3 100% 14 141 $133,054,507 $943,649 $814,000 215 64.2% 282 1.3 98% 23 38 $25,507,500 $671,250 $640,000 70 59.6% 99 1.5 97% 27 83 $38,636,500 $465,500 $377,000 129 56.0% 185 2.0 97% 33 1,373 $1,237,320,519 $901,180 $621,000 2,418 63.1% 2,717 1.4 99% 20 443 $302,987,861 $683,946 $560,000 670 68.7% 653 1.2 100% 18 74 $103,987,263 $1,405,233 $1,172,500 121 56.7% 146 2.1 99% 23 41 $51,509,300 $1,256,324 $870,000 75 59.1% 87 1.5 99% 21 75 $131,248,662 $1,749,982 $1,550,000 152 55.9% 162 1.6 99% 21 30 $23,079,500 $769,317 $531,000 53 57.7% 80 1.6 96% 26 78 $73,690,788 $944,754 $620,000 222 52.8% 289 1.8 96% 24 185 $126,362,935 $683,043 $590,000 262 69.3% 244 1.2 100% 19 31 $53,700,480 $1,732,274 $1,100,000 33 63.1% 50 1.6 99% 17 62 $66,169,610 $1,067,252 $915,000 88 67.0% 64 1.1 102% 17 47 $41,240,366 $877,455 $530,000 67 66.8% 64 1.0 100% 18 21 $53,831,500 $2,563,405 $1,890,000 81 48.8% 132 2.7 96% 22 59 $48,273,925 $818,202 $612,500 108 62.1% 132 1.2 99% 18 114 $89,140,664 $781,936 $601,750 253 61.1% 305 1.4 97% 21 113 $72,097,665 $638,032 $464,000 233 60.8% 309 1.4 99% 23 729 $536,687,078 $736,196 $712,000 1,361 58.0% 1,411 1.4 101% 18 84 $75,882,352 $903,361 $849,250 119 65.5% 72 0.8 105% 10 78 $83,656,828 $1,072,523 $937,500 107 63.6% 83 1.0 101% 10 80 $70,606,757 $882,584 $831,000 147 56.0% 132 1.3 102% 12 83 $51,661,376 $622,426 $690,000 170 58.1% 191 1.4 99% 18 66 $45,442,588 $688,524 $600,000 145 56.6% 170 1.5 100% 21 37 $28,046,400 $758,011 $725,000 79 50.1% 65 1.6 101% 17 62 $36,403,300 $587,150 $489,000 130 57.1% 161 1.6 99% 25 45 $32,231,565 $716,257 $623,000 87 59.0% 104 1.4 97% 23 92 $50,933,050 $553,620 $530,000 176 59.1% 195 1.3 98% 25 32 $23,617,685 $738,053 $783,500 106 50.8% 120 1.7 97% 25 70 $38,205,177 $545,788 $562,500 95 59.7% 118 1.5 98% 24 1 1 1 2 8 3 9 4 5
- 5. Toronto Real Estate Board Market Watch, October 2017 SUMMARY OF EXISTING HOME TRANSACTIONS ALL HOME TYPES, YEAR-TO-DATE 2017 ALL TREB AREAS 5 Number of Sales Dollar Volume Average Price Median Price New Listings Avg. SP / LP Avg. DOM TREB Total Halton Region Burlington Halton Hills Milton Oakville Peel Region Brampton Caledon Mississauga City of Toronto Toronto West Toronto Central Toronto East York Region Aurora E. Gwillimbury Georgina King Markham Newmarket Richmond Hill Vaughan Whitchurch-Stouffville Durham Region Ajax Brock Clarington Oshawa Pickering Scugog Uxbridge Whitby Dufferin County Orangeville Simcoe County Adjala-Tosorontio Bradford West GwillimburyEssa Innisfil New Tecumseth 80,198 $66,866,115,030 $833,763 $687,050 157,983 104% 16 7,793 $7,182,362,903 $921,643 $789,500 14,635 102% 17 2,104 $1,694,814,380 $805,520 $730,000 3,566 101% 19 909 $675,760,314 $743,411 $680,000 1,362 102% 17 1,903 $1,427,763,327 $750,270 $701,000 3,670 103% 14 2,877 $3,384,024,882 $1,176,234 $1,040,000 6,037 102% 18 16,347 $11,929,484,083 $729,766 $672,000 33,168 103% 15 7,537 $5,327,719,517 $706,875 $670,000 15,966 103% 14 775 $739,744,490 $954,509 $855,000 1,746 101% 19 8,035 $5,862,020,076 $729,561 $651,000 15,456 104% 15 30,283 $25,536,225,049 $843,253 $640,000 52,534 105% 16 7,893 $5,803,588,791 $735,283 $631,000 13,591 104% 17 15,198 $14,364,024,393 $945,126 $608,000 25,731 104% 16 7,192 $5,368,611,865 $746,470 $720,000 13,212 107% 14 13,181 $14,206,259,837 $1,077,783 $950,000 32,672 105% 16 859 $953,781,766 $1,110,340 $1,000,000 2,253 105% 16 390 $383,030,912 $982,131 $891,500 1,162 106% 18 931 $613,207,051 $658,654 $600,000 2,290 103% 17 344 $550,484,068 $1,600,244 $1,412,500 909 100% 28 3,488 $3,781,142,449 $1,084,043 $970,000 8,054 106% 15 1,254 $1,164,570,021 $928,684 $870,000 3,225 107% 14 2,325 $2,774,531,772 $1,193,347 $1,100,000 6,042 106% 16 3,017 $3,354,607,626 $1,111,902 $986,000 7,235 104% 16 573 $630,904,172 $1,101,054 $925,000 1,502 103% 21 9,723 $6,181,424,795 $635,753 $595,000 18,828 105% 14 1,532 $1,051,491,688 $686,352 $660,000 2,984 106% 13 157 $79,896,140 $508,893 $425,000 301 100% 26 1,753 $1,000,794,332 $570,904 $535,000 3,234 106% 13 2,758 $1,469,599,567 $532,850 $502,000 5,544 107% 13 1,115 $835,794,591 $749,592 $695,000 2,225 104% 14 275 $183,242,101 $666,335 $607,000 505 100% 21 279 $239,710,746 $859,178 $769,900 534 101% 23 1,854 $1,320,895,630 $712,457 $670,000 3,501 106% 13 599 $318,291,956 $531,372 $520,000 894 102% 17 599 $318,291,956 $531,372 $520,000 894 102% 17 2,272 $1,512,066,407 $665,522 $596,000 5,252 101% 20 142 $117,865,615 $830,040 $679,250 270 99% 27 581 $473,633,562 $815,204 $750,000 1,453 103% 16 320 $170,954,932 $534,234 $477,000 592 100% 23 597 $371,089,750 $621,591 $567,000 1,739 101% 21 632 $378,522,548 $598,928 $555,000 1,198 100% 20 1 1 1 2 4 5
- 6. Toronto Real Estate Board Market Watch, October 2017 SUMMARY OF EXISTING HOME TRANSACTIONS ALL HOME TYPES, YEAR-TO-DATE 2017 CITY OF TORONTO MUNICIPAL BREAKDOWN 6 Number of Sales Dollar Volume Average Price Median Price New Listings Avg. SP / LP Avg. DOM TREB Total City of Toronto Total Toronto West Toronto W01 Toronto W02 Toronto W03 Toronto W04 Toronto W05 Toronto W06 Toronto W07 Toronto W08 Toronto W09 Toronto W10 Toronto Central Toronto C01 Toronto C02 Toronto C03 Toronto C04 Toronto C06 Toronto C07 Toronto C08 Toronto C09 Toronto C10 Toronto C11 Toronto C12 Toronto C13 Toronto C14 Toronto C15 Toronto East Toronto E01 Toronto E02 Toronto E03 Toronto E04 Toronto E05 Toronto E06 Toronto E07 Toronto E08 Toronto E09 Toronto E10 Toronto E11 80,198 $66,866,115,030 $833,763 $687,050 157,983 104% 16 30,283 $25,536,225,049 $843,253 $640,000 52,534 105% 16 7,893 $5,803,588,791 $735,283 $631,000 13,591 104% 17 525 $453,198,523 $863,235 $620,000 817 105% 15 731 $695,640,925 $951,629 $900,000 1,161 108% 12 550 $395,749,041 $719,544 $720,000 1,008 107% 14 715 $478,263,314 $668,900 $620,000 1,307 105% 18 915 $500,223,098 $546,692 $549,000 1,750 102% 21 1,470 $925,911,646 $629,872 $533,500 2,341 103% 18 237 $283,017,375 $1,194,166 $1,126,000 411 107% 14 1,583 $1,412,888,752 $892,539 $645,000 2,609 103% 15 404 $287,177,802 $710,836 $702,500 729 105% 16 763 $371,518,315 $486,918 $402,000 1,458 102% 20 15,198 $14,364,024,393 $945,126 $608,000 25,731 104% 16 5,057 $3,354,517,093 $663,341 $550,000 7,797 104% 16 723 $1,063,187,617 $1,470,522 $1,150,000 1,310 103% 22 451 $660,740,071 $1,465,056 $1,024,990 806 105% 16 706 $1,282,807,782 $1,817,008 $1,688,444 1,322 105% 16 330 $300,757,948 $911,388 $560,000 620 106% 16 1,031 $953,236,516 $924,575 $620,000 2,133 103% 16 1,921 $1,237,361,011 $644,123 $560,000 2,870 104% 16 248 $526,506,371 $2,123,010 $1,630,000 425 102% 16 602 $599,546,227 $995,924 $710,500 935 106% 13 390 $361,569,532 $927,101 $505,750 611 105% 13 302 $941,249,488 $3,116,720 $2,762,500 689 100% 21 661 $723,215,785 $1,094,124 $710,000 1,164 110% 13 1,446 $1,300,649,024 $899,481 $550,000 2,667 104% 15 1,330 $1,058,679,928 $796,000 $525,000 2,382 106% 15 7,192 $5,368,611,865 $746,470 $720,000 13,212 107% 14 642 $612,495,018 $954,042 $899,000 1,028 111% 10 589 $641,609,953 $1,089,321 $970,000 962 106% 12 718 $661,601,201 $921,450 $900,000 1,368 109% 13 899 $572,804,327 $637,157 $682,000 1,639 107% 14 748 $546,777,540 $730,986 $611,750 1,427 108% 15 293 $255,087,088 $870,604 $770,000 602 105% 14 695 $421,717,729 $606,788 $445,000 1,363 107% 16 499 $362,996,569 $727,448 $715,000 881 104% 14 961 $544,389,014 $566,482 $525,000 1,758 107% 15 491 $389,963,110 $794,222 $790,000 1,012 105% 16 657 $359,170,316 $546,682 $560,000 1,172 105% 17 1 1 1 2 4 5
- 7. Toronto Real Estate Board Market Watch, October 2017 SUMMARY OF EXISTING HOME TRANSACTIONS DETACHED HOUSES, OCTOBER 2017 ALL TREB AREAS 7 Sales Dollar Volume Average Price Median Price New Listings Active Listings Avg. SP / LP Avg. DOM TREB Total Halton Region Burlington Halton Hills Milton Oakville Peel Region Brampton Caledon Mississauga City of Toronto Toronto West Toronto Central Toronto East York Region Aurora E. Gwillimbury Georgina King Markham Newmarket Richmond Hill Vaughan Whitchurch-Stouffville Durham Region Ajax Brock Clarington Oshawa Pickering Scugog Uxbridge Whitby Dufferin County Orangeville Simcoe County Adjala-Tosorontio Bradford West GwillimburyEssa Innisfil New Tecumseth 3,135 $3,160,729,446 $1,008,207 $840,000 7,849 11,004 97% 24 370 $396,410,782 $1,071,380 $870,750 847 1,252 97% 27 102 $91,336,650 $895,457 $796,500 202 349 97% 29 63 $49,613,600 $787,517 $780,000 89 119 98% 23 81 $71,615,633 $884,144 $805,000 191 243 97% 27 124 $183,844,899 $1,482,620 $1,168,000 365 541 96% 27 641 $567,048,370 $884,631 $815,000 1,505 1,980 97% 24 351 $272,084,622 $775,170 $736,000 858 1,017 97% 24 61 $58,100,424 $952,466 $860,000 123 240 96% 31 229 $236,863,324 $1,034,338 $900,000 524 723 97% 22 812 $1,045,665,529 $1,287,765 $1,000,000 1,758 2,194 99% 19 283 $311,973,166 $1,102,379 $920,000 516 702 99% 20 215 $441,283,320 $2,052,481 $1,755,000 591 799 98% 20 314 $292,409,043 $931,239 $820,000 651 693 99% 18 583 $700,580,471 $1,201,682 $1,088,000 2,014 3,180 96% 28 28 $35,864,874 $1,280,888 $1,155,000 162 234 96% 33 20 $20,267,000 $1,013,350 $772,000 111 209 95% 40 60 $31,484,100 $524,735 $536,500 169 300 96% 27 23 $43,417,000 $1,887,696 $1,520,000 93 184 96% 30 115 $168,845,450 $1,468,221 $1,230,000 378 536 97% 26 67 $61,395,450 $916,350 $830,000 211 309 95% 28 100 $134,589,760 $1,345,898 $1,210,000 374 605 96% 25 133 $170,360,437 $1,280,906 $1,150,000 394 611 96% 27 37 $34,356,400 $928,551 $890,000 122 192 96% 32 570 $359,703,795 $631,059 $590,000 1,245 1,501 98% 23 81 $55,404,900 $684,011 $670,000 166 183 99% 20 11 $4,755,500 $432,318 $390,000 30 53 97% 40 113 $64,675,363 $572,348 $529,000 219 260 98% 22 167 $86,248,586 $516,459 $495,000 392 422 98% 22 63 $49,816,196 $790,733 $738,000 145 172 97% 25 18 $11,064,200 $614,678 $529,000 41 82 97% 34 19 $19,594,600 $1,031,295 $955,000 38 91 97% 29 98 $68,144,450 $695,352 $633,875 214 238 98% 21 28 $15,078,500 $538,518 $542,000 44 66 97% 33 28 $15,078,500 $538,518 $542,000 44 66 97% 33 131 $76,241,999 $582,000 $566,000 436 831 97% 30 9 $5,927,500 $658,611 $640,000 20 60 97% 33 28 $20,737,000 $740,607 $692,500 110 199 97% 30 14 $6,577,900 $469,850 $423,750 37 85 96% 28 46 $24,181,500 $525,685 $520,000 175 310 96% 33 34 $18,818,099 $553,474 $520,000 94 177 97% 25 1 2 3 4 51 1 1
- 8. Toronto Real Estate Board Market Watch, October 2017 SUMMARY OF EXISTING HOME TRANSACTIONS DETACHED HOUSES, OCTOBER 2017 CITY OF TORONTO MUNICIPAL BREAKDOWN 8 Sales Dollar Volume Average Price Median Price New Listings Active Listings Avg. SP / LP Avg. DOM TREB Total City of Toronto Total Toronto West Toronto W01 Toronto W02 Toronto W03 Toronto W04 Toronto W05 Toronto W06 Toronto W07 Toronto W08 Toronto W09 Toronto W10 Toronto Central Toronto C01 Toronto C02 Toronto C03 Toronto C04 Toronto C06 Toronto C07 Toronto C08 Toronto C09 Toronto C10 Toronto C11 Toronto C12 Toronto C13 Toronto C14 Toronto C15 Toronto East Toronto E01 Toronto E02 Toronto E03 Toronto E04 Toronto E05 Toronto E06 Toronto E07 Toronto E08 Toronto E09 Toronto E10 Toronto E11 3,135 $3,160,729,446 $1,008,207 $840,000 7,849 11,004 97% 24 812 $1,045,665,529 $1,287,765 $1,000,000 1,758 2,194 99% 19 283 $311,973,166 $1,102,379 $920,000 516 702 99% 20 15 $25,643,900 $1,709,593 $1,600,000 18 23 98% 32 34 $43,295,288 $1,273,391 $1,256,250 48 48 102% 11 26 $19,273,800 $741,300 $665,000 45 57 103% 20 31 $26,043,398 $840,110 $765,000 69 97 96% 22 15 $13,119,900 $874,660 $805,000 46 85 96% 34 28 $25,824,000 $922,286 $845,000 55 75 98% 18 16 $23,595,600 $1,474,725 $1,328,550 28 27 100% 14 73 $99,036,980 $1,356,671 $1,150,000 109 161 97% 21 18 $17,564,000 $975,778 $940,000 43 61 98% 17 27 $18,576,300 $688,011 $660,800 55 68 97% 25 215 $441,283,320 $2,052,481 $1,755,000 591 799 98% 20 8 $11,151,000 $1,393,875 $1,293,000 15 8 101% 5 18 $41,645,000 $2,313,611 $1,810,500 19 19 101% 14 19 $35,731,100 $1,880,584 $1,577,400 40 53 97% 12 49 $108,806,754 $2,220,546 $1,895,000 107 125 99% 24 11 $13,681,000 $1,243,727 $1,155,000 31 51 94% 30 24 $41,807,688 $1,741,987 $1,630,500 89 135 95% 28 2 $1,628,000 $814,000 $814,000 1 1 94% 70 8 $27,315,600 $3,414,450 $3,225,300 10 21 97% 19 13 $23,493,000 $1,807,154 $1,710,000 27 22 102% 12 13 $24,643,266 $1,895,636 $1,700,000 22 24 101% 15 11 $41,532,000 $3,775,636 $3,250,000 64 108 95% 27 16 $24,322,412 $1,520,151 $1,380,000 46 59 100% 16 14 $28,024,500 $2,001,750 $1,917,500 77 110 96% 20 9 $17,502,000 $1,944,667 $1,915,000 43 63 97% 20 314 $292,409,043 $931,239 $820,000 651 693 99% 18 16 $18,162,500 $1,135,156 $1,056,000 21 17 104% 13 26 $38,860,618 $1,494,639 $1,327,500 43 36 101% 10 43 $44,009,949 $1,023,487 $870,000 87 91 99% 14 43 $33,024,100 $768,002 $765,000 86 91 100% 13 24 $24,464,688 $1,019,362 $1,000,000 53 63 101% 20 34 $26,049,400 $766,159 $725,000 68 57 101% 18 19 $17,055,400 $897,653 $850,000 47 65 100% 22 22 $22,319,565 $1,014,526 $848,000 50 58 96% 19 39 $28,854,950 $739,871 $723,000 92 90 98% 21 23 $20,650,685 $897,856 $855,000 67 80 97% 28 25 $18,957,188 $758,288 $740,000 37 45 98% 20 1 1 1 1 2 3 4 5
- 9. Toronto Real Estate Board Market Watch, October 2017 SUMMARY OF EXISTING HOME TRANSACTIONS SEMI-DETACHED HOUSES, OCTOBER 2017 ALL TREB AREAS 9 Sales Dollar Volume Average Price Median Price New Listings Active Listings Avg. SP / LP Avg. DOM TREB Total Halton Region Burlington Halton Hills Milton Oakville Peel Region Brampton Caledon Mississauga City of Toronto Toronto West Toronto Central Toronto East York Region Aurora E. Gwillimbury Georgina King Markham Newmarket Richmond Hill Vaughan Whitchurch-Stouffville Durham Region Ajax Brock Clarington Oshawa Pickering Scugog Uxbridge Whitby Dufferin County Orangeville Simcoe County Adjala-Tosorontio Bradford West GwillimburyEssa Innisfil New Tecumseth 694 $530,419,652 $764,293 $682,500 1,288 1,287 100% 20 33 $21,897,200 $663,552 $641,900 70 83 98% 20 8 $5,473,500 $684,188 $680,000 16 22 100% 27 3 $1,633,700 $544,567 $501,000 3 2 99% 14 16 $10,237,000 $639,813 $626,500 34 34 97% 13 6 $4,553,000 $758,833 $724,500 17 25 97% 32 246 $157,082,074 $638,545 $641,000 440 451 98% 22 139 $83,376,614 $599,832 $592,000 247 256 98% 23 11 $7,190,000 $653,636 $640,000 13 11 96% 21 96 $66,515,460 $692,869 $689,950 180 184 98% 22 284 $269,319,778 $948,309 $838,000 455 394 103% 17 107 $84,849,243 $792,984 $701,000 158 161 101% 21 66 $87,200,493 $1,321,220 $1,183,500 118 116 103% 17 111 $97,270,042 $876,307 $818,000 179 117 105% 12 72 $53,829,000 $747,625 $750,000 211 247 98% 26 3 $2,155,500 $718,500 $675,500 17 19 97% 25 1 $715,000 $715,000 $715,000 6 10 98% 62 3 $1,290,000 $430,000 $480,000 1 2 96% 36 0 - - - 2 1 - - 16 $12,925,500 $807,844 $832,750 45 56 98% 20 10 $6,534,000 $653,400 $667,500 54 58 96% 23 9 $6,509,000 $723,222 $690,000 20 26 95% 38 24 $19,540,500 $814,188 $821,000 57 64 99% 26 6 $4,159,500 $693,250 $695,000 9 11 99% 20 44 $21,072,700 $478,925 $459,500 85 76 98% 20 8 $4,360,500 $545,063 $568,250 25 21 98% 23 0 - - - 0 0 - - 3 $1,177,000 $392,333 $365,000 5 6 97% 14 18 $7,344,800 $408,044 $412,500 30 28 99% 22 4 $2,466,000 $616,500 $627,500 17 16 97% 25 0 - - - 0 0 - - 0 - - - 1 1 - - 11 $5,724,400 $520,400 $542,000 7 4 99% 15 7 $2,776,500 $396,643 $400,000 9 7 98% 31 7 $2,776,500 $396,643 $400,000 9 7 98% 31 8 $4,442,400 $555,300 $567,500 18 29 95% 34 0 - - - 0 0 - - 5 $2,879,900 $575,980 $580,000 13 18 94% 24 1 $387,500 $387,500 $387,500 2 2 97% 49 0 - - - 0 1 - - 2 $1,175,000 $587,500 $587,500 3 8 96% 50 1 1 1 1 2 3 4 5
- 10. Toronto Real Estate Board Market Watch, October 2017 SUMMARY OF EXISTING HOME TRANSACTIONS SEMI-DETACHED HOUSES, OCTOBER 2017 CITY OF TORONTO MUNICIPAL BREAKDOWN 10 Sales Dollar Volume Average Price Median Price New Listings Active Listings Avg. SP / LP Avg. DOM TREB Total City of Toronto Total Toronto West Toronto W01 Toronto W02 Toronto W03 Toronto W04 Toronto W05 Toronto W06 Toronto W07 Toronto W08 Toronto W09 Toronto W10 Toronto Central Toronto C01 Toronto C02 Toronto C03 Toronto C04 Toronto C06 Toronto C07 Toronto C08 Toronto C09 Toronto C10 Toronto C11 Toronto C12 Toronto C13 Toronto C14 Toronto C15 Toronto East Toronto E01 Toronto E02 Toronto E03 Toronto E04 Toronto E05 Toronto E06 Toronto E07 Toronto E08 Toronto E09 Toronto E10 Toronto E11 694 $530,419,652 $764,293 $682,500 1,288 1,287 100% 20 284 $269,319,778 $948,309 $838,000 455 394 103% 17 107 $84,849,243 $792,984 $701,000 158 161 101% 21 7 $8,826,500 $1,260,929 $1,255,500 10 3 105% 11 27 $26,905,318 $996,493 $951,000 32 19 104% 18 22 $15,507,900 $704,905 $700,500 33 30 99% 19 3 $1,924,000 $641,333 $685,000 12 14 98% 46 35 $22,887,625 $653,932 $647,900 58 77 97% 25 5 $3,978,800 $795,760 $810,000 5 6 97% 16 1 $575,000 $575,000 $575,000 2 1 97% 21 1 $726,000 $726,000 $726,000 0 5 97% 31 0 - - - 4 3 - - 6 $3,518,100 $586,350 $581,000 2 3 99% 28 66 $87,200,493 $1,321,220 $1,183,500 118 116 103% 17 8 $10,477,500 $1,309,688 $1,290,000 20 20 107% 12 9 $15,917,175 $1,768,575 $1,325,000 22 17 100% 24 5 $4,367,000 $873,400 $853,000 8 7 108% 33 7 $8,643,800 $1,234,829 $1,265,000 5 2 102% 11 0 - - - 1 1 - - 1 $988,000 $988,000 $988,000 8 8 100% 9 6 $8,494,000 $1,415,667 $1,386,500 8 6 103% 16 3 $8,041,000 $2,680,333 $2,225,000 2 5 104% 14 13 $17,362,018 $1,335,540 $1,410,000 11 4 107% 11 2 $2,457,000 $1,228,500 $1,228,500 3 1 100% 7 1 $1,145,000 $1,145,000 $1,145,000 1 0 100% 12 5 $4,030,000 $806,000 $809,000 6 14 102% 14 0 - - - 0 0 - - 6 $5,278,000 $879,667 $873,500 23 31 97% 28 111 $97,270,042 $876,307 $818,000 179 117 105% 12 29 $28,729,242 $990,664 $978,000 47 25 108% 10 30 $29,209,500 $973,650 $897,500 39 23 103% 7 23 $20,584,800 $894,991 $892,000 40 25 108% 9 8 $4,876,000 $609,500 $600,000 8 6 97% 35 3 $2,161,500 $720,500 $720,000 10 13 100% 18 1 $800,000 $800,000 $800,000 6 3 100% 17 5 $3,405,000 $681,000 $685,000 11 10 105% 11 0 - - - 0 0 - - 4 $2,629,000 $657,250 $659,500 4 2 100% 18 1 $545,000 $545,000 $545,000 4 2 99% 10 7 $4,330,000 $618,571 $575,000 10 8 101% 20 1 1 1 1 2 3 4 5
- 11. Toronto Real Estate Board Market Watch, October 2017 SUMMARY OF EXISTING HOME TRANSACTIONS CONDOMINIUM TOWNHOUSES, OCTOBER 2017 ALL TREB AREAS 11 Sales Dollar Volume Average Price Median Price New Listings Active Listings Avg. SP / LP Avg. DOM TREB Total Halton Region Burlington Halton Hills Milton Oakville Peel Region Brampton Caledon Mississauga City of Toronto Toronto West Toronto Central Toronto East York Region Aurora E. Gwillimbury Georgina King Markham Newmarket Richmond Hill Vaughan Whitchurch-Stouffville Durham Region Ajax Brock Clarington Oshawa Pickering Scugog Uxbridge Whitby Dufferin County Orangeville Simcoe County Adjala-Tosorontio Bradford West GwillimburyEssa Innisfil New Tecumseth 527 $292,604,211 $555,226 $510,000 937 1,109 98% 25 86 $42,095,013 $489,477 $460,000 105 129 98% 28 44 $22,038,436 $500,874 $473,500 40 49 97% 28 7 $3,073,000 $439,000 $445,000 10 8 99% 25 12 $5,353,900 $446,158 $435,000 13 11 100% 21 23 $11,629,677 $505,638 $475,000 42 61 98% 31 151 $77,012,500 $510,017 $502,000 328 379 98% 26 34 $14,685,300 $431,921 $413,500 79 98 98% 29 0 - - - 0 1 - - 117 $62,327,200 $532,711 $530,000 249 280 98% 25 187 $119,106,577 $636,934 $579,000 319 358 99% 22 50 $25,580,900 $511,618 $486,000 96 113 99% 23 78 $62,428,201 $800,362 $686,944 117 123 99% 20 59 $31,097,476 $527,076 $530,000 106 122 99% 22 43 $30,958,683 $719,969 $630,000 100 150 98% 34 7 $6,486,500 $926,643 $1,041,000 13 29 98% 50 0 - - - 0 0 - - 1 $250,000 $250,000 $250,000 0 0 96% 30 0 - - - 0 0 - - 16 $11,584,500 $724,031 $659,000 38 46 98% 27 2 $1,455,000 $727,500 $727,500 8 17 97% 68 9 $5,938,118 $659,791 $618,000 13 17 98% 33 8 $5,244,565 $655,571 $612,783 28 40 98% 28 0 - - - 0 1 - - 54 $21,321,538 $394,843 $399,950 78 83 99% 25 12 $5,753,400 $479,450 $473,750 13 11 100% 17 0 - - - 0 0 - - 4 $1,336,900 $334,225 $318,500 5 2 99% 18 15 $4,467,500 $297,833 $302,000 21 23 97% 31 14 $5,961,788 $425,842 $408,000 26 34 98% 30 0 - - - 0 0 - - 0 - - - 4 6 - - 9 $3,801,950 $422,439 $405,000 9 7 99% 18 4 $1,359,900 $339,975 $331,450 2 4 100% 18 4 $1,359,900 $339,975 $331,450 2 4 100% 18 2 $750,000 $375,000 $375,000 5 6 93% 46 0 - - - 0 0 - - 2 $750,000 $375,000 $375,000 0 0 93% 46 0 - - - 0 0 - - 0 - - - 1 1 - - 0 - - - 4 5 - - 1 1 1 1 2 3 4 5
- 12. Toronto Real Estate Board Market Watch, October 2017 SUMMARY OF EXISTING HOME TRANSACTIONS CONDOMINIUM TOWNHOUSES, OCTOBER 2017 CITY OF TORONTO MUNICIPAL BREAKDOWN 12 Sales Dollar Volume Average Price Median Price New Listings Active Listings Avg. SP / LP Avg. DOM TREB Total City of Toronto Total Toronto West Toronto W01 Toronto W02 Toronto W03 Toronto W04 Toronto W05 Toronto W06 Toronto W07 Toronto W08 Toronto W09 Toronto W10 Toronto Central Toronto C01 Toronto C02 Toronto C03 Toronto C04 Toronto C06 Toronto C07 Toronto C08 Toronto C09 Toronto C10 Toronto C11 Toronto C12 Toronto C13 Toronto C14 Toronto C15 Toronto East Toronto E01 Toronto E02 Toronto E03 Toronto E04 Toronto E05 Toronto E06 Toronto E07 Toronto E08 Toronto E09 Toronto E10 Toronto E11 527 $292,604,211 $555,226 $510,000 937 1,109 98% 25 187 $119,106,577 $636,934 $579,000 319 358 99% 22 50 $25,580,900 $511,618 $486,000 96 113 99% 23 6 $4,027,900 $671,317 $642,500 6 2 100% 8 5 $3,285,000 $657,000 $685,000 11 12 97% 23 1 $470,000 $470,000 $470,000 0 0 94% 83 4 $1,893,700 $473,425 $462,500 13 16 100% 20 11 $4,478,800 $407,164 $470,000 34 46 98% 25 5 $2,789,500 $557,900 $433,000 12 12 98% 18 0 - - - 0 0 - - 4 $2,582,000 $645,500 $682,500 6 6 104% 14 5 $2,603,000 $520,600 $505,000 2 4 98% 25 9 $3,451,000 $383,444 $377,000 12 15 97% 33 78 $62,428,201 $800,362 $686,944 117 123 99% 20 16 $12,364,500 $772,781 $732,500 27 19 102% 13 4 $5,051,000 $1,262,750 $1,010,500 6 5 98% 39 0 - - - 0 0 - - 0 - - - 1 1 - - 1 $769,000 $769,000 $769,000 1 1 99% 22 4 $2,680,000 $670,000 $690,000 10 15 94% 48 4 $3,814,900 $953,725 $842,500 11 14 99% 17 0 - - - 3 3 - - 4 $3,009,500 $752,375 $589,750 2 2 99% 28 5 $3,824,000 $764,800 $659,000 7 8 100% 16 4 $4,800,000 $1,200,000 $1,170,000 9 13 100% 26 3 $2,680,513 $893,504 $725,513 0 2 97% 21 14 $12,242,000 $874,429 $877,000 15 10 97% 14 19 $11,192,788 $589,094 $599,900 25 30 100% 21 59 $31,097,476 $527,076 $530,000 106 122 99% 22 2 $1,208,000 $604,000 $604,000 8 7 106% 5 5 $3,627,400 $725,480 $699,000 11 9 100% 8 0 - - - 1 1 - - 7 $3,847,888 $549,698 $599,000 13 12 99% 14 17 $9,301,800 $547,165 $576,000 27 25 100% 18 0 - - - 0 0 - - 4 $2,161,000 $540,250 $541,500 7 9 97% 21 8 $4,059,000 $507,375 $516,000 3 5 97% 29 4 $1,848,000 $462,000 $462,500 6 11 98% 54 4 $1,513,000 $378,250 $414,000 16 19 97% 14 8 $3,531,388 $441,424 $447,944 14 24 98% 34 1 1 1 1 2 3 4 5
- 13. Toronto Real Estate Board Market Watch, October 2017 SUMMARY OF EXISTING HOME TRANSACTIONS CONDOMINIUM APARTMENT, OCTOBER 2017 ALL TREB AREAS 13 Sales Dollar Volume Average Price Median Price New Listings Active Listings Avg. SP / LP Avg. DOM TREB Total Halton Region Burlington Halton Hills Milton Oakville Peel Region Brampton Caledon Mississauga City of Toronto Toronto West Toronto Central Toronto East York Region Aurora E. Gwillimbury Georgina King Markham Newmarket Richmond Hill Vaughan Whitchurch-Stouffville Durham Region Ajax Brock Clarington Oshawa Pickering Scugog Uxbridge Whitby Dufferin County Orangeville Simcoe County Adjala-Tosorontio Bradford West GwillimburyEssa Innisfil New Tecumseth 2,025 $1,059,157,680 $523,041 $455,000 3,359 3,873 99% 23 61 $29,195,275 $478,611 $423,888 143 197 97% 28 24 $13,272,700 $553,029 $460,000 41 54 96% 29 2 $1,032,900 $516,450 $516,450 5 5 100% 39 9 $3,724,276 $413,808 $423,888 33 32 99% 15 26 $11,165,399 $429,438 $397,000 64 106 98% 31 256 $99,734,365 $389,587 $360,000 440 511 98% 26 38 $13,475,500 $354,618 $357,250 76 78 98% 27 0 - - - 0 0 - - 218 $86,258,865 $395,683 $370,000 364 433 98% 25 1,485 $824,181,063 $555,004 $488,000 2,324 2,549 99% 22 314 $140,293,262 $446,794 $413,000 446 521 99% 26 971 $602,332,709 $620,322 $540,000 1,523 1,620 99% 20 200 $81,555,092 $407,775 $369,400 355 408 100% 24 173 $85,803,377 $495,973 $451,500 361 511 98% 27 4 $2,435,000 $608,750 $620,000 9 13 100% 12 1 $295,000 $295,000 $295,000 1 0 98% 11 0 - - - 2 3 - - 2 $924,000 $462,000 $462,000 0 3 99% 39 57 $28,716,377 $503,796 $456,000 136 201 97% 27 5 $2,081,300 $416,260 $436,300 2 4 98% 59 50 $22,615,950 $452,319 $427,500 96 134 98% 25 54 $28,735,750 $532,144 $488,000 111 147 98% 28 0 - - - 4 6 - - 46 $18,385,600 $399,687 $369,950 78 80 99% 22 6 $2,023,900 $337,317 $348,000 11 11 100% 16 0 - - - 0 0 - - 8 $2,539,800 $317,475 $310,250 11 22 98% 31 3 $907,000 $302,333 $270,000 23 28 106% 20 12 $5,347,400 $445,617 $417,500 15 9 100% 23 1 $550,000 $550,000 $550,000 0 0 98% 6 2 $745,000 $372,500 $372,500 2 0 96% 14 14 $6,272,500 $448,036 $446,000 16 10 99% 21 1 $165,000 $165,000 $165,000 4 8 101% 97 1 $165,000 $165,000 $165,000 4 8 101% 97 3 $1,693,000 $564,333 $525,000 9 17 99% 76 0 - - - 0 0 - - 1 $525,000 $525,000 $525,000 1 3 100% 109 0 - - - 0 0 - - 1 $910,000 $910,000 $910,000 5 10 98% 80 1 $258,000 $258,000 $258,000 3 4 99% 38 1 1 1 1 2 3 4 5
- 14. Toronto Real Estate Board Market Watch, October 2017 SUMMARY OF EXISTING HOME TRANSACTIONS CONDOMINIUM APARTMENT, OCTOBER 2017 CITY OF TORONTO MUNICIPAL BREAKDOWN 14 Sales Dollar Volume Average Price Median Price New Listings Active Listings Avg. SP / LP Avg. DOM TREB Total City of Toronto Total Toronto West Toronto W01 Toronto W02 Toronto W03 Toronto W04 Toronto W05 Toronto W06 Toronto W07 Toronto W08 Toronto W09 Toronto W10 Toronto Central Toronto C01 Toronto C02 Toronto C03 Toronto C04 Toronto C06 Toronto C07 Toronto C08 Toronto C09 Toronto C10 Toronto C11 Toronto C12 Toronto C13 Toronto C14 Toronto C15 Toronto East Toronto E01 Toronto E02 Toronto E03 Toronto E04 Toronto E05 Toronto E06 Toronto E07 Toronto E08 Toronto E09 Toronto E10 Toronto E11 2,025 $1,059,157,680 $523,041 $455,000 3,359 3,873 99% 23 1,485 $824,181,063 $555,004 $488,000 2,324 2,549 99% 22 314 $140,293,262 $446,794 $413,000 446 521 99% 26 33 $18,260,400 $553,345 $470,000 45 37 102% 22 22 $11,851,004 $538,682 $542,250 24 15 103% 11 3 $1,258,000 $419,333 $414,000 6 6 99% 20 34 $12,229,387 $359,688 $379,000 43 39 99% 19 25 $7,476,800 $299,072 $324,000 43 45 98% 32 82 $43,565,544 $531,287 $485,000 101 132 99% 23 0 - - - 15 19 - - 60 $27,869,527 $464,492 $414,500 96 107 98% 26 15 $5,340,500 $356,033 $280,000 16 26 97% 39 40 $12,442,100 $311,053 $310,000 57 95 97% 41 971 $602,332,709 $620,322 $540,000 1,523 1,620 99% 20 396 $250,594,861 $632,815 $552,250 588 594 100% 19 41 $38,674,900 $943,290 $818,000 68 99 97% 26 15 $10,659,200 $710,613 $665,000 21 23 101% 28 16 $12,726,888 $795,431 $622,500 37 31 102% 12 18 $8,629,500 $479,417 $477,500 20 27 100% 24 47 $26,078,100 $554,853 $575,000 112 127 99% 20 166 $104,441,647 $629,167 $552,500 230 215 100% 18 14 $13,590,880 $970,777 $869,440 16 20 99% 16 31 $21,136,092 $681,809 $565,000 44 32 99% 20 26 $9,573,100 $368,196 $331,950 34 30 98% 18 5 $6,354,500 $1,270,900 $910,000 7 11 101% 10 34 $16,141,000 $474,735 $417,500 53 52 99% 15 84 $46,476,164 $553,288 $522,500 157 178 98% 21 78 $37,255,877 $477,639 $440,400 136 181 100% 24 200 $81,555,092 $407,775 $369,400 355 408 100% 24 22 $13,424,693 $610,213 $611,325 32 15 102% 8 13 $8,822,310 $678,639 $701,000 12 15 102% 18 12 $3,854,000 $321,167 $299,500 17 14 101% 13 19 $6,200,388 $326,336 $343,500 52 70 99% 22 20 $7,946,600 $397,330 $362,000 46 59 97% 27 2 $1,197,000 $598,500 $598,500 5 5 102% 1 31 $11,735,400 $378,561 $378,100 59 71 98% 30 14 $5,123,000 $365,929 $320,000 28 33 99% 26 42 $15,728,100 $374,479 $379,250 73 92 99% 28 3 $737,000 $245,667 $250,500 12 12 107% 23 22 $6,786,601 $308,482 $330,501 19 22 97% 31 1 1 1 1 2 3 4 5
- 15. Toronto Real Estate Board Market Watch, October 2017 SUMMARY OF EXISTING HOME TRANSACTIONS LINK, OCTOBER 2017 ALL TREB AREAS 15 Sales Dollar Volume Average Price Median Price New Listings Active Listings Avg. SP / LP Avg. DOM TREB Total Halton Region Burlington Halton Hills Milton Oakville Peel Region Brampton Caledon Mississauga City of Toronto Toronto West Toronto Central Toronto East York Region Aurora E. Gwillimbury Georgina King Markham Newmarket Richmond Hill Vaughan Whitchurch-Stouffville Durham Region Ajax Brock Clarington Oshawa Pickering Scugog Uxbridge Whitby Dufferin County Orangeville Simcoe County Adjala-Tosorontio Bradford West GwillimburyEssa Innisfil New Tecumseth 89 $65,224,448 $732,859 $720,000 169 198 98% 23 10 $7,084,900 $708,490 $674,950 12 9 98% 20 4 $2,650,000 $662,500 $652,500 5 2 99% 29 0 - - - 0 0 - - 1 $705,000 $705,000 $705,000 1 1 97% 23 5 $3,729,900 $745,980 $675,000 6 6 98% 12 14 $9,293,000 $663,786 $602,500 13 19 98% 17 8 $4,761,500 $595,188 $581,750 7 10 99% 15 0 - - - 2 2 - - 6 $4,531,500 $755,250 $775,000 4 7 97% 21 4 $3,232,000 $808,000 $792,500 15 14 98% 8 0 - - - 0 0 - - 1 $869,000 $869,000 $869,000 5 3 97% 1 3 $2,363,000 $787,667 $790,000 10 11 98% 10 37 $33,371,048 $901,920 $883,000 74 100 98% 28 2 $1,500,000 $750,000 $750,000 0 1 95% 49 0 - - - 0 0 - - 0 - - - 0 0 - - 1 $715,000 $715,000 $715,000 1 2 97% 12 22 $20,368,860 $925,857 $924,000 47 59 98% 28 0 - - - 0 0 - - 9 $8,407,188 $934,132 $854,000 17 22 100% 20 3 $2,380,000 $793,333 $799,000 9 16 98% 46 0 - - - 0 0 - - 19 $9,721,000 $511,632 $505,500 35 31 98% 20 2 $1,035,000 $517,500 $517,500 2 2 101% 52 0 - - - 0 0 - - 8 $3,820,500 $477,563 $481,500 11 8 98% 16 2 $825,000 $412,500 $412,500 2 2 97% 15 1 $530,000 $530,000 $530,000 3 4 94% 32 0 - - - 0 0 - - 0 - - - 0 0 - - 6 $3,510,500 $585,083 $577,500 17 15 99% 14 0 - - - 0 0 - - 0 - - - 0 0 - - 5 $2,522,500 $504,500 $510,000 20 25 97% 38 0 - - - 0 0 - - 2 $1,069,000 $534,500 $534,500 12 16 95% 30 3 $1,453,500 $484,500 $480,000 4 5 98% 43 0 - - - 2 1 - - 0 - - - 2 3 - - 1 1 1 1 2 3 4 5
- 16. Toronto Real Estate Board Market Watch, October 2017 SUMMARY OF EXISTING HOME TRANSACTIONS LINK, OCTOBER 2017 CITY OF TORONTO MUNICIPAL BREAKDOWN 16 Sales Dollar Volume Average Price Median Price New Listings Active Listings Avg. SP / LP Avg. DOM TREB Total City of Toronto Total Toronto West Toronto W01 Toronto W02 Toronto W03 Toronto W04 Toronto W05 Toronto W06 Toronto W07 Toronto W08 Toronto W09 Toronto W10 Toronto Central Toronto C01 Toronto C02 Toronto C03 Toronto C04 Toronto C06 Toronto C07 Toronto C08 Toronto C09 Toronto C10 Toronto C11 Toronto C12 Toronto C13 Toronto C14 Toronto C15 Toronto East Toronto E01 Toronto E02 Toronto E03 Toronto E04 Toronto E05 Toronto E06 Toronto E07 Toronto E08 Toronto E09 Toronto E10 Toronto E11 89 $65,224,448 $732,859 $720,000 169 198 98% 23 4 $3,232,000 $808,000 $792,500 15 14 98% 8 0 - - - 0 0 - - 0 - - - 0 0 - - 0 - - - 0 0 - - 0 - - - 0 0 - - 0 - - - 0 0 - - 0 - - - 0 0 - - 0 - - - 0 0 - - 0 - - - 0 0 - - 0 - - - 0 0 - - 0 - - - 0 0 - - 0 - - - 0 0 - - 1 $869,000 $869,000 $869,000 5 3 97% 1 0 - - - 0 0 - - 0 - - - 0 0 - - 0 - - - 0 0 - - 0 - - - 0 0 - - 0 - - - 0 0 - - 0 - - - 0 0 - - 0 - - - 0 0 - - 0 - - - 0 0 - - 0 - - - 0 0 - - 0 - - - 0 0 - - 0 - - - 0 0 - - 0 - - - 0 0 - - 0 - - - 0 0 - - 1 $869,000 $869,000 $869,000 5 3 97% 1 3 $2,363,000 $787,667 $790,000 10 11 98% 10 0 - - - 0 0 - - 0 - - - 0 0 - - 0 - - - 0 0 - - 0 - - - 0 0 - - 2 $1,568,000 $784,000 $784,000 5 5 97% 11 0 - - - 0 0 - - 1 $795,000 $795,000 $795,000 3 4 99% 8 0 - - - 0 0 - - 0 - - - 0 0 - - 0 - - - 0 0 - - 0 - - - 2 2 - - 1 1 1 1 2 3 4 5
- 17. Toronto Real Estate Board Market Watch, October 2017 SUMMARY OF EXISTING HOME TRANSACTIONS ATTACHED/ROW/TOWNHOUSE, OCTOBER 2017 ALL TREB AREAS 17 Sales Dollar Volume Average Price Median Price New Listings Active Listings Avg. SP / LP Avg. DOM TREB Total Halton Region Burlington Halton Hills Milton Oakville Peel Region Brampton Caledon Mississauga City of Toronto Toronto West Toronto Central Toronto East York Region Aurora E. Gwillimbury Georgina King Markham Newmarket Richmond Hill Vaughan Whitchurch-Stouffville Durham Region Ajax Brock Clarington Oshawa Pickering Scugog Uxbridge Whitby Dufferin County Orangeville Simcoe County Adjala-Tosorontio Bradford West GwillimburyEssa Innisfil New Tecumseth 624 $431,958,198 $692,241 $634,000 1,280 1,349 99% 23 118 $80,602,340 $683,071 $625,000 219 246 98% 23 19 $11,553,800 $608,095 $624,900 28 38 98% 29 13 $7,903,500 $607,962 $572,000 15 12 100% 8 40 $23,348,290 $583,707 $582,500 61 47 98% 19 46 $37,796,750 $821,668 $748,000 115 149 98% 28 105 $63,579,570 $605,520 $595,000 232 249 98% 25 77 $44,429,570 $577,007 $570,000 162 174 99% 26 5 $3,088,500 $617,700 $620,000 23 27 100% 31 23 $16,061,500 $698,326 $685,000 47 48 97% 22 97 $91,861,501 $947,026 $939,000 164 154 101% 17 27 $23,250,500 $861,130 $900,000 52 48 100% 18 31 $37,430,576 $1,207,438 $1,188,000 54 49 101% 24 39 $31,180,425 $799,498 $730,000 58 57 102% 11 164 $126,110,988 $768,969 $751,500 438 496 98% 25 12 $8,521,900 $710,158 $714,000 43 46 98% 16 8 $4,747,500 $593,438 $587,500 12 13 97% 19 6 $2,942,000 $490,333 $487,500 11 16 96% 19 3 $2,722,500 $907,500 $857,500 7 5 97% 34 39 $31,671,012 $812,077 $766,000 97 116 98% 23 12 $7,612,000 $634,333 $642,500 28 36 96% 31 31 $27,795,300 $896,623 $840,000 106 118 98% 30 37 $29,826,900 $806,132 $813,000 116 134 98% 22 16 $10,271,876 $641,992 $650,000 18 12 97% 29 112 $56,179,299 $501,601 $505,000 177 141 98% 18 25 $13,941,000 $557,640 $556,000 39 33 99% 15 0 - - - 1 1 - - 22 $9,343,600 $424,709 $419,850 24 14 99% 14 26 $11,976,799 $460,646 $459,250 37 23 99% 21 10 $5,768,500 $576,850 $556,500 29 31 96% 34 0 - - - 0 0 - - 3 $1,645,000 $548,333 $530,000 2 2 95% 14 26 $13,504,400 $519,400 $520,000 45 37 99% 17 14 $6,644,000 $474,571 $496,000 9 14 98% 34 14 $6,644,000 $474,571 $496,000 9 14 98% 34 14 $6,980,500 $498,607 $437,500 41 49 97% 33 0 - - - 0 0 - - 3 $1,710,000 $570,000 $570,000 9 7 98% 26 0 - - - 1 3 - - 6 $3,023,500 $503,917 $396,750 21 22 96% 40 5 $2,247,000 $449,400 $425,000 10 17 97% 30 1 1 1 1 2 3 4 5
- 18. Toronto Real Estate Board Market Watch, October 2017 SUMMARY OF EXISTING HOME TRANSACTIONS ATTACHED/ROW/TOWNHOUSE, OCTOBER 2017 CITY OF TORONTO MUNICIPAL BREAKDOWN 18 Sales Dollar Volume Average Price Median Price New Listings Active Listings Avg. SP / LP Avg. DOM TREB Total City of Toronto Total Toronto West Toronto W01 Toronto W02 Toronto W03 Toronto W04 Toronto W05 Toronto W06 Toronto W07 Toronto W08 Toronto W09 Toronto W10 Toronto Central Toronto C01 Toronto C02 Toronto C03 Toronto C04 Toronto C06 Toronto C07 Toronto C08 Toronto C09 Toronto C10 Toronto C11 Toronto C12 Toronto C13 Toronto C14 Toronto C15 Toronto East Toronto E01 Toronto E02 Toronto E03 Toronto E04 Toronto E05 Toronto E06 Toronto E07 Toronto E08 Toronto E09 Toronto E10 Toronto E11 624 $431,958,198 $692,241 $634,000 1,280 1,349 99% 23 97 $91,861,501 $947,026 $939,000 164 154 101% 17 27 $23,250,500 $861,130 $900,000 52 48 100% 18 2 $1,960,000 $980,000 $980,000 3 4 103% 68 5 $4,053,000 $810,600 $860,000 7 3 100% 14 2 $1,155,000 $577,500 $577,500 2 3 98% 10 1 $655,000 $655,000 $655,000 2 2 99% 4 2 $1,315,000 $657,500 $657,500 4 7 97% 16 6 $5,920,000 $986,667 $985,000 15 15 99% 21 5 $4,703,500 $940,700 $939,000 7 3 99% 12 3 $2,840,000 $946,667 $1,000,000 4 3 101% 12 0 - - - 5 4 - - 1 $649,000 $649,000 $649,000 3 4 100% 2 31 $37,430,576 $1,207,438 $1,188,000 54 49 101% 24 14 $18,165,000 $1,297,500 $1,285,000 19 12 104% 10 2 $2,699,188 $1,349,594 $1,349,594 6 6 96% 21 0 - - - 3 2 - - 0 - - - 1 2 - - 0 - - - 0 0 - - 2 $2,137,000 $1,068,500 $1,068,500 3 4 99% 13 7 $7,984,388 $1,140,627 $1,188,000 12 8 100% 27 1 $1,035,000 $1,035,000 $1,035,000 0 0 100% 35 1 $1,169,000 $1,169,000 $1,169,000 4 4 100% 10 1 $743,000 $743,000 $743,000 1 1 93% 76 0 - - - 0 0 - - 1 $1,100,000 $1,100,000 $1,100,000 2 4 97% 162 2 $2,398,000 $1,199,000 $1,199,000 3 6 94% 40 0 - - - 0 0 - - 39 $31,180,425 $799,498 $730,000 58 57 102% 11 15 $14,357,917 $957,194 $890,000 11 8 104% 9 3 $2,707,000 $902,333 $930,000 2 0 103% 11 2 $2,158,008 $1,079,004 $1,079,004 2 1 118% 5 5 $3,503,000 $700,600 $705,000 10 11 97% 15 0 - - - 4 5 - - 0 - - - 0 0 - - 2 $1,251,500 $625,750 $625,750 3 2 93% 15 1 $730,000 $730,000 $730,000 6 8 94% 23 3 $1,873,000 $624,333 $655,000 1 0 97% 17 0 - - - 6 6 - - 8 $4,600,000 $575,000 $566,000 13 16 99% 10 1 1 1 1 2 3 4 5
- 19. Toronto Real Estate Board Market Watch, October 2017 SUMMARY OF EXISTING HOME TRANSACTIONS CO-OP APARTMENT, OCTOBER 2017 ALL TREB AREAS 19 Sales Dollar Volume Average Price Median Price New Listings Active Listings Avg. SP / LP Average DOM TREB Total Halton Region Burlington Halton Hills Milton Oakville Peel Region Brampton Caledon Mississauga City of Toronto Toronto West Toronto Central Toronto East York Region Aurora E. Gwillimbury Georgina King Markham Newmarket Richmond Hill Vaughan Whitchurch-Stouffville Durham Region Ajax Brock Clarington Oshawa Pickering Scugog Uxbridge Whitby Dufferin County Orangeville Simcoe County Adjala-Tosorontio Bradford West GwillimburyEssa Innisfil New Tecumseth 12 $5,837,000 $486,417 $412,500 11 12 100% 22 0 - - - 0 1 - - 0 - - - 0 1 - - 0 - - - 0 0 - - 0 - - - 0 0 - - 0 - - - 0 0 - - 0 - - - 0 0 - - 0 - - - 0 0 - - 0 - - - 0 0 - - 0 - - - 0 0 - - 12 $5,837,000 $486,417 $412,500 11 10 100% 22 2 $555,000 $277,500 $277,500 3 4 101% 29 7 $4,470,000 $638,571 $575,000 6 4 100% 19 3 $812,000 $270,667 $210,000 2 2 101% 22 0 - - - 0 1 - - 0 - - - 0 0 - - 0 - - - 0 0 - - 0 - - - 0 0 - - 0 - - - 0 0 - - 0 - - - 0 0 - - 0 - - - 0 0 - - 0 - - - 0 1 - - 0 - - - 0 0 - - 0 - - - 0 0 - - 0 - - - 0 0 - - 0 - - - 0 0 - - 0 - - - 0 0 - - 0 - - - 0 0 - - 0 - - - 0 0 - - 0 - - - 0 0 - - 0 - - - 0 0 - - 0 - - - 0 0 - - 0 - - - 0 0 - - 0 - - - 0 0 - - 0 - - - 0 0 - - 0 - - - 0 0 - - 0 - - - 0 0 - - 0 - - - 0 0 - - 0 - - - 0 0 - - 0 - - - 0 0 - - 0 - - - 0 0 - - 1 1 1 1 2 3 4 5
- 20. Toronto Real Estate Board Market Watch, October 2017 SUMMARY OF EXISTING HOME TRANSACTIONS CO-OP APARTMENT, OCTOBER 2017 CITY OF TORONTO MUNICIPAL BREAKDOWN 20 Sales Dollar Volume Average Price Median Price New Listings Active Listings Avg. SP / LP Avg. DOM TREB Total City of Toronto Total Toronto West Toronto W01 Toronto W02 Toronto W03 Toronto W04 Toronto W05 Toronto W06 Toronto W07 Toronto W08 Toronto W09 Toronto W10 Toronto Central Toronto C01 Toronto C02 Toronto C03 Toronto C04 Toronto C06 Toronto C07 Toronto C08 Toronto C09 Toronto C10 Toronto C11 Toronto C12 Toronto C13 Toronto C14 Toronto C15 Toronto East Toronto E01 Toronto E02 Toronto E03 Toronto E04 Toronto E05 Toronto E06 Toronto E07 Toronto E08 Toronto E09 Toronto E10 Toronto E11 12 $5,837,000 $486,417 $412,500 11 12 100% 22 12 $5,837,000 $486,417 $412,500 11 10 100% 22 2 $555,000 $277,500 $277,500 3 4 101% 29 0 - - - 0 0 - - 1 $360,000 $360,000 $360,000 0 1 103% 38 0 - - - 0 0 - - 0 - - - 0 0 - - 0 - - - 2 1 - - 1 $195,000 $195,000 $195,000 0 0 98% 19 0 - - - 1 1 - - 0 - - - 0 0 - - 0 - - - 0 1 - - 0 - - - 0 0 - - 7 $4,470,000 $638,571 $575,000 6 4 100% 19 0 - - - 0 0 - - 0 - - - 0 0 - - 2 $752,000 $376,000 $376,000 2 1 100% 22 0 - - - 0 0 - - 0 - - - 0 0 - - 0 - - - 0 0 - - 0 - - - 0 0 - - 5 $3,718,000 $743,600 $680,000 2 1 100% 18 0 - - - 0 0 - - 0 - - - 0 0 - - 0 - - - 0 0 - - 0 - - - 0 0 - - 0 - - - 1 1 - - 0 - - - 1 1 - - 3 $812,000 $270,667 $210,000 2 2 101% 22 0 - - - 0 0 - - 1 $430,000 $430,000 $430,000 0 0 108% 5 0 - - - 0 0 - - 1 $210,000 $210,000 $210,000 1 1 92% 26 0 - - - 0 0 - - 0 - - - 0 0 - - 0 - - - 0 0 - - 0 - - - 0 0 - - 0 - - - 0 0 - - 1 $172,000 $172,000 $172,000 1 1 98% 35 0 - - - 0 0 - - 1 1 1 1 2 3 4 5
- 21. Toronto Real Estate Board Market Watch, October 2017 SUMMARY OF EXISTING HOME TRANSACTIONS DETACHED CONDOMINIUM, OCTOBER 2017 ALL TREB AREAS 21 Sales Dollar Volume Average Price Median Price New Listings Active Listings Avg. SP / LP Avg. DOM TREB Total Halton Region Burlington Halton Hills Milton Oakville Peel Region Brampton Caledon Mississauga City of Toronto Toronto West Toronto Central Toronto East York Region Aurora E. Gwillimbury Georgina King Markham Newmarket Richmond Hill Vaughan Whitchurch-Stouffville Durham Region Ajax Brock Clarington Oshawa Pickering Scugog Uxbridge Whitby Dufferin County Orangeville Simcoe County Adjala-Tosorontio Bradford West GwillimburyEssa Innisfil New Tecumseth 8 $5,541,500 $692,688 $687,500 5 20 96% 42 2 $1,625,000 $812,500 $812,500 1 2 97% 38 2 $1,625,000 $812,500 $812,500 1 2 97% 38 0 - - - 0 0 - - 0 - - - 0 0 - - 0 - - - 0 0 - - 3 $2,290,000 $763,333 $780,000 1 3 96% 29 3 $2,290,000 $763,333 $780,000 0 0 96% 29 0 - - - 0 1 - - 0 - - - 1 2 - - 0 - - - 0 1 - - 0 - - - 0 0 - - 0 - - - 0 0 - - 0 - - - 0 1 - - 0 - - - 1 1 - - 0 - - - 0 0 - - 0 - - - 0 0 - - 0 - - - 0 0 - - 0 - - - 0 0 - - 0 - - - 1 1 - - 0 - - - 0 0 - - 0 - - - 0 0 - - 0 - - - 0 0 - - 0 - - - 0 0 - - 0 - - - 0 0 - - 0 - - - 0 0 - - 0 - - - 0 0 - - 0 - - - 0 0 - - 0 - - - 0 0 - - 0 - - - 0 0 - - 0 - - - 0 0 - - 0 - - - 0 0 - - 0 - - - 0 0 - - 0 - - - 0 0 - - 0 - - - 0 0 - - 3 $1,626,500 $542,167 $471,500 2 13 97% 57 0 - - - 0 0 - - 0 - - - 0 0 - - 0 - - - 0 0 - - 0 - - - 0 0 - - 3 $1,626,500 $542,167 $471,500 2 13 97% 57 1 1 1 1 2 3 4 5
- 22. Toronto Real Estate Board Market Watch, October 2017 SUMMARY OF EXISTING HOME TRANSACTIONS DETACHED CONDOMINIUM, OCTOBER 2017 CITY OF TORONTO MUNICIPAL BREAKDOWN 22 Sales Dollar Volume Average Price Median Price New Listings Active Listings Avg. SP / LP Avg. DOM TREB Total City of Toronto Total Toronto West Toronto W01 Toronto W02 Toronto W03 Toronto W04 Toronto W05 Toronto W06 Toronto W07 Toronto W08 Toronto W09 Toronto W10 Toronto Central Toronto C01 Toronto C02 Toronto C03 Toronto C04 Toronto C06 Toronto C07 Toronto C08 Toronto C09 Toronto C10 Toronto C11 Toronto C12 Toronto C13 Toronto C14 Toronto C15 Toronto East Toronto E01 Toronto E02 Toronto E03 Toronto E04 Toronto E05 Toronto E06 Toronto E07 Toronto E08 Toronto E09 Toronto E10 Toronto E11 8 $5,541,500 $692,688 $687,500 5 20 96% 42 0 - - - 0 1 - - 0 - - - 0 0 - - 0 - - - 0 0 - - 0 - - - 0 0 - - 0 - - - 0 0 - - 0 - - - 0 0 - - 0 - - - 0 0 - - 0 - - - 0 0 - - 0 - - - 0 0 - - 0 - - - 0 0 - - 0 - - - 0 0 - - 0 - - - 0 0 - - 0 - - - 0 0 - - 0 - - - 0 0 - - 0 - - - 0 0 - - 0 - - - 0 0 - - 0 - - - 0 0 - - 0 - - - 0 0 - - 0 - - - 0 0 - - 0 - - - 0 0 - - 0 - - - 0 0 - - 0 - - - 0 0 - - 0 - - - 0 0 - - 0 - - - 0 0 - - 0 - - - 0 0 - - 0 - - - 0 0 - - 0 - - - 0 0 - - 0 - - - 0 1 - - 0 - - - 0 0 - - 0 - - - 0 0 - - 0 - - - 0 0 - - 0 - - - 0 0 - - 0 - - - 0 0 - - 0 - - - 0 0 - - 0 - - - 0 0 - - 0 - - - 0 0 - - 0 - - - 0 0 - - 0 - - - 0 0 - - 0 - - - 0 1 - - 1 1 1 1 2 3 4 5
- 23. Toronto Real Estate Board Market Watch, October 2017 SUMMARY OF EXISTING HOME TRANSACTIONS CO-OWNERSHIP APARTMENT, OCTOBER 2017 ALL TREB AREAS 23 Sales Dollar Volume Average Price Median Price New Listings Active Listings Avg. SP / LP Avg. DOM TREB Total Halton Region Burlington Halton Hills Milton Oakville Peel Region Brampton Caledon Mississauga City of Toronto Toronto West Toronto Central Toronto East York Region Aurora E. Gwillimbury Georgina King Markham Newmarket Richmond Hill Vaughan Whitchurch-Stouffville Durham Region Ajax Brock Clarington Oshawa Pickering Scugog Uxbridge Whitby Dufferin County Orangeville Simcoe County Adjala-Tosorontio Bradford West GwillimburyEssa Innisfil New Tecumseth 4 $1,306,220 $326,555 $343,110 5 7 97% 21 0 - - - 0 0 - - 0 - - - 0 0 - - 0 - - - 0 0 - - 0 - - - 0 0 - - 0 - - - 0 0 - - 0 - - - 0 0 - - 0 - - - 0 0 - - 0 - - - 0 0 - - 0 - - - 0 0 - - 4 $1,306,220 $326,555 $343,110 5 7 97% 21 0 - - - 1 4 - - 4 $1,306,220 $326,555 $343,110 4 3 97% 21 0 - - - 0 0 - - 0 - - - 0 0 - - 0 - - - 0 0 - - 0 - - - 0 0 - - 0 - - - 0 0 - - 0 - - - 0 0 - - 0 - - - 0 0 - - 0 - - - 0 0 - - 0 - - - 0 0 - - 0 - - - 0 0 - - 0 - - - 0 0 - - 0 - - - 0 0 - - 0 - - - 0 0 - - 0 - - - 0 0 - - 0 - - - 0 0 - - 0 - - - 0 0 - - 0 - - - 0 0 - - 0 - - - 0 0 - - 0 - - - 0 0 - - 0 - - - 0 0 - - 0 - - - 0 0 - - 0 - - - 0 0 - - 0 - - - 0 0 - - 0 - - - 0 0 - - 0 - - - 0 0 - - 0 - - - 0 0 - - 0 - - - 0 0 - - 0 - - - 0 0 - - 1 1 1 1 2 3 4 5
- 24. Toronto Real Estate Board Market Watch, October 2017 SUMMARY OF EXISTING HOME TRANSACTIONS CO-OWNERSHIP APARTMENT, OCTOBER 2017 CITY OF TORONTO MUNICIPAL BREAKDOWN 24 Sales Dollar Volume Average Price Median Price New Listings Active Listings Avg. SP / LP Avg. DOM TREB Total City of Toronto Total Toronto West Toronto W01 Toronto W02 Toronto W03 Toronto W04 Toronto W05 Toronto W06 Toronto W07 Toronto W08 Toronto W09 Toronto W10 Toronto Central Toronto C01 Toronto C02 Toronto C03 Toronto C04 Toronto C06 Toronto C07 Toronto C08 Toronto C09 Toronto C10 Toronto C11 Toronto C12 Toronto C13 Toronto C14 Toronto C15 Toronto East Toronto E01 Toronto E02 Toronto E03 Toronto E04 Toronto E05 Toronto E06 Toronto E07 Toronto E08 Toronto E09 Toronto E10 Toronto E11 4 $1,306,220 $326,555 $343,110 5 7 97% 21 4 $1,306,220 $326,555 $343,110 5 7 97% 21 0 - - - 1 4 - - 0 - - - 0 0 - - 0 - - - 0 0 - - 0 - - - 0 0 - - 0 - - - 0 0 - - 0 - - - 0 3 - - 0 - - - 1 1 - - 0 - - - 0 0 - - 0 - - - 0 0 - - 0 - - - 0 0 - - 0 - - - 0 0 - - 4 $1,306,220 $326,555 $343,110 4 3 97% 21 1 $235,000 $235,000 $235,000 1 0 103% 6 0 - - - 0 0 - - 0 - - - 1 1 - - 3 $1,071,220 $357,073 $383,000 1 1 95% 25 0 - - - 0 0 - - 0 - - - 0 0 - - 0 - - - 0 0 - - 0 - - - 0 0 - - 0 - - - 0 0 - - 0 - - - 0 0 - - 0 - - - 0 0 - - 0 - - - 1 1 - - 0 - - - 0 0 - - 0 - - - 0 0 - - 0 - - - 0 0 - - 0 - - - 0 0 - - 0 - - - 0 0 - - 0 - - - 0 0 - - 0 - - - 0 0 - - 0 - - - 0 0 - - 0 - - - 0 0 - - 0 - - - 0 0 - - 0 - - - 0 0 - - 0 - - - 0 0 - - 0 - - - 0 0 - - 0 - - - 0 0 - - 1 1 1 1 2 3 4 5
- 25. Toronto Real Estate Board Market Watch, October 2017 FOCUS ON THE MLS HOME PRICE INDEX INDEX AND BENCHMARK PRICE, OCTOBER 2017 ALL TREB AREAS 25 Composite Single-Family Detached Single-Family Attached Townhouse Apartment Index Benchmark Yr./Yr. % Chg. Index Benchmark Yr./Yr. % Chg. Index Benchmark Yr./Yr. % Chg. Index Benchmark Yr./Yr. % Chg. Index Benchmark Yr./Yr. % Chg. TREB Total Halton Region Burlington Halton Hills Milton Oakville Peel Region Brampton Caledon Mississauga City of Toronto York Region Aurora East Gwillimbury Georgina King Markham Newmarket Richmond Hill Vaughan Whitchurch-Stouffville Durham Region Ajax Brock Clarington Oshawa Pickering Scugog Uxbridge Whitby Dufferin County Orangeville Simcoe County Adjala-Tosorontio Bradford West GwillimburyEssa Innisfil New Tecumseth 246.0 $747,800 9.72% 248.7 $921,200 5.43% 250.5 $704,600 5.43% 248.1 $550,400 14.17% 232.2 $463,800 23.05% 255.0 $822,200 10.20% 254.6 $939,100 7.25% 258.2 $660,600 8.03% 271.6 $501,000 15.28% 243.9 $451,100 21.65% 254.2 $690,600 10.28% 254.0 $859,900 6.01% 256.3 $614,900 8.60% 278.0 $510,900 14.92% 243.2 $400,300 21.12% 239.4 $708,500 7.40% 239.5 $779,200 7.16% 242.4 $549,200 6.88% 244.3 $392,600 15.62% 231.0 $467,100 20.75% 241.3 $715,300 8.21% 238.3 $852,800 6.77% 248.7 $601,100 6.78% 246.8 $408,700 17.36% 241.2 $491,300 24.39% 264.8 $968,600 10.06% 264.6 $1,118,500 6.48% 271.2 $757,300 6.14% 271.6 $587,700 15.92% 246.0 $472,500 21.78% 234.7 $666,500 9.98% 234.3 $827,300 7.33% 237.6 $608,200 7.41% 237.0 $508,800 13.07% 220.4 $378,800 19.65% 236.6 $600,000 10.15% 231.1 $675,000 8.70% 236.5 $554,700 8.34% 242.6 $443,500 17.65% 216.2 $322,700 20.18% 210.2 $771,900 8.35% 209.8 $797,500 8.03% 239.0 $590,400 10.96% - - - 231.3 $562,300 24.76% 235.2 $698,000 9.96% 242.9 $970,200 5.38% 239.1 $659,400 5.94% 234.9 $528,000 11.43% 221.0 $389,600 19.52% 243.8 $790,300 13.29% 248.0 $1,088,200 3.90% 253.2 $844,100 6.03% 250.6 $604,600 15.54% 236.3 $485,200 24.57% 263.8 $890,600 3.61% 271.8 $1,034,300 1.91% 267.5 $773,900 0.53% 237.7 $608,500 13.03% 211.7 $465,400 20.08% 274.9 $909,700 6.47% 277.5 $1,048,200 5.19% 278.5 $718,200 5.09% 249.8 $683,000 16.46% 241.8 $505,500 13.95% 240.4 $821,400 9.12% 243.5 $867,800 8.71% 256.5 $536,500 11.14% - - - - - - 243.3 $463,600 8.66% 249.5 $470,400 8.48% 250.5 $493,900 6.91% - - - - - - 241.5 $1,010,300 6.06% 243.2 $1,011,700 6.15% 239.0 $559,700 -1.97% - - - 223.5 $611,300 23.41% 267.0 $925,200 2.93% 290.4 $1,194,700 0.52% 274.8 $821,800 0.99% 229.0 $604,400 13.37% 200.3 $479,400 19.65% 243.5 $717,500 2.79% 245.9 $828,800 1.74% 242.9 $572,100 -1.06% 244.2 $507,000 16.29% 256.6 $432,200 15.38% 286.5 $1,029,300 2.50% 310.5 $1,319,500 1.37% 284.4 $864,300 -0.46% 225.9 $572,000 5.81% 216.0 $439,600 18.29% 254.7 $921,200 5.25% 250.2 $1,040,100 3.09% 260.2 $788,200 -0.31% 261.6 $711,300 14.04% 216.5 $499,600 24.14% 264.2 $910,500 -1.53% 264.2 $947,800 -2.76% 235.1 $645,800 2.17% 224.9 $403,700 17.63% 244.8 $543,900 12.92% 232.4 $542,800 8.09% 229.1 $595,400 7.61% 236.2 $471,700 5.68% 235.3 $373,200 11.20% 227.1 $387,200 12.48% 236.8 $583,400 6.52% 236.9 $635,500 6.00% 241.1 $520,300 6.87% 222.2 $406,200 3.35% 210.7 $341,600 17.06% 199.9 $363,600 22.49% 201.0 $366,800 22.56% - - - - - - - - - 222.1 $468,800 5.61% 215.4 $518,700 3.91% 216.0 $412,600 -1.59% 264.0 $413,600 20.82% 204.3 $302,900 15.29% 232.7 $443,100 8.33% 226.0 $482,300 7.06% 243.8 $408,100 8.02% 251.4 $312,200 21.57% 216.5 $253,900 10.80% 240.3 $644,400 7.66% 236.5 $736,600 6.97% 245.2 $572,200 8.26% 229.1 $409,100 4.66% 263.7 $490,100 12.31% 234.5 $612,300 23.16% 241.7 $626,100 23.51% 227.4 $475,900 22.00% - - - - - - 232.6 $710,900 19.04% 231.3 $714,300 19.17% 230.9 $566,600 21.98% - - - - - - 233.6 $608,300 7.45% 234.5 $674,400 6.98% 237.4 $523,000 6.51% 207.5 $377,800 2.57% 212.8 $385,800 12.18% 248.5 $569,600 18.90% 259.6 $591,600 18.65% 240.2 $450,100 18.44% - - - - - - 248.5 $569,600 18.90% 259.6 $591,600 18.65% 240.2 $450,100 18.44% - - - - - - 247.8 $556,300 11.12% 242.5 $563,800 10.63% 252.5 $473,100 12.98% - - - - - - 227.8 $685,500 7.76% 227.8 $687,100 7.76% - - - - - - - - - 258.9 $631,000 9.80% 243.4 $665,800 9.69% 264.8 $550,400 12.39% - - - - - - 248.5 $474,700 12.29% 247.0 $492,500 10.17% 253.3 $394,400 15.61% - - - - - - 259.0 $501,400 12.71% 258.6 $499,800 12.53% 264.9 $405,000 18.68% - - - - - - 223.6 $531,300 10.47% 217.3 $550,700 8.16% 227.2 $411,700 8.97% - - - - - -
- 26. Toronto Real Estate Board Market Watch, October 2017 FOCUS ON THE MLS HOME PRICE INDEX INDEX AND BENCHMARK PRICE, OCTOBER 2017 CITY OF TORONTO 26 Composite Single-Family Detached Single-Family Attached Townhouse Apartment Index Benchmark Yr./Yr. % Chg. Index Benchmark Yr./Yr. % Chg. Index Benchmark Yr./Yr. % Chg. Index Benchmark Yr./Yr. % Chg. Index Benchmark Yr./Yr. % Chg. TREB Total City of Toronto Toronto W01 Toronto W02 Toronto W03 Toronto W04 Toronto W05 Toronto W06 Toronto W07 Toronto W08 Toronto W09 Toronto W10 Toronto C01 Toronto C02 Toronto C03 Toronto C04 Toronto C06 Toronto C07 Toronto C08 Toronto C09 Toronto C10 Toronto C11 Toronto C12 Toronto C13 Toronto C14 Toronto C15 Toronto E01 Toronto E02 Toronto E03 Toronto E04 Toronto E05 Toronto E06 Toronto E07 Toronto E08 Toronto E09 Toronto E10 Toronto E11 246.0 $747,800 9.72% 248.7 $921,200 5.43% 250.5 $704,600 5.43% 248.1 $550,400 14.17% 232.2 $463,800 23.05% 243.8 $790,300 13.29% 248.0 $1,088,200 3.90% 253.2 $844,100 6.03% 250.6 $604,600 15.54% 236.3 $485,200 24.57% 225.5 $908,800 14.99% 219.9 $1,147,500 3.68% 240.2 $926,200 3.05% 233.1 $493,400 12.23% 223.4 $505,100 26.57% 252.4 $897,700 6.72% 244.6 $1,034,700 2.43% 278.6 $853,900 1.53% 239.3 $563,900 6.31% 243.4 $521,900 28.24% 265.8 $686,100 10.43% 269.2 $731,800 9.21% 263.4 $674,700 6.94% 233.1 $475,500 11.26% 244.2 $420,400 28.66% 239.1 $612,300 14.13% 243.7 $767,500 8.17% 226.9 $656,100 3.70% 215.7 $509,700 15.10% 235.6 $345,100 33.71% 216.1 $512,900 13.50% 230.9 $765,800 7.05% 211.6 $617,900 5.96% 215.3 $391,000 21.50% 208.9 $274,500 27.61% 194.6 $569,900 7.75% 257.0 $820,600 1.94% 211.8 $641,800 1.92% 275.5 $819,400 13.94% 160.5 $406,700 21.68% 220.0 $943,100 3.04% 232.6 $1,008,100 1.22% 208.2 $853,700 -0.72% 0.0 $0 -100.00% 141.5 $573,800 16.08% 202.5 $807,300 11.20% 203.8 $1,065,300 0.79% 202.9 $751,700 0.15% 223.2 $536,800 16.98% 200.1 $416,700 22.76% 224.6 $565,400 10.59% 220.0 $820,400 1.76% 193.9 $557,600 3.08% 246.2 $640,600 17.29% 227.3 $291,500 25.44% 224.2 $516,400 14.21% 228.5 $685,500 4.67% 233.0 $596,300 7.47% 208.6 $444,200 17.99% 222.9 $309,600 30.89% 261.3 $647,300 18.45% 270.2 $1,023,300 8.25% 261.4 $915,000 5.11% 253.1 $719,600 13.50% 260.7 $542,700 20.47% 243.8 $1,166,100 7.59% 219.3 $1,752,100 4.33% 255.1 $1,337,900 7.68% 247.1 $1,103,400 2.79% 239.1 $681,200 10.18% 274.8 $1,436,800 12.39% 256.6 $1,577,000 6.78% 272.2 $1,009,400 8.92% - - - 306.9 $807,300 25.62% 245.7 $1,516,300 10.58% 250.2 $1,762,800 7.61% 259.2 $1,213,500 9.41% 295.2 $1,085,200 38.46% 219.1 $506,700 26.79% 261.3 $1,017,600 9.10% 265.2 $1,132,700 -2.89% 203.6 $753,200 -2.02% 235.1 $630,500 17.14% 260.0 $575,000 27.39% 252.0 $871,800 12.25% 300.2 $1,373,300 0.67% 215.2 $770,100 -0.92% 232.9 $656,400 16.92% 225.4 $550,400 28.43% 238.8 $624,700 16.83% 257.1 $1,500,000 2.15% 255.6 $1,219,300 -0.12% 243.7 $636,400 7.88% 237.3 $513,000 19.79% 161.9 $1,146,000 14.34% 129.5 $1,626,700 -0.38% 143.4 $1,166,900 -0.55% 248.0 $1,358,300 15.24% 182.4 $604,300 27.37% 255.3 $996,700 13.77% 255.8 $1,579,300 1.75% 245.4 $1,212,300 0.20% 239.1 $697,900 9.23% 258.4 $617,100 22.81% 240.4 $850,700 16.76% 196.7 $1,339,900 0.56% 219.3 $971,000 -1.62% 219.3 $379,900 17.21% 275.4 $399,900 27.86% 215.4 $1,837,700 10.12% 200.8 $2,152,100 1.93% 260.0 $1,088,300 3.92% 219.1 $876,600 17.23% 252.3 $791,000 31.27% 234.7 $849,800 11.39% 247.2 $1,318,300 0.37% 220.7 $704,200 -3.37% 243.1 $702,800 19.46% 222.2 $447,400 28.22% 255.1 $834,100 17.83% 301.5 $1,631,100 0.33% 241.2 $1,174,500 -2.47% 295.1 $794,700 14.96% 236.8 $596,300 29.75% 246.4 $799,700 11.59% 311.5 $1,462,600 1.76% 262.5 $853,400 -0.94% 279.2 $668,300 19.73% 207.0 $481,300 27.70% 302.9 $946,000 17.72% 300.1 $1,058,900 14.54% 308.9 $974,400 16.17% 354.4 $647,900 23.36% 270.3 $641,200 25.02% 260.8 $978,900 13.84% 225.6 $1,027,900 13.31% 272.9 $913,900 14.18% 286.1 $859,000 14.62% 249.3 $681,600 10.26% 247.2 $760,500 6.41% 256.7 $865,400 4.60% 237.0 $776,100 5.90% - - - 215.7 $315,100 19.83% 244.8 $604,600 12.14% 239.6 $706,400 4.45% 248.6 $599,100 8.04% 242.7 $526,100 20.15% 257.0 $394,300 27.61% 248.3 $651,500 10.55% 258.5 $910,400 0.86% 250.8 $691,100 -1.61% 254.1 $552,600 10.00% 233.2 $458,000 30.86% 254.5 $709,700 8.25% 256.9 $733,700 7.62% 264.9 $630,100 11.26% 250.3 $619,000 14.14% 230.6 $487,700 16.29% 259.7 $636,600 14.20% 271.0 $888,300 2.69% 262.1 $685,400 4.34% 263.5 $570,800 13.48% 250.1 $428,300 30.53% 250.8 $605,200 17.64% 246.0 $766,800 6.63% 227.4 $589,400 10.66% 253.3 $517,000 26.21% 259.0 $413,200 39.32% 239.7 $573,100 15.46% 243.4 $691,100 3.62% 230.0 $562,600 5.17% 279.7 $519,800 24.37% 231.6 $434,400 29.39% 255.4 $715,900 9.15% 244.3 $782,800 4.13% 236.9 $614,300 5.71% 313.7 $547,700 27.16% 243.3 $392,200 41.87% 254.0 $555,600 17.70% 260.3 $724,000 7.87% 252.5 $571,900 7.91% 197.1 $386,800 7.53% 288.2 $430,100 52.57%
- 27. Toronto Real Estate Board Market Watch, October 2017 HISTORIC ANNUAL STATISTICS 27 Year Sales Average Price 2005 2006 2007 2008 2009 2010 2011 2012 2013 2014 2015 84,145 $335,907 83,084 $351,941 93,193 $376,236 74,552 $379,347 87,308 $395,460 85,545 $431,276 89,096 $465,014 85,496 $497,130 87,049 $522,958 92,782 $566,624 101,213 $622,121 2016 MONTHLY STATISTICS NOTES 1 - Sales, dollar volume, average sale prices and median sale prices are based on firm transactions entered into the TREB MLS® system between the first and last day of the month/period being reported. 2 - New listings entered into the TREB MLS® system between the first and last day of the month/period being reported. 3 - Active listings at the end of the last day of the month/period being reported. 4 - Ratio of the average selling price to the average listing price for firm transactions entered into the TREB MLS® system between the first and last day of the month/period being reported. 5 - Average number of days on the market for firm transactions entered into the TREB MLS® system between the first and last day of the month/period being reported. 6 - Due to past changes to TREB's service area, caution should be exercised when making historical comparisons. 7 - Past monthly and year-to-date figures are revised on a monthly basis. 8 - SNLR = Sales-to-New Listings Ratio. Calculated using a 12-month moving average (sales/new listings). 9 - Mos. Inv. = Months of Inventory. Calculated using a 12-month moving average (active listings/sales). 2017 MONTHLY STATISTICS *For historic annual sales and average price data over a longer time frame go to: January February March April May June July August September October November December Year to Date 5,155 $768,351 7,955 $876,348 11,961 $915,838 11,471 $918,233 10,076 $863,034 7,903 $792,477 5,876 $745,881 6,323 $731,532 6,360 $774,623 7,118 $780,104 - - - - 80,198 $816,642 January February March April May June July August September October November December Annual 4,640 $630,193 7,582 $685,628 10,260 $688,011 12,016 $739,762 12,789 $752,068 12,725 $747,018 9,929 $710,471 9,748 $710,978 9,829 $756,054 9,715 $762,691 8,503 $777,091 5,305 $730,124 113,041 $729,833 1,6,7 1,7 1,7 http://www.torontorealestateboard.com/market_news/market_watch/historic_stats/p df/TREB_historic_statistics.pdf Copyright® 2017 Toronto Real Estate Board $833,76380,198