Download to read offline
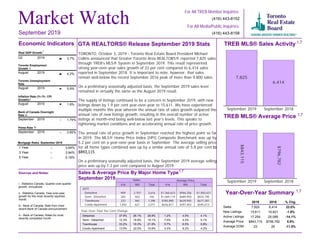
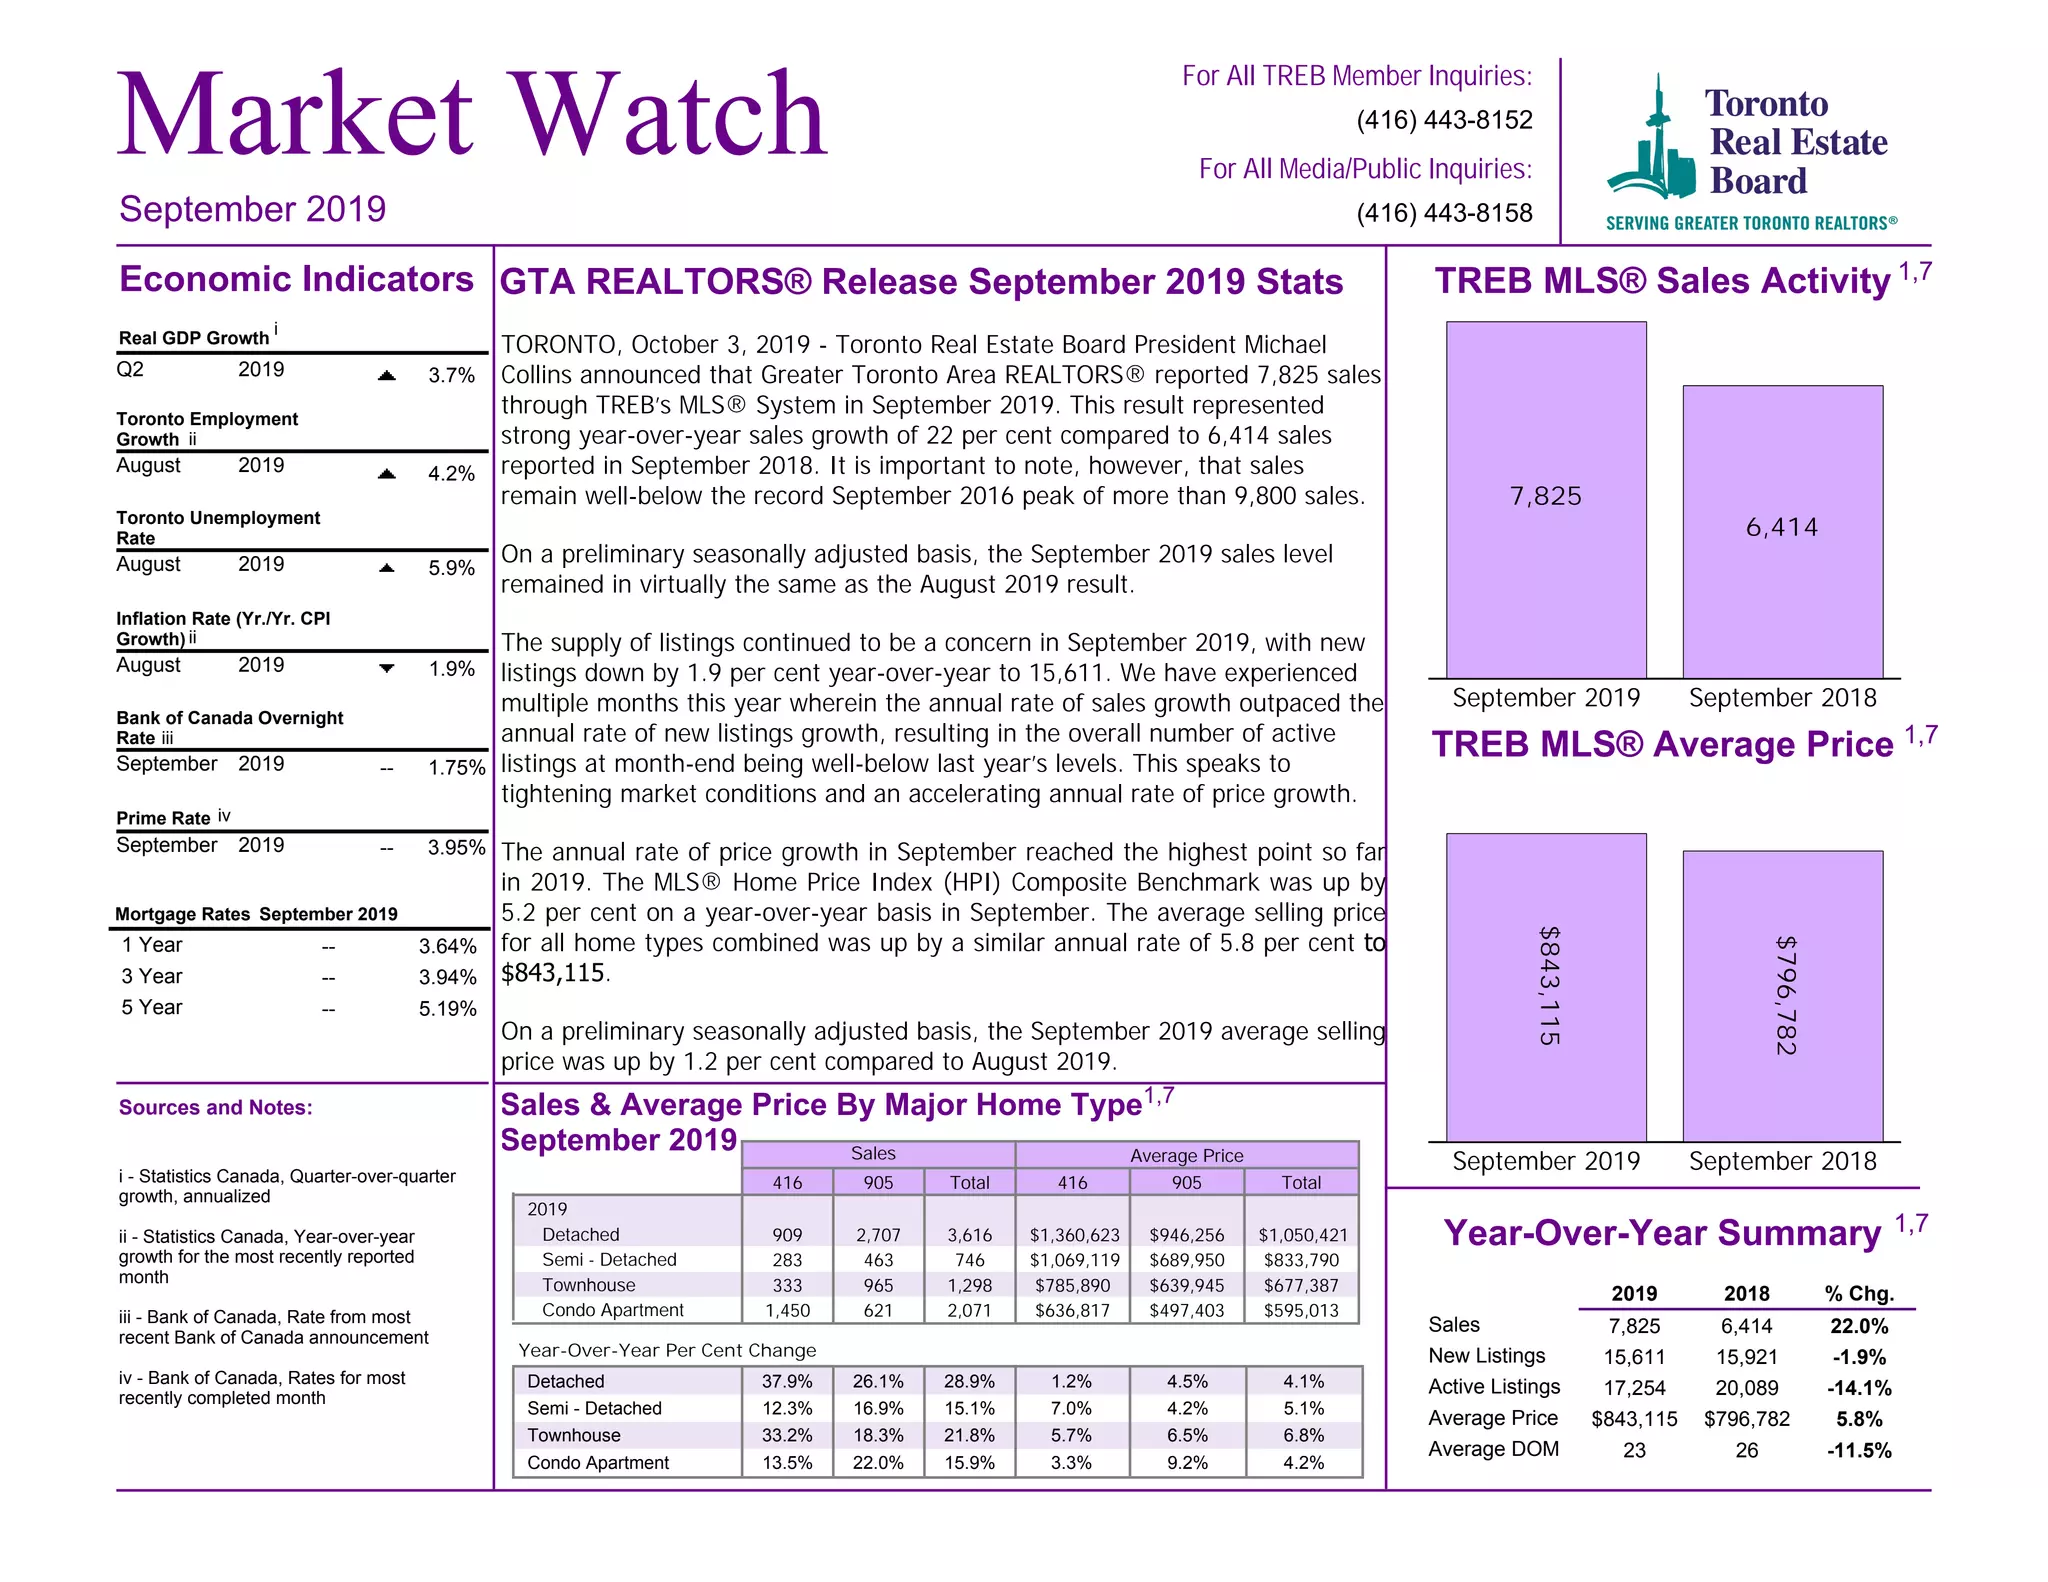
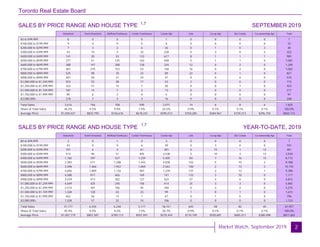
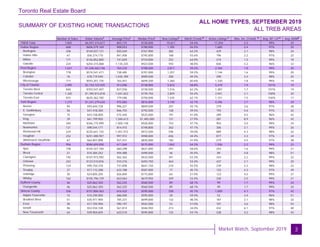
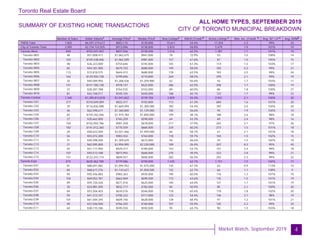
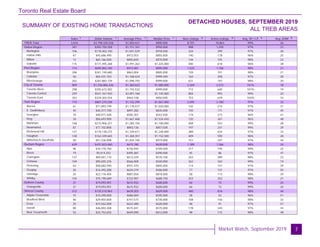
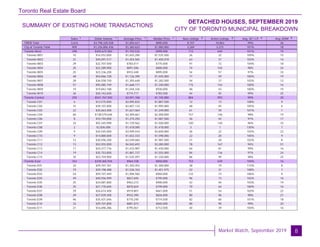


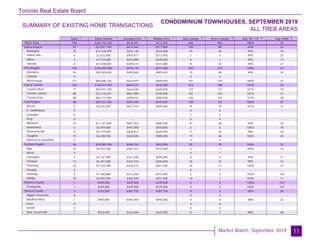

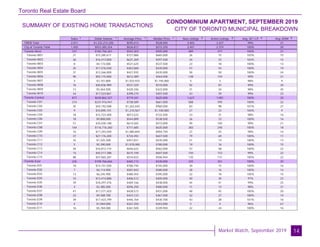
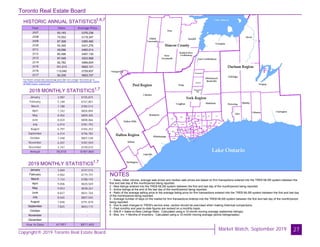

This document summarizes real estate statistics for the Greater Toronto Area (GTA) in September 2019. It reports that home sales were up 22% year-over-year with 7,825 total sales. However, new listings declined by 1.9% compared to the previous year, contributing to tight market conditions. The average home price rose 5.8% year-over-year to $843,115, with the MLS Home Price Index up 5.2%. Housing supply remained constrained as active listings declined 14.1% from the previous year.


