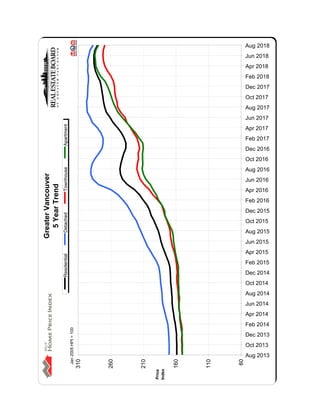
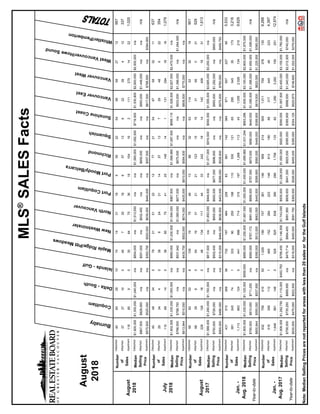
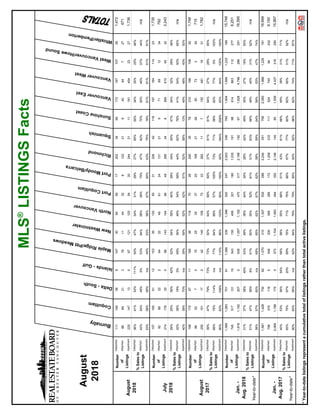
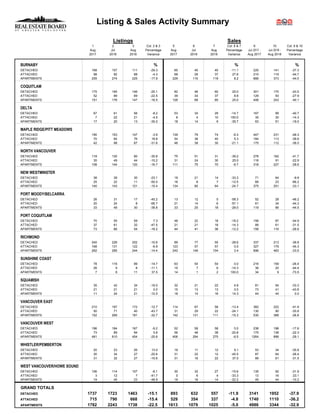
The Real Estate Board of Greater Vancouver (REBGV) reports that residential home sales in the
region totalled 1,929 in August 2018, a 36.6 per cent decrease from the 3,043 sales record
One FNG by Group 108 Sector 142 Noida Construction Update
Rebgv stats-pkg-august-2018
1. News Release
FOR IMMEDIATE RELEASE:
Home buyer demand stays below historical averages in August
VANCOUVER, BC – September 5, 2018 – The Metro Vancouver* housing market continues
to experience reduced demand across all housing types.
The Real Estate Board of Greater Vancouver (REBGV) reports that residential home sales in the
region totalled 1,929 in August 2018, a 36.6 per cent decrease from the 3,043 sales recorded in
August 2017, and a 6.8 per cent decline compared to July 2018 when 2,070 homes sold.
Last month’s sales were 25.2 per cent below the 10-year August sales average.
“Home buyers have been less active in recent months and we’re beginning to see prices edge
down for all housing types as a result,” Phil Moore, REBGV president said. “Buyers today have
more listings to choose from and face less competition than we’ve seen in our market in recent
years.”
There were 3,881 detached, attached and apartment homes newly listed for sale on the Multiple
Listing Service® (MLS®) in Metro Vancouver in August 2018. This represents an 8.6 per cent
decrease compared to the 4,245 homes listed in August 2017 and an 18.6 per cent decrease
compared to July 2018 when 4,770 homes were listed.
The total number of homes currently listed for sale on the MLS® system in Metro Vancouver is
11,824, a 34.3 per cent increase compared to August 2017 (8,807) and a 2.6 per cent decrease
compared to July 2018 (12,137).
The sales-to-active listings ratio for August 2018 is 16.3 per cent. By housing type, the ratio is
9.2 per cent for detached homes, 19.4 per cent for townhomes, and 26.6 per cent for apartments.
Generally, analysts say that downward pressure on home prices occurs when the ratio dips below
the 12 per cent mark for a sustained period, while home prices often experience upward pressure
when it surpasses 20 per cent over several months.
“With fewer buyers active in the market, benchmark prices across all three housing categories
have declined for two consecutive months across the region,” Moore said.
The MLS® Home Price Index composite benchmark price for all residential properties in Metro
Vancouver is currently $1,083,400. This represents a 4.1 per cent increase over August 2017 and
a 1.9 per cent decrease since May 2018.
2. Sales of detached properties in August 2018 reached 567, a 37.1 per cent decrease from the 901
detached sales recorded in August 2017. The benchmark price for detached properties is
$1,561,000. This represents a 3.1 per cent decrease from August 2017 and a 2.8 per cent
decrease since May 2018.
Sales of apartment properties reached 1,025 in August 2018, 36.5 per cent decrease compared to
the 1,613 sales in August 2017. The benchmark price of an apartment property is $695,500. This
represents a 10.3 per cent increase from August 2017 and a 1.6 per cent decrease since May
2018.
Attached property sales in August 2018 totalled 337, a 36.3 per cent decrease compared to the
529 sales in August 2017. The benchmark price of an attached unit is $846,100. This represents a
7.9 per cent increase from August 2017 and a 0.8 per cent decrease since May 2018.
-30-
*Editor’s Note: Areas covered by the Real Estate Board of Greater Vancouver include: Whistler, Sunshine Coast,
Squamish, West Vancouver, North Vancouver, Vancouver, Burnaby, New Westminster, Richmond, Port Moody,
Port Coquitlam, Coquitlam, Pitt Meadows, Maple Ridge, and South Delta.
The real estate industry is a key economic driver in British Columbia. In 2017, 35,993 homes changed ownership in
the Board’s area, generating $2.4 billion in economic spin-off activity and an estimated 17,600 jobs. The total dollar
value of residential sales transacted through the MLS® system in Greater Vancouver totalled $37 billion in 2017.
The Real Estate Board of Greater Vancouver is an association representing more than 14,000 REALTORS® and
their companies. The Board provides a variety of member services, including the Multiple Listing Service®. For
more information on real estate, statistics, and buying or selling a home, contact a local REALTOR® or visit
www.rebgv.org.
For more information please contact:
Craig Munn
Manager, Communication
Real Estate Board of Greater Vancouver
604.730.3146
cmunn@rebgv.org
3. Property Type Area
Benchmark
Price
Price
Index
1 Month
Change %
3 Month
Change %
6 Month
Change %
1 Year
Change %
3 Year
Change %
5 Year
Change %
10 Year
Change %
Residential / Composite Lower Mainland $1,015,900 278.9 -1.4% -1.8% 1.1% 6.3% 56.7% 80.8% 93.1%
Greater Vancouver $1,083,400 280.5 -1.4% -1.9% 0.1% 4.1% 49.9% 76.7% 92.9%
Bowen Island $984,800 213.5 -3.3% -6.2% 1.0% 4.6% 56.3% 76.7% 54.8%
Burnaby East $1,014,600 281.4 -2.9% -2.6% 0.4% 2.9% 46.5% 73.5% 95.3%
Burnaby North $934,300 282.1 -2.1% -1.2% 0.3% 6.5% 54.2% 78.9% 94.0%
Burnaby South $1,037,300 293.0 -2.2% -1.7% 0.0% 5.3% 55.6% 80.8% 102.6%
Coquitlam $978,700 290.3 -0.2% -0.5% 3.5% 8.6% 62.5% 95.5% 104.4%
Ladner $891,400 250.2 0.4% 1.6% 3.0% 5.6% 38.3% 67.1% 79.2%
Maple Ridge $800,500 254.9 -1.0% -1.5% 2.7% 11.6% 72.8% 89.1% 81.4%
New Westminster $699,100 307.2 -2.6% -2.2% 3.3% 11.1% 71.9% 90.5% 103.8%
North Vancouver $1,093,600 249.3 -1.5% -2.8% 0.0% 1.7% 45.9% 69.5% 79.0%
Pitt Meadows $792,800 288.2 -1.9% -0.7% 5.6% 16.0% 77.4% 100.6% 101.1%
Port Coquitlam $790,800 270.7 -1.6% -3.0% 1.7% 6.9% 64.4% 90.0% 85.9%
Port Moody $968,100 267.6 -0.4% -1.7% 2.1% 9.9% 61.1% 88.3% 91.1%
Richmond $1,029,800 296.7 -1.7% -0.9% -0.4% 4.3% 50.4% 75.9% 101.3%
Squamish $795,900 249.8 -2.9% -3.0% 3.7% 8.4% 69.5% 100.0% 83.3%
Sunshine Coast $621,900 217.9 -0.6% -2.1% 5.6% 8.0% 63.8% 85.0% 57.8%
Tsawwassen $1,006,200 252.7 -1.1% -1.4% 1.0% 1.9% 36.2% 68.4% 80.4%
Vancouver East $1,100,000 322.1 -0.1% -1.3% -0.6% 2.0% 48.7% 81.1% 111.9%
Vancouver West $1,336,900 281.9 -1.5% -3.0% -2.8% -0.7% 38.4% 66.9% 91.2%
West Vancouver $2,421,300 260.3 -3.0% -6.5% -8.9% -8.8% 20.1% 52.8% 78.4%
Whistler $970,600 210.2 -0.6% -1.5% 3.5% 11.4% 78.7% 103.9% 55.4%
Single Family Detached Lower Mainland $1,315,900 279.3 -1.4% -2.3% -0.9% -0.7% 42.7% 73.4% 98.4%
Greater Vancouver $1,561,000 287.4 -1.5% -2.8% -2.4% -3.1% 34.2% 68.5% 100.6%
Bowen Island $984,800 213.5 -3.3% -6.2% 1.0% 4.6% 56.3% 76.7% 54.8%
Burnaby East $1,269,200 283.8 -4.2% -3.5% -0.9% -3.9% 34.2% 68.5% 104.5%
Burnaby North $1,501,200 290.3 -3.5% -4.7% -2.1% -5.8% 25.8% 61.5% 104.1%
Burnaby South $1,621,000 310.3 -3.8% -3.0% -3.7% -5.6% 32.8% 66.8% 119.0%
Coquitlam $1,305,300 289.7 -0.3% -1.1% 2.2% 2.0% 46.9% 83.8% 107.7%
Ladner $1,010,200 243.5 -0.7% 0.8% 0.6% 1.0% 31.5% 63.4% 78.8%
Maple Ridge $870,200 247.9 -0.6% -0.6% 2.7% 8.3% 67.6% 88.2% 82.7%
New Westminster $1,132,100 282.4 -3.0% -3.8% -2.4% -3.8% 36.7% 68.6% 102.3%
North Vancouver $1,649,700 258.0 -1.5% -3.4% -2.2% -3.6% 37.1% 71.3% 88.3%
Pitt Meadows $941,500 265.3 -1.5% -0.9% 3.2% 7.4% 61.9% 86.8% 96.2%
Port Coquitlam $1,008,100 268.8 -0.8% -3.9% 2.2% 0.5% 47.3% 81.6% 91.3%
Port Moody $1,529,200 282.4 0.0% 0.0% 3.1% 2.5% 49.1% 80.9% 99.4%
Richmond $1,669,900 323.5 -1.9% -3.2% -5.0% -3.8% 34.7% 69.5% 115.5%
Squamish $1,000,500 252.9 -3.7% -5.7% 1.5% 5.1% 62.4% 97.7% 86.6%
Sunshine Coast $617,700 216.4 -0.8% -2.2% 5.6% 8.0% 63.7% 84.5% 56.7%
Tsawwassen $1,250,200 269.2 -1.2% -1.1% 0.1% -0.5% 37.0% 75.3% 94.1%
Vancouver East $1,529,200 338.0 -0.4% -0.9% -2.0% -2.3% 34.6% 80.2% 133.7%
Vancouver West $3,278,500 336.6 -2.3% -4.4% -6.3% -10.3% 21.6% 57.5% 114.5%
West Vancouver $2,832,600 267.4 -2.8% -6.2% -9.8% -11.2% 16.6% 51.5% 82.8%
Whistler $1,783,200 227.8 0.8% -0.8% 3.0% 8.3% 61.2% 90.3% 67.3%
HOW TO READ THE TABLE:
• Benchmark Price: Estimated sale price of a benchmark property. Benchmarks represent a typical property within each market.
• Price Index: Index numbers estimate the percentage change in price on typical and constant quality properties over time. All figures are based on past sales.
• x Month/Year Change %: Percentage change of index over a period of x month(s)/year(s) *
In January 2005, the indexes are set to 100.
Townhome properties are similar to Attached properties, a category that was used in the previous MLSLink HPI, but do not included duplexes.
The above info is deemed reliable, but is not guaranteed. All dollar amounts in CDN.
August 2018*
* MLS®, Multiple Listing Service®, and all related graphics are trademarks of The Canadian Real Estate Association 1 of 15
4. Property Type Area
Benchmark
Price
Price
Index
1 Month
Change %
3 Month
Change %
6 Month
Change %
1 Year
Change %
3 Year
Change %
5 Year
Change %
10 Year
Change %
August 2018*
Townhouse Lower Mainland $712,500 257.0 -1.2% -1.1% 3.3% 9.2% 64.0% 78.6% 80.0%
Greater Vancouver $846,100 269.3 -0.8% -0.8% 3.7% 7.9% 59.4% 79.1% 86.8%
Burnaby East $712,800 263.3 -2.8% -1.6% 4.1% 13.2% 59.6% 70.5% 81.7%
Burnaby North $766,200 286.0 -2.1% -0.1% 1.9% 9.8% 59.1% 78.6% 92.6%
Burnaby South $841,600 289.9 -0.6% 0.1% 4.2% 8.9% 62.7% 85.6% 99.9%
Coquitlam $690,500 253.4 -2.9% -2.2% 1.4% 7.7% 57.4% 79.0% 82.6%
Ladner $818,200 285.3 2.6% 3.9% 4.5% 11.5% 59.3% 84.5% 93.7%
Maple Ridge $566,300 262.9 -0.2% -2.4% 2.7% 11.4% 77.5% 86.9% 82.7%
New Westminster $741,500 293.2 1.0% 0.9% 4.0% 13.6% 65.7% 83.6% 99.5%
North Vancouver $1,030,100 250.3 -0.3% -0.5% 3.2% 6.4% 54.0% 76.0% 84.2%
Pitt Meadows $667,700 288.9 -1.2% 4.0% 13.7% 18.6% 81.6% 113.1% 101.3%
Port Coquitlam $667,500 252.7 -2.7% -3.2% 2.0% 4.1% 63.0% 81.4% 77.6%
Port Moody $687,700 232.4 -0.3% 0.4% 6.7% 13.0% 50.4% 69.3% 62.9%
Richmond $865,400 284.4 -0.5% 2.3% 5.6% 8.1% 57.4% 76.8% 96.4%
Squamish $709,100 241.8 -0.9% -2.3% 5.1% 10.2% 68.9% 99.0% 75.9%
Tsawwassen $793,900 295.7 4.5% 2.3% 5.0% 10.3% 61.1% 86.6% 100.7%
Vancouver East $894,200 293.5 0.2% -3.4% 2.9% 4.2% 57.5% 72.3% 88.4%
Vancouver West $1,267,800 280.0 -1.7% -2.8% 1.4% 1.1% 52.5% 78.1% 91.6%
Whistler $941,600 235.5 0.6% -1.5% 6.2% 14.8% 77.5% 107.7% 71.3%
Apartment Lower Mainland $682,300 288.3 -1.4% -1.6% 2.3% 14.1% 76.9% 91.9% 92.5%
Greater Vancouver $695,500 279.1 -1.4% -1.6% 1.2% 10.3% 68.4% 85.9% 88.8%
Burnaby East $782,800 300.3 -0.6% -2.3% -1.6% 6.8% 65.2% 83.9% 89.9%
Burnaby North $650,900 277.9 -1.5% 0.1% 1.3% 15.0% 82.3% 95.0% 89.3%
Burnaby South $717,800 288.2 -1.9% -1.5% 1.1% 10.9% 73.8% 90.2% 97.0%
Coquitlam $552,500 303.2 0.7% 0.3% 5.2% 15.9% 90.3% 119.6% 105.6%
Ladner $470,700 223.1 -0.3% -0.1% 6.2% 12.2% 33.5% 51.7% 56.0%
Maple Ridge $374,200 267.2 -2.9% -3.1% 1.7% 23.2% 83.9% 90.6% 69.1%
New Westminster $556,500 315.3 -2.9% -2.2% 4.5% 15.2% 87.3% 98.1% 103.7%
North Vancouver $596,400 239.3 -1.9% -2.6% 1.2% 6.7% 59.1% 66.6% 67.7%
Pitt Meadows $527,200 310.9 -2.8% -3.8% 1.5% 22.2% 90.4% 105.6% 96.8%
Port Coquitlam $471,700 282.1 -1.9% -2.4% 0.8% 14.4% 88.3% 105.0% 82.1%
Port Moody $668,800 278.7 -0.8% -3.5% 0.1% 15.2% 82.2% 106.6% 104.6%
Richmond $685,500 286.2 -2.1% -0.1% 1.8% 12.8% 75.8% 87.5% 94.8%
Squamish $513,400 247.3 -4.2% -0.6% 5.2% 12.3% 89.6% 107.5% 81.4%
Tsawwassen $498,200 210.1 -1.1% -1.8% 5.8% 10.9% 37.2% 53.5% 46.9%
Vancouver East $569,300 314.1 0.0% -1.1% 0.7% 7.5% 71.9% 87.3% 94.6%
Vancouver West $825,000 267.7 -1.2% -2.4% -1.3% 4.8% 52.2% 75.7% 85.1%
West Vancouver $1,190,200 241.1 -3.6% -7.1% -3.8% 5.5% 49.8% 63.9% 67.1%
Whistler $556,600 182.5 -2.7% -1.8% 1.7% 10.5% 110.3% 139.5% 37.6%
HOW TO READ THE TABLE:
• Benchmark Price: Estimated sale price of a benchmark property. Benchmarks represent a typical property within each market.
• Price Index: Index numbers estimate the percentage change in price on typical and constant quality properties over time. All figures are based on past sales.
• x Month/Year Change %: Percentage change of index over a period of x month(s)/year(s)
In January 2005, the indexes are set to 100. *
Townhome properties are similar to attached properties, a category that was used in the previous MLSLink HPI, but do not included duplexes.
Lower Mainland includes areas serviced by both Real Estate Board of Greater Vancouver & Fraser Valley Real Estate Board.
The above info is deemed reliable, but is not guaranteed. All dollar amounts in CDN.
* MLS®, Multiple Listing Service®, and all related graphics are trademarks of The Canadian Real Estate Association 2 of 15