Download to read offline


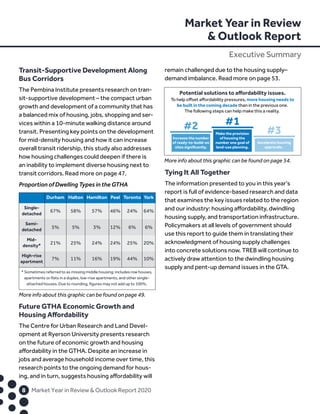
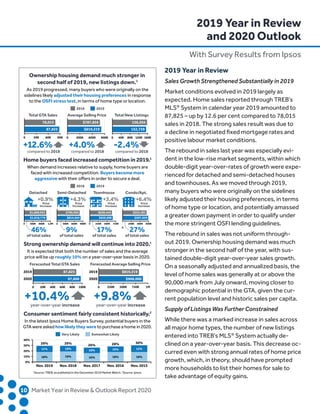
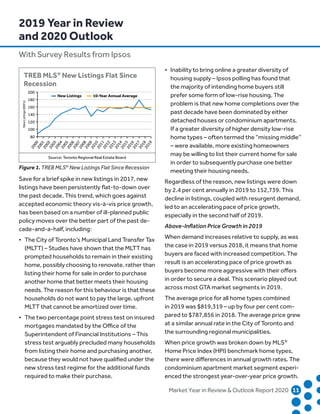


This report provides an overview of the 2019 real estate market and outlook for 2020 across various sectors in the Greater Toronto Area. Key points include: - Home sales increased 12.6% in 2019 while new listings declined, pushing prices up sharply. Sales growth is expected to continue in 2020 amid low interest rates and demand. - The rental market saw transaction growth and above-inflation rent increases in 2019. Strong demand is met with limited new supply. - New home sales rebounded in 2019 after years of decline but more land is needed to boost supply. - Commercial leasing activity declined slightly in 2019 while sales rose slightly. Market conditions remained stable. - Upcoming sections provide recommendations on


