TREB MARKET WATCH 2017
•
0 likes•950 views

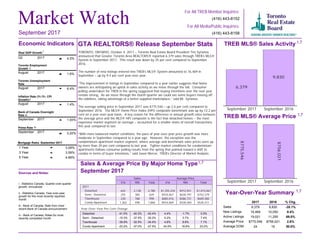
- Sales of homes in the Greater Toronto Area through TREB's MLS system were down 35% in September 2017 compared to September 2016, with 6,379 sales. New listings increased 9.4% year-over-year to 16,469. - The average selling price increased 2.6% to $775,546 compared to September 2016. The MLS HPI composite benchmark increased 12.2% year-over-year, with detached homes accounting for a smaller share of sales. - Tighter market conditions for condominium apartments led to average and benchmark prices increasing over 20% compared to the previous year, following buyer intentions shifting toward condos.

Recommended
Recommended
More Related Content
What's hot
What's hot (15)
Similar to TREB MARKET WATCH 2017
Similar to TREB MARKET WATCH 2017 (16)
More from Michelle Makos
More from Michelle Makos (12)
Recently uploaded
Recently uploaded (20)
TREB MARKET WATCH 2017
- 1. Toronto Employment Growth August 2017 1.6% Month September 2017 1 Year 3 Year 5 Year 3.09% 3.59% 4.89% September 2017 1 Year 3 Year 5 Year Market Watch For All TREB Member Inquiries: (416) 443-8158 For All Media/Public Inquiries: (416) 443-8152 GTA REALTORS® Release September Stats TORONTO, ONTARIO, October 4, 2017 – Toronto Real Estate Board President Tim Syrianos announced that Greater Toronto Area REALTORS® reported 6,379 sales through TREB’s MLS® System in September 2017. This result was down by 35 per cent compared to September 2016. The number of new listings entered into TREB’s MLS® System amounted to 16,469 in September – up by 9.4 per cent year-over-year. “The improvement in listings in September compared to a year earlier suggests that home owners are anticipating an uptick in sales activity as we move through the fall. Consumer polling undertaken for TREB in the spring suggested that buying intentions over the next year remain strong. As we move through the fourth quarter we could see some buyers moving off the sidelines, taking advantage of a better-supplied marketplace,” said Mr. Syrianos. The average selling price in September 2017 was $775,546 – up 2.6 per cent compared to September 2016. The MLS® Home Price Index (HPI) composite benchmark was up by 12.2 per cent on a year-over-year basis. A key reason for the difference in annual growth rates between the average price and the MLS® HPI composite is the fact that detached homes – the most expensive market segment on average – accounted for a smaller share of overall transactions this year compared to last. “With more balanced market conditions, the pace of year-over-year price growth was more moderate in September compared to a year ago. However, the exception was the condominium apartment market segment, where average and benchmark sales prices were up by more than 20 per cent compared to last year. Tighter market conditions for condominium apartments follows consumer polling results from the spring that pointed toward a shift to condos in terms of buyer intentions,” said Jason Mercer, TREB’s Director of Market Analysis. TREB MLS® Sales Activity 6,379 9,830 September 2017 September 2016 TREB MLS® Average Price $775,546 $756,021 September 2017 September 2016 Year-Over-Year Summary 2017 2016 % Chg. Sales New Listings Active Listings Average Price Average DOM 6,379 9,830 -35.1% 16,469 15,050 9.4% 19,021 11,255 69.0% $775,546 $756,021 2.6% 24 16 50.0% Sources and Notes: i - Statistics Canada, Quarter-over-quarter growth, annualized ii - Statistics Canada, Year-over-year growth for the most recently reported month iii - Bank of Canada, Rate from most recent Bank of Canada announcement iv - Bank of Canada, Rates for most recently completed month Real GDP Growth Q2 2017 4.5% Toronto Unemployment Rate August 2017 6.4% Inflation Rate (Yr./Yr. CPI Growth) August 2017 1.4% Bank of Canada Overnight Rate September 2017 1.00% Prime Rate September 2017 3.20% Economic Indicators Metrics Sales Average Price 416 905 Total 416 905 Total 2017 Detached Semi - Detached Townhouse Condo Apartment 642 2,138 2,780 $1,355,234 $912,921 $1,015,067 255 384 639 $935,467 $630,797 $752,379 230 768 998 $685,016 $586,731 $609,382 1,362 498 1,860 $554,069 $428,360 $520,411 Sales & Average Price By Major Home Type September 2017 September 2017 i ii ii iii iv Detached Semi - Detached Townhouse Condo Apartment 4.4% -1.7% 0.0% 5.2% 3.7% 7.4% 4.8% 8.6% 7.1% 24.0% 16.6% 23.2% Detached Semi - Detached Townhouse Condo Apartment -41.0% -40.3% -40.4% -15.3% -37.5% -30.2% -39.9% -32.5% -34.4% -23.2% -37.0% -27.5% 1,7 1,7 1,7 1,7 Year-Over-Year Per Cent Change Mortgage Rates
- 2. Toronto Real Estate Board Market Watch, September 2017 SALES BY PRICE RANGE AND HOUSE TYPE SEPTEMBER 2017 2 Price Range Detached Semi-Detached Att/Row/Twnhouse Condo Townhouse Condo Apt Link Co-op Apt Det Condo Co-ownership Apt Total $0 to $99,999 $100,000 to $199,999 $200,000 to $299,999 $300,000 to $399,999 $400,000 to $499,999 $500,000 to $599,999 $600,000 to $699,999 $700,000 to $799,999 $800,000 to $899,999 $900,000 to $999,999 $1,000,000 to $1,249,999 $1,250,000 to $1,499,999 $1,500,000 to $1,749,999 $1,750,000 to $1,999,999 $2,000,000+ 0 0 0 0 4 0 0 0 0 4 3 0 0 1 11 0 2 0 0 17 12 1 0 21 100 0 1 0 2 137 61 21 12 61 491 2 0 0 2 650 177 36 71 131 511 16 2 0 1 945 260 110 160 120 351 13 0 1 0 1,015 365 185 134 70 162 15 0 0 0 931 400 106 63 21 88 13 1 0 0 692 349 55 40 15 37 11 0 1 0 508 231 44 20 8 30 10 1 0 0 344 335 48 16 9 32 6 0 0 0 446 231 11 13 5 16 1 0 1 0 278 124 12 3 1 10 0 0 0 0 150 60 8 1 1 4 0 0 0 0 74 172 2 0 1 13 0 0 0 0 188 Price Range Detached Semi-Detached Att/Row/Twnhouse Condo Townhouse Condo Apt Link Co-op Apt Det Condo Co-ownership Apt Total $0 to $99,999 $100,000 to $199,999 $200,000 to $299,999 $300,000 to $399,999 $400,000 to $499,999 $500,000 to $599,999 $600,000 to $699,999 $700,000 to $799,999 $800,000 to $899,999 $900,000 to $999,999 $1,000,000 to $1,249,999 $1,250,000 to $1,499,999 $1,500,000 to $1,749,999 $1,750,000 to $1,999,999 $2,000,000+ 0 0 0 0 23 0 0 0 0 23 23 1 1 22 221 0 13 0 3 284 111 8 2 211 1,380 1 27 0 14 1,754 443 152 96 574 5,816 10 14 1 24 7,130 1,243 337 520 1,334 5,768 140 7 8 6 9,363 2,320 791 1,231 1,231 3,320 182 6 13 3 9,097 3,349 1,587 1,586 910 1,877 140 1 15 1 9,466 4,077 1,336 885 388 1,033 104 6 9 1 7,839 4,146 854 610 193 602 126 3 5 0 6,539 3,198 494 414 106 294 109 3 3 0 4,621 4,849 528 378 108 341 117 3 3 0 6,327 3,433 233 153 51 178 31 3 2 0 4,084 2,124 85 43 26 89 2 1 1 0 2,371 1,212 45 10 9 52 1 0 0 0 1,329 2,706 80 11 11 116 0 1 0 0 2,925 SALES BY PRICE RANGE AND HOUSE TYPE YEAR-TO-DATE, 2017 Total Sales Share of Total Sales Average Price 2,780 639 533 465 1,860 87 7 3 5 6,379 43.6% 10.0% 8.4% 7.3% 29.2% 1.4% 0.1% 0.0% 0.1% 100.0% $1,015,067 $752,379 $663,335 $547,540 $520,411 $700,669 $448,500 $897,667 $326,155 $775,546 Total Sales Share of Total Sales Average Price 33,234 6,531 5,940 5,174 21,110 963 88 60 52 73,152 45.4% 8.9% 8.1% 7.1% 28.9% 1.3% 0.1% 0.1% 0.1% 100.0% $1,123,917 $794,153 $720,588 $569,351 $511,747 $746,588 $469,791 $702,824 $348,573 $839,192 1,7 1,7
- 3. Toronto Real Estate Board Market Watch, September 2017 Number of Sales Dollar Volume Average Price Median Price New Listings SNLR (Trend) Active Listings Mos. Inv. (Trend) Avg. SP / LP Avg. DOM TREB Total Halton Region Burlington Halton Hills Milton Oakville Peel Region Brampton Caledon Mississauga City of Toronto Toronto West Toronto Central Toronto East York Region Aurora E. Gwillimbury Georgina King Markham Newmarket Richmond Hill Vaughan Whitchurch-Stouffville Durham Region Ajax Brock Clarington Oshawa Pickering Scugog Uxbridge Whitby Dufferin County Orangeville Simcoe County Adjala-Tosorontio Bradford West GwillimburyEssa Innisfil New Tecumseth 6,379 $4,947,205,546 775,546 $640,000 16,469 56.5% 19,021 1.5 98% 24 581 $495,891,070 853,513 $726,000 1,503 58.7% 1,843 1.5 97% 27 145 $117,527,042 810,531 $717,860 395 63.1% 531 1.5 98% 30 69 $43,656,500 632,703 $620,000 148 68.3% 167 1.3 98% 28 162 $109,466,790 675,721 $635,000 319 57.5% 326 1.2 98% 24 205 $225,240,738 1,098,735 $965,000 641 54.6% 819 1.8 97% 28 1,288 $868,250,180 674,107 $634,000 3,308 54.6% 3,821 1.5 97% 24 606 $401,893,506 663,191 $638,750 1,526 52.4% 1,731 1.5 98% 24 55 $45,873,250 834,059 $740,000 191 49.5% 294 2.5 96% 24 627 $420,483,424 670,627 $609,000 1,591 57.6% 1,796 1.4 97% 23 2,510 $2,032,073,865 809,591 $625,000 5,535 62.7% 5,732 1.4 99% 21 616 $430,805,335 699,359 $624,500 1,483 62.6% 1,632 1.4 99% 22 1,250 $1,132,945,902 906,357 $594,000 2,625 64.5% 2,711 1.4 99% 22 644 $468,322,628 727,209 $685,000 1,427 59.5% 1,389 1.3 100% 20 944 $935,824,181 991,339 $862,050 3,502 47.6% 4,537 2.0 97% 28 46 $51,333,988 1,115,956 $880,000 235 46.1% 310 2.0 96% 28 26 $21,425,388 824,053 $782,500 139 40.7% 226 2.9 95% 34 60 $35,069,900 584,498 $525,000 228 46.5% 334 2.3 95% 31 24 $50,161,600 2,090,067 $1,589,400 120 42.8% 182 3.5 91% 55 276 $264,720,904 959,134 $900,000 793 51.0% 991 1.7 98% 27 98 $78,344,538 799,434 $733,000 353 46.0% 407 1.8 98% 26 156 $162,143,221 1,039,380 $989,950 701 46.1% 898 2.0 98% 26 206 $222,019,142 1,077,763 $937,950 758 48.4% 948 1.9 96% 25 52 $50,605,500 973,183 $775,000 175 44.9% 241 2.4 96% 27 835 $483,186,345 578,666 $540,000 1,914 57.0% 2,025 1.3 98% 23 132 $82,825,436 627,465 $598,750 283 56.6% 275 1.2 99% 22 19 $9,758,000 513,579 $425,000 20 60.8% 53 2.6 96% 42 158 $84,650,795 535,765 $494,500 335 59.1% 348 1.2 98% 23 253 $120,956,074 478,087 $450,000 552 55.6% 547 1.2 98% 22 92 $65,273,585 709,495 $629,500 241 55.8% 268 1.4 97% 21 21 $12,475,300 594,062 $610,000 49 59.5% 89 1.9 98% 30 21 $16,847,000 802,238 $740,000 73 57.6% 107 2.2 97% 31 139 $90,400,155 650,361 $595,000 361 57.7% 338 1.1 98% 23 57 $30,776,700 539,942 $525,000 106 69.6% 111 1.1 98% 25 57 $30,776,700 539,942 $525,000 106 69.6% 111 1.1 98% 25 164 $101,203,205 617,093 $577,000 601 50.0% 952 2.3 97% 38 10 $7,913,000 791,300 $714,500 28 59.1% 62 2.9 94% 51 33 $22,029,900 667,573 $625,000 166 46.3% 223 2.1 97% 25 23 $15,712,290 683,143 $599,900 50 60.3% 99 2.0 96% 59 38 $21,113,590 555,621 $538,500 203 40.5% 345 3.0 96% 37 60 $34,434,425 573,907 $553,000 154 60.0% 223 1.8 98% 36 SUMMARY OF EXISTING HOME TRANSACTIONS ALL HOME TYPES, SEPTEMBER 2017 ALL TREB AREAS 3 1 1 1 2 5498 3
- 4. Toronto Real Estate Board Market Watch, September 2017 SUMMARY OF EXISTING HOME TRANSACTIONS ALL HOME TYPES, SEPTEMBER 2017 CITY OF TORONTO MUNICIPAL BREAKDOWN 4 Number of Sales Dollar Volume Average Price Median Price New Listings SNLR (Trend) Active Listings Mos. Inv. (Trend) Avg. SP / LP Avg. DOM TREB Total City of Toronto Total Toronto West Toronto W01 Toronto W02 Toronto W03 Toronto W04 Toronto W05 Toronto W06 Toronto W07 Toronto W08 Toronto W09 Toronto W10 Toronto Central Toronto C01 Toronto C02 Toronto C03 Toronto C04 Toronto C06 Toronto C07 Toronto C08 Toronto C09 Toronto C10 Toronto C11 Toronto C12 Toronto C13 Toronto C14 Toronto C15 Toronto East Toronto E01 Toronto E02 Toronto E03 Toronto E04 Toronto E05 Toronto E06 Toronto E07 Toronto E08 Toronto E09 Toronto E10 Toronto E11 6,379 $4,947,205,546 $775,546 $640,000 16,469 56.5% 19,021 1.5 98% 24 2,510 $2,032,073,865 $809,591 $625,000 5,535 62.7% 5,732 1.4 99% 21 616 $430,805,335 $699,359 $624,500 1,483 62.6% 1,632 1.4 99% 22 40 $37,473,080 $936,827 $765,000 86 68.9% 81 1.2 101% 15 53 $48,307,700 $911,466 $864,000 141 65.5% 113 1.0 100% 17 58 $42,303,200 $729,366 $710,500 113 58.5% 108 1.3 99% 22 65 $40,794,305 $627,605 $635,000 146 60.0% 161 1.6 98% 24 71 $34,443,650 $485,122 $480,000 190 58.1% 255 1.9 98% 28 113 $75,290,081 $666,284 $550,000 244 65.5% 251 1.4 99% 25 16 $17,786,851 $1,111,678 $933,076 38 66.2% 38 1.2 99% 20 120 $89,391,468 $744,929 $527,500 295 65.4% 305 1.3 98% 19 31 $21,147,800 $682,187 $740,000 86 62.5% 103 1.4 97% 24 49 $23,867,200 $487,086 $454,000 144 56.4% 217 1.9 97% 24 1,250 $1,132,945,902 $906,357 $594,000 2,625 64.5% 2,711 1.4 99% 22 423 $288,820,876 $682,792 $562,500 712 69.4% 667 1.2 101% 21 65 $75,976,334 $1,168,867 $910,000 136 56.3% 154 2.2 101% 29 34 $45,492,790 $1,338,023 $939,000 76 60.5% 87 1.5 103% 23 54 $83,752,495 $1,550,972 $1,463,400 156 58.2% 150 1.5 99% 22 23 $15,684,800 $681,948 $515,000 61 58.3% 79 1.5 97% 24 79 $72,715,300 $920,447 $625,000 223 56.0% 270 1.6 97% 25 164 $105,690,677 $644,455 $547,951 278 69.8% 259 1.2 100% 19 25 $46,443,750 $1,857,750 $1,636,000 74 62.9% 59 1.6 100% 12 59 $56,895,418 $964,329 $754,000 102 66.0% 74 1.1 101% 14 29 $32,500,500 $1,120,707 $602,000 78 67.9% 68 1.0 97% 22 23 $95,069,800 $4,133,470 $3,450,000 92 52.4% 121 2.5 93% 53 44 $41,831,700 $950,720 $571,500 130 63.9% 125 1.1 95% 24 127 $95,365,286 $750,908 $545,000 255 63.6% 290 1.3 98% 20 101 $76,706,176 $759,467 $470,000 252 63.7% 308 1.3 97% 22 644 $468,322,628 $727,209 $685,000 1,427 59.5% 1,389 1.3 100% 20 64 $59,546,548 $930,415 $912,500 124 65.9% 71 0.8 105% 11 66 $76,005,128 $1,151,593 $993,000 141 63.0% 89 1.0 101% 9 63 $52,188,600 $828,390 $805,000 173 57.1% 133 1.2 102% 14 77 $49,895,000 $647,987 $679,000 176 60.6% 181 1.3 98% 28 55 $38,335,350 $697,006 $725,000 132 58.7% 161 1.3 98% 24 19 $15,273,000 $803,842 $635,000 62 51.2% 58 1.5 97% 21 63 $33,556,299 $532,640 $435,000 113 58.9% 156 1.5 99% 29 47 $31,540,799 $671,081 $720,000 94 60.4% 98 1.3 98% 22 84 $40,715,118 $484,704 $447,250 174 61.7% 191 1.2 99% 21 46 $37,387,300 $812,767 $757,500 110 54.0% 105 1.6 99% 16 60 $33,879,486 $564,658 $581,500 128 59.3% 146 1.4 99% 27 1 1 1 2 8 3 9 4 5
- 5. Toronto Real Estate Board Market Watch, September 2017 SUMMARY OF EXISTING HOME TRANSACTIONS ALL HOME TYPES, YEAR-TO-DATE 2017 ALL TREB AREAS 5 Number of Sales Dollar Volume Average Price Median Price New Listings Avg. SP / LP Avg. DOM TREB Total Halton Region Burlington Halton Hills Milton Oakville Peel Region Brampton Caledon Mississauga City of Toronto Toronto West Toronto Central Toronto East York Region Aurora E. Gwillimbury Georgina King Markham Newmarket Richmond Hill Vaughan Whitchurch-Stouffville Durham Region Ajax Brock Clarington Oshawa Pickering Scugog Uxbridge Whitby Dufferin County Orangeville Simcoe County Adjala-Tosorontio Bradford West GwillimburyEssa Innisfil New Tecumseth 73,152 $61,388,574,263 $839,192 $690,000 143,083 105% 15 7,117 $6,610,437,393 $928,824 $795,000 13,240 102% 16 1,901 $1,546,864,294 $813,711 $740,000 3,233 102% 17 822 $614,643,614 $747,742 $678,950 1,241 102% 16 1,744 $1,312,779,228 $752,740 $704,000 3,337 104% 13 2,650 $3,136,150,257 $1,183,453 $1,050,000 5,429 102% 17 14,954 $10,971,538,204 $733,686 $675,000 30,207 104% 14 6,901 $4,901,938,911 $710,323 $673,000 14,537 103% 13 700 $675,238,566 $964,627 $866,000 1,582 101% 18 7,353 $5,394,360,727 $733,627 $655,000 14,088 104% 14 27,418 $23,200,411,281 $846,174 $638,000 47,485 105% 15 7,112 $5,216,869,620 $733,531 $630,000 12,319 105% 16 13,833 $13,145,118,874 $950,272 $605,000 23,310 105% 15 6,473 $4,838,422,787 $747,478 $720,000 11,856 108% 14 12,123 $13,194,572,058 $1,088,392 $960,000 29,473 106% 15 803 $896,917,992 $1,116,959 $1,007,000 2,008 105% 15 360 $357,006,412 $991,684 $901,000 1,031 107% 17 861 $577,260,951 $670,454 $610,000 2,107 103% 16 315 $502,705,568 $1,595,891 $1,400,000 807 100% 27 3,227 $3,512,373,650 $1,088,433 $980,000 7,312 107% 15 1,159 $1,086,622,271 $937,552 $880,000 2,922 108% 13 2,122 $2,575,311,844 $1,213,625 $1,141,000 5,418 107% 14 2,761 $3,103,114,474 $1,123,910 $999,999 6,519 104% 15 515 $583,258,896 $1,132,542 $958,000 1,349 103% 20 8,887 $5,700,540,763 $641,447 $600,000 17,131 106% 13 1,401 $971,334,488 $693,315 $670,000 2,729 107% 13 147 $75,724,140 $515,130 $425,000 271 100% 25 1,596 $918,466,169 $575,480 $545,000 2,958 106% 12 2,530 $1,359,117,532 $537,201 $506,000 5,040 107% 12 1,012 $766,604,707 $757,515 $700,000 1,990 105% 13 256 $171,627,901 $670,421 $610,000 465 100% 20 255 $217,726,146 $853,828 $769,000 485 102% 23 1,690 $1,219,939,680 $721,858 $682,000 3,193 107% 12 545 $292,268,056 $536,272 $520,000 826 102% 15 545 $292,268,056 $536,272 $520,000 826 102% 15 2,108 $1,418,806,508 $673,058 $600,000 4,721 102% 19 133 $111,938,115 $841,640 $685,000 250 99% 27 540 $445,982,662 $825,894 $755,250 1,308 104% 15 302 $162,536,032 $538,199 $480,000 548 100% 22 545 $343,471,750 $630,223 $575,000 1,534 102% 19 588 $354,877,949 $603,534 $559,950 1,081 100% 19 1 1 1 2 4 5
- 6. Toronto Real Estate Board Market Watch, September 2017 SUMMARY OF EXISTING HOME TRANSACTIONS ALL HOME TYPES, YEAR-TO-DATE 2017 CITY OF TORONTO MUNICIPAL BREAKDOWN 6 Number of Sales Dollar Volume Average Price Median Price New Listings Avg. SP / LP Avg. DOM TREB Total City of Toronto Total Toronto West Toronto W01 Toronto W02 Toronto W03 Toronto W04 Toronto W05 Toronto W06 Toronto W07 Toronto W08 Toronto W09 Toronto W10 Toronto Central Toronto C01 Toronto C02 Toronto C03 Toronto C04 Toronto C06 Toronto C07 Toronto C08 Toronto C09 Toronto C10 Toronto C11 Toronto C12 Toronto C13 Toronto C14 Toronto C15 Toronto East Toronto E01 Toronto E02 Toronto E03 Toronto E04 Toronto E05 Toronto E06 Toronto E07 Toronto E08 Toronto E09 Toronto E10 Toronto E11 73,152 $61,388,574,263 $839,192 $690,000 143,083 105% 15 27,418 $23,200,411,281 $846,174 $638,000 47,485 105% 15 7,112 $5,216,869,620 $733,531 $630,000 12,319 105% 16 462 $394,479,823 $853,852 $615,000 735 105% 14 636 $604,866,315 $951,048 $900,000 1,038 109% 12 496 $358,084,341 $721,944 $725,000 922 108% 13 642 $435,517,829 $678,377 $632,500 1,168 106% 18 829 $451,242,873 $544,322 $540,000 1,563 103% 20 1,344 $844,148,802 $628,087 $529,400 2,153 104% 17 215 $254,143,275 $1,182,062 $1,120,000 358 108% 14 1,442 $1,279,834,245 $887,541 $619,000 2,394 104% 14 366 $261,670,302 $714,946 $705,000 659 105% 15 680 $332,881,815 $489,532 $405,000 1,329 103% 18 13,833 $13,145,118,874 $950,272 $605,000 23,310 105% 15 4,616 $3,057,848,232 $662,445 $550,000 7,123 104% 15 650 $960,050,354 $1,477,001 $1,150,000 1,189 103% 22 410 $609,230,771 $1,485,929 $1,062,500 731 106% 15 631 $1,151,573,120 $1,824,997 $1,700,000 1,170 106% 15 300 $277,678,448 $925,595 $563,500 567 107% 15 955 $882,140,728 $923,708 $618,000 1,911 104% 15 1,736 $1,111,009,076 $639,982 $559,850 2,608 104% 15 217 $472,805,891 $2,178,829 $1,675,000 392 103% 16 541 $535,626,617 $990,068 $701,500 847 106% 13 343 $320,329,166 $933,904 $485,000 544 105% 12 281 $887,510,988 $3,158,402 $2,828,000 607 101% 21 602 $674,941,860 $1,121,166 $722,500 1,056 111% 12 1,334 $1,217,791,360 $912,887 $550,000 2,416 105% 14 1,217 $986,582,263 $810,667 $530,000 2,149 106% 14 6,473 $4,838,422,787 $747,478 $720,000 11,856 108% 14 558 $536,612,666 $961,671 $901,500 909 112% 10 511 $557,953,125 $1,091,885 $980,000 855 107% 12 638 $591,034,444 $926,386 $900,209 1,222 110% 13 819 $522,926,951 $638,494 $681,000 1,469 107% 14 682 $501,334,952 $735,095 $618,000 1,282 109% 14 257 $227,819,688 $886,458 $780,000 522 106% 13 634 $385,849,429 $608,595 $440,000 1,234 108% 15 454 $330,765,004 $728,557 $720,500 795 105% 13 874 $496,815,964 $568,439 $525,000 1,583 108% 14 459 $366,345,425 $798,138 $791,500 907 106% 16 587 $320,965,139 $546,789 $560,000 1,078 105% 16 1 1 1 2 4 5
- 7. Toronto Real Estate Board Market Watch, September 2017 SUMMARY OF EXISTING HOME TRANSACTIONS DETACHED HOUSES, SEPTEMBER 2017 ALL TREB AREAS 7 Sales Dollar Volume Average Price Median Price New Listings Active Listings Avg. SP / LP Avg. DOM TREB Total Halton Region Burlington Halton Hills Milton Oakville Peel Region Brampton Caledon Mississauga City of Toronto Toronto West Toronto Central Toronto East York Region Aurora E. Gwillimbury Georgina King Markham Newmarket Richmond Hill Vaughan Whitchurch-Stouffville Durham Region Ajax Brock Clarington Oshawa Pickering Scugog Uxbridge Whitby Dufferin County Orangeville Simcoe County Adjala-Tosorontio Bradford West GwillimburyEssa Innisfil New Tecumseth 2,780 $2,821,885,195 $1,015,067 $829,000 9,009 11,048 97% 26 320 $340,667,120 $1,064,585 $885,000 928 1,196 97% 29 85 $82,827,942 $974,446 $850,000 252 348 97% 32 48 $33,912,100 $706,502 $665,450 117 139 98% 32 68 $58,057,690 $853,790 $783,500 175 215 98% 28 119 $165,869,388 $1,393,860 $1,170,000 384 494 97% 28 554 $482,059,883 $870,144 $807,500 1,738 2,102 97% 24 314 $240,565,592 $766,132 $731,000 911 1,071 97% 25 39 $35,829,750 $918,712 $870,000 157 260 95% 27 201 $205,664,541 $1,023,207 $925,000 670 771 97% 24 642 $870,060,421 $1,355,234 $989,400 2,009 2,164 98% 23 210 $213,299,369 $1,015,711 $879,000 658 732 98% 25 180 $414,386,279 $2,302,146 $1,817,500 642 750 97% 25 252 $242,374,773 $961,805 $825,500 709 682 99% 20 527 $659,096,143 $1,250,657 $1,140,000 2,325 3,106 96% 29 27 $39,378,988 $1,458,481 $1,142,500 160 209 96% 33 20 $17,902,388 $895,119 $864,000 120 206 94% 31 53 $31,841,900 $600,791 $555,000 210 307 95% 31 21 $47,311,600 $2,252,933 $1,700,000 108 167 91% 56 116 $157,566,066 $1,358,328 $1,265,000 425 531 98% 28 64 $57,292,238 $895,191 $845,000 256 305 98% 28 80 $112,153,721 $1,401,922 $1,305,000 452 593 98% 27 113 $157,384,242 $1,392,781 $1,190,000 463 589 96% 24 33 $38,265,000 $1,159,545 $1,085,000 131 199 95% 28 570 $364,038,723 $638,664 $597,750 1,431 1,590 98% 24 87 $60,604,537 $696,604 $681,000 204 197 99% 22 19 $9,758,000 $513,579 $425,000 20 53 96% 42 107 $63,259,695 $591,212 $550,000 255 285 97% 26 184 $95,110,261 $516,904 $485,000 433 438 98% 22 53 $46,085,925 $869,546 $740,000 153 179 96% 24 21 $12,475,300 $594,062 $610,000 48 88 98% 30 14 $13,401,100 $957,221 $947,500 62 98 97% 30 85 $63,343,905 $745,222 $700,000 256 252 98% 23 39 $23,190,800 $594,636 $544,000 71 69 98% 22 39 $23,190,800 $594,636 $544,000 71 69 98% 22 128 $82,772,105 $646,657 $609,000 507 821 96% 39 10 $7,913,000 $791,300 $714,500 28 62 94% 51 20 $14,776,000 $738,800 $705,000 132 186 96% 23 19 $14,178,290 $746,226 $655,000 40 85 96% 66 35 $18,944,590 $541,274 $545,000 188 315 96% 37 44 $26,960,225 $612,732 $579,000 119 173 98% 34 1 2 3 4 51 1 1
- 8. Toronto Real Estate Board Market Watch, September 2017 SUMMARY OF EXISTING HOME TRANSACTIONS DETACHED HOUSES, SEPTEMBER 2017 CITY OF TORONTO MUNICIPAL BREAKDOWN 8 Sales Dollar Volume Average Price Median Price New Listings Active Listings Avg. SP / LP Avg. DOM TREB Total City of Toronto Total Toronto West Toronto W01 Toronto W02 Toronto W03 Toronto W04 Toronto W05 Toronto W06 Toronto W07 Toronto W08 Toronto W09 Toronto W10 Toronto Central Toronto C01 Toronto C02 Toronto C03 Toronto C04 Toronto C06 Toronto C07 Toronto C08 Toronto C09 Toronto C10 Toronto C11 Toronto C12 Toronto C13 Toronto C14 Toronto C15 Toronto East Toronto E01 Toronto E02 Toronto E03 Toronto E04 Toronto E05 Toronto E06 Toronto E07 Toronto E08 Toronto E09 Toronto E10 Toronto E11 2,780 $2,821,885,195 $1,015,067 $829,000 9,009 11,048 97% 26 642 $870,060,421 $1,355,234 $989,400 2,009 2,164 98% 23 210 $213,299,369 $1,015,711 $879,000 658 732 98% 25 10 $16,526,000 $1,652,600 $1,407,500 31 31 99% 20 15 $19,213,000 $1,280,867 $1,249,000 60 55 100% 25 24 $18,507,400 $771,142 $760,000 59 66 98% 22 29 $24,668,000 $850,621 $819,000 84 93 98% 30 13 $10,465,400 $805,031 $799,000 51 75 98% 32 30 $29,760,680 $992,023 $872,500 81 74 99% 31 11 $14,050,700 $1,277,336 $1,390,000 25 25 98% 23 42 $52,389,689 $1,247,374 $1,100,000 158 176 98% 16 15 $13,830,000 $922,000 $870,000 49 60 97% 29 21 $13,888,500 $661,357 $665,000 60 77 98% 26 180 $414,386,279 $2,302,146 $1,817,500 642 750 97% 25 6 $8,584,000 $1,430,667 $1,451,500 12 12 99% 24 5 $11,212,000 $2,242,400 $2,400,000 24 27 100% 31 20 $34,844,000 $1,742,200 $1,707,500 49 52 102% 21 29 $64,172,300 $2,212,838 $1,862,500 105 113 99% 25 6 $7,964,800 $1,327,467 $1,157,400 30 50 95% 32 19 $36,169,000 $1,903,632 $1,800,000 92 120 95% 23 1 $1,700,000 $1,700,000 $1,700,000 2 2 114% 5 9 $26,250,750 $2,916,750 $2,154,750 28 23 99% 10 13 $22,712,029 $1,747,079 $1,760,000 32 20 102% 6 11 $23,507,000 $2,137,000 $2,025,000 34 26 96% 15 17 $87,728,800 $5,160,518 $4,577,000 64 94 93% 61 11 $23,217,800 $2,110,709 $1,400,000 56 53 94% 27 14 $31,498,300 $2,249,879 $1,900,000 62 95 97% 17 19 $34,825,500 $1,832,921 $1,660,000 52 63 96% 21 252 $242,374,773 $961,805 $825,500 709 682 99% 20 10 $11,965,416 $1,196,542 $1,140,000 28 21 109% 14 22 $35,751,628 $1,625,074 $1,414,000 48 37 100% 16 31 $32,189,700 $1,038,377 $925,000 114 94 101% 14 44 $34,959,000 $794,523 $750,000 103 99 97% 31 25 $24,495,000 $979,800 $950,000 63 63 97% 20 13 $12,046,000 $926,615 $816,000 55 53 97% 23 9 $9,229,000 $1,025,444 $850,000 44 65 102% 36 27 $23,005,899 $852,070 $765,000 51 47 99% 23 21 $14,498,030 $690,382 $693,000 74 78 97% 18 32 $30,229,300 $944,666 $829,000 81 76 99% 13 18 $14,005,800 $778,100 $762,500 48 49 100% 16 1 1 1 1 2 3 4 5
- 9. Toronto Real Estate Board Market Watch, September 2017 SUMMARY OF EXISTING HOME TRANSACTIONS SEMI-DETACHED HOUSES, SEPTEMBER 2017 ALL TREB AREAS 9 Sales Dollar Volume Average Price Median Price New Listings Active Listings Avg. SP / LP Avg. DOM TREB Total Halton Region Burlington Halton Hills Milton Oakville Peel Region Brampton Caledon Mississauga City of Toronto Toronto West Toronto Central Toronto East York Region Aurora E. Gwillimbury Georgina King Markham Newmarket Richmond Hill Vaughan Whitchurch-Stouffville Durham Region Ajax Brock Clarington Oshawa Pickering Scugog Uxbridge Whitby Dufferin County Orangeville Simcoe County Adjala-Tosorontio Bradford West GwillimburyEssa Innisfil New Tecumseth 639 $480,770,145 $752,379 $677,000 1,399 1,289 100% 19 41 $26,989,500 $658,280 $650,000 80 73 99% 17 11 $7,053,900 $641,264 $640,000 17 18 99% 13 5 $2,787,400 $557,480 $557,500 5 3 100% 8 15 $9,684,400 $645,627 $645,000 38 33 99% 22 10 $7,463,800 $746,380 $715,400 20 19 99% 17 220 $141,838,974 $644,723 $645,000 481 480 98% 21 137 $84,846,774 $619,320 $620,000 276 276 98% 23 8 $5,164,500 $645,563 $668,500 14 15 98% 17 75 $51,827,700 $691,036 $685,000 191 189 98% 18 255 $238,544,048 $935,467 $854,000 511 399 102% 15 86 $66,706,980 $775,663 $732,500 182 175 100% 18 67 $82,859,834 $1,236,714 $1,125,000 144 110 102% 15 102 $88,977,234 $872,326 $822,500 185 114 104% 12 53 $41,238,800 $778,091 $765,000 206 231 98% 24 4 $2,661,000 $665,250 $655,500 9 15 97% 40 0 - - - 4 5 - - 3 $1,503,000 $501,000 $515,000 5 5 98% 34 0 - - - 1 2 - - 16 $13,948,300 $871,769 $888,250 57 53 97% 23 9 $5,988,000 $665,333 $638,000 39 43 97% 29 6 $5,090,000 $848,333 $795,000 29 32 99% 19 13 $10,604,500 $815,731 $780,000 45 61 98% 18 2 $1,444,000 $722,000 $722,000 17 15 98% 8 53 $24,184,123 $456,304 $435,000 89 71 98% 22 12 $6,179,999 $515,000 $506,250 17 15 98% 18 0 - - - 0 0 - - 6 $2,248,100 $374,683 $393,000 7 6 98% 23 24 $9,542,024 $397,584 $390,250 36 27 99% 26 7 $4,050,000 $578,571 $570,000 13 10 96% 18 0 - - - 0 0 - - 0 - - - 0 0 - - 4 $2,164,000 $541,000 $547,500 16 13 98% 19 10 $4,342,400 $434,240 $415,500 7 7 99% 47 10 $4,342,400 $434,240 $415,500 7 7 99% 47 7 $3,632,300 $518,900 $505,000 25 28 99% 17 0 - - - 0 0 - - 5 $2,812,400 $562,480 $508,500 15 16 98% 16 0 - - - 2 2 - - 0 - - - 2 2 - - 2 $819,900 $409,950 $409,950 6 8 99% 19 1 1 1 1 2 3 4 5
- 10. Toronto Real Estate Board Market Watch, September 2017 SUMMARY OF EXISTING HOME TRANSACTIONS SEMI-DETACHED HOUSES, SEPTEMBER 2017 CITY OF TORONTO MUNICIPAL BREAKDOWN 10 Sales Dollar Volume Average Price Median Price New Listings Active Listings Avg. SP / LP Avg. DOM TREB Total City of Toronto Total Toronto West Toronto W01 Toronto W02 Toronto W03 Toronto W04 Toronto W05 Toronto W06 Toronto W07 Toronto W08 Toronto W09 Toronto W10 Toronto Central Toronto C01 Toronto C02 Toronto C03 Toronto C04 Toronto C06 Toronto C07 Toronto C08 Toronto C09 Toronto C10 Toronto C11 Toronto C12 Toronto C13 Toronto C14 Toronto C15 Toronto East Toronto E01 Toronto E02 Toronto E03 Toronto E04 Toronto E05 Toronto E06 Toronto E07 Toronto E08 Toronto E09 Toronto E10 Toronto E11 639 $480,770,145 $752,379 $677,000 1,399 1,289 100% 19 255 $238,544,048 $935,467 $854,000 511 399 102% 15 86 $66,706,980 $775,663 $732,500 182 175 100% 18 8 $9,763,880 $1,220,485 $1,260,940 11 5 107% 6 18 $15,722,800 $873,489 $877,450 29 20 101% 12 29 $20,991,300 $723,838 $721,000 44 33 99% 23 3 $2,120,000 $706,667 $730,000 5 7 96% 27 17 $10,820,500 $636,500 $637,500 75 87 97% 21 2 $1,600,000 $800,000 $800,000 6 8 97% 14 2 $1,385,000 $692,500 $692,500 2 1 107% 11 2 $1,456,500 $728,250 $728,250 5 6 95% 22 3 $1,792,000 $597,333 $642,000 1 0 105% 16 2 $1,055,000 $527,500 $527,500 4 8 98% 27 67 $82,859,834 $1,236,714 $1,125,000 144 110 102% 15 16 $22,052,888 $1,378,306 $1,328,000 25 16 99% 25 15 $21,704,346 $1,446,956 $1,235,000 27 14 108% 9 5 $4,995,500 $999,100 $757,500 12 9 115% 7 2 $3,022,500 $1,511,250 $1,511,250 10 7 101% 5 0 - - - 0 0 - - 2 $1,828,400 $914,200 $914,200 6 5 102% 34 5 $5,495,000 $1,099,000 $1,070,000 10 5 100% 7 2 $3,535,000 $1,767,500 $1,767,500 8 7 102% 10 6 $7,383,400 $1,230,567 $1,137,950 12 8 99% 9 3 $3,165,000 $1,055,000 $1,025,000 2 0 98% 19 0 - - - 0 0 - - 5 $3,870,000 $774,000 $745,000 16 13 98% 6 0 - - - 0 0 - - 6 $5,807,800 $967,967 $953,000 16 26 99% 29 102 $88,977,234 $872,326 $822,500 185 114 104% 12 32 $32,539,234 $1,016,851 $994,500 56 22 106% 9 26 $24,605,000 $946,346 $875,000 54 25 105% 6 17 $13,877,000 $816,294 $805,000 34 21 105% 10 4 $2,431,000 $607,750 $598,000 7 9 100% 11 2 $1,588,000 $794,000 $794,000 7 10 95% 38 2 $1,448,000 $724,000 $724,000 2 1 100% 2 3 $2,137,000 $712,333 $705,000 8 9 96% 36 2 $1,440,000 $720,000 $720,000 1 0 99% 11 5 $3,104,000 $620,800 $610,000 2 3 99% 28 4 $2,520,000 $630,000 $623,500 3 1 97% 18 5 $3,288,000 $657,600 $650,000 11 13 95% 43 1 1 1 1 2 3 4 5
- 11. Toronto Real Estate Board Market Watch, September 2017 SUMMARY OF EXISTING HOME TRANSACTIONS CONDOMINIUM TOWNHOUSES, SEPTEMBER 2017 ALL TREB AREAS 11 Sales Dollar Volume Average Price Median Price New Listings Active Listings Avg. SP / LP Avg. DOM TREB Total Halton Region Burlington Halton Hills Milton Oakville Peel Region Brampton Caledon Mississauga City of Toronto Toronto West Toronto Central Toronto East York Region Aurora E. Gwillimbury Georgina King Markham Newmarket Richmond Hill Vaughan Whitchurch-Stouffville Durham Region Ajax Brock Clarington Oshawa Pickering Scugog Uxbridge Whitby Dufferin County Orangeville Simcoe County Adjala-Tosorontio Bradford West GwillimburyEssa Innisfil New Tecumseth 465 $254,606,000 $547,540 $515,000 1,039 1,164 98% 25 47 $23,207,300 $493,772 $468,000 129 155 98% 29 18 $9,626,500 $534,806 $479,500 55 70 97% 35 6 $2,108,900 $351,483 $341,500 9 9 99% 23 7 $3,131,900 $447,414 $430,000 13 15 99% 29 16 $8,340,000 $521,250 $486,000 52 61 98% 25 166 $86,890,072 $523,434 $510,000 356 383 98% 26 42 $18,894,101 $449,860 $440,000 92 98 98% 30 0 - - - 0 0 - - 124 $67,995,971 $548,355 $540,000 264 285 98% 24 162 $98,575,717 $608,492 $545,500 344 366 99% 22 52 $27,534,555 $529,511 $499,750 103 108 98% 21 51 $38,527,913 $755,449 $657,500 139 137 99% 19 59 $32,513,249 $551,072 $530,000 102 121 99% 27 45 $29,181,700 $648,482 $635,000 109 144 97% 32 6 $3,092,000 $515,333 $541,000 20 31 96% 20 0 - - - 0 0 - - 0 - - - 1 1 - - 0 - - - 0 0 - - 20 $14,556,400 $727,820 $677,500 35 50 96% 33 7 $4,091,800 $584,543 $532,000 14 15 97% 38 6 $3,989,000 $664,833 $673,000 15 19 98% 18 5 $3,035,000 $607,000 $595,000 24 27 98% 35 1 $417,500 $417,500 $417,500 0 1 95% 111 43 $16,107,211 $374,586 $399,000 92 107 98% 23 8 $3,497,000 $437,125 $445,000 15 17 97% 27 0 - - - 0 0 - - 1 $346,000 $346,000 $346,000 3 5 99% 29 17 $4,572,900 $268,994 $255,000 25 30 98% 18 9 $4,039,911 $448,879 $460,000 32 37 100% 14 0 - - - 0 0 - - 2 $1,130,000 $565,000 $565,000 5 5 95% 55 6 $2,521,400 $420,233 $407,500 12 13 98% 33 2 $644,000 $322,000 $322,000 7 6 103% 7 2 $644,000 $322,000 $322,000 7 6 103% 7 0 - - - 2 3 - - 0 - - - 0 0 - - 0 - - - 1 2 - - 0 - - - 0 0 - - 0 - - - 0 0 - - 0 - - - 1 1 - - 1 1 1 1 2 3 4 5
- 12. Toronto Real Estate Board Market Watch, September 2017 SUMMARY OF EXISTING HOME TRANSACTIONS CONDOMINIUM TOWNHOUSES, SEPTEMBER 2017 CITY OF TORONTO MUNICIPAL BREAKDOWN 12 Sales Dollar Volume Average Price Median Price New Listings Active Listings Avg. SP / LP Avg. DOM TREB Total City of Toronto Total Toronto West Toronto W01 Toronto W02 Toronto W03 Toronto W04 Toronto W05 Toronto W06 Toronto W07 Toronto W08 Toronto W09 Toronto W10 Toronto Central Toronto C01 Toronto C02 Toronto C03 Toronto C04 Toronto C06 Toronto C07 Toronto C08 Toronto C09 Toronto C10 Toronto C11 Toronto C12 Toronto C13 Toronto C14 Toronto C15 Toronto East Toronto E01 Toronto E02 Toronto E03 Toronto E04 Toronto E05 Toronto E06 Toronto E07 Toronto E08 Toronto E09 Toronto E10 Toronto E11 465 $254,606,000 $547,540 $515,000 1,039 1,164 98% 25 162 $98,575,717 $608,492 $545,500 344 366 99% 22 52 $27,534,555 $529,511 $499,750 103 108 98% 21 3 $2,131,900 $710,633 $790,000 2 3 100% 20 6 $4,481,000 $746,833 $752,500 17 12 99% 13 0 - - - 0 1 - - 10 $4,837,005 $483,701 $485,000 13 12 99% 19 15 $6,304,950 $420,330 $449,000 28 35 97% 32 4 $2,333,000 $583,250 $562,500 12 11 100% 18 0 - - - 0 0 - - 6 $2,981,900 $496,983 $491,000 9 8 98% 18 4 $2,889,000 $722,250 $682,500 9 8 95% 13 4 $1,575,800 $393,950 $392,400 13 18 96% 19 51 $38,527,913 $755,449 $657,500 139 137 99% 19 17 $11,509,300 $677,018 $650,000 27 17 101% 13 2 $3,535,000 $1,767,500 $1,767,500 6 8 95% 59 1 $970,000 $970,000 $970,000 0 0 96% 33 0 - - - 1 2 - - 1 $602,000 $602,000 $602,000 2 1 97% 4 6 $3,861,100 $643,517 $660,550 11 16 99% 27 6 $3,853,013 $642,169 $589,007 11 11 103% 15 1 $1,825,000 $1,825,000 $1,825,000 3 1 99% 3 1 $995,000 $995,000 $995,000 9 8 111% 6 0 - - - 3 7 - - 3 $3,043,000 $1,014,333 $1,088,000 15 14 101% 33 1 $1,005,000 $1,005,000 $1,005,000 6 5 92% 18 5 $3,532,500 $706,500 $622,500 14 14 99% 13 7 $3,797,000 $542,429 $470,000 31 33 98% 18 59 $32,513,249 $551,072 $530,000 102 121 99% 27 5 $3,463,000 $692,600 $790,000 5 4 101% 13 4 $3,707,900 $926,975 $869,000 8 5 102% 5 1 $365,000 $365,000 $365,000 0 0 97% 5 8 $4,314,500 $539,313 $631,250 14 10 99% 29 7 $3,761,850 $537,407 $556,000 23 29 100% 25 1 $585,000 $585,000 $585,000 0 0 93% 37 9 $4,962,999 $551,444 $540,000 6 10 99% 29 4 $1,787,500 $446,875 $438,750 12 12 98% 36 7 $3,395,500 $485,071 $480,000 7 14 99% 33 4 $1,927,500 $481,875 $490,000 10 11 98% 40 9 $4,242,500 $471,389 $440,000 17 26 99% 27 1 1 1 1 2 3 4 5
- 13. Toronto Real Estate Board Market Watch, September 2017 SUMMARY OF EXISTING HOME TRANSACTIONS CONDOMINIUM APARTMENT, SEPTEMBER 2017 ALL TREB AREAS 13 Sales Dollar Volume Average Price Median Price New Listings Active Listings Avg. SP / LP Avg. DOM TREB Total Halton Region Burlington Halton Hills Milton Oakville Peel Region Brampton Caledon Mississauga City of Toronto Toronto West Toronto Central Toronto East York Region Aurora E. Gwillimbury Georgina King Markham Newmarket Richmond Hill Vaughan Whitchurch-Stouffville Durham Region Ajax Brock Clarington Oshawa Pickering Scugog Uxbridge Whitby Dufferin County Orangeville Simcoe County Adjala-Tosorontio Bradford West GwillimburyEssa Innisfil New Tecumseth 1,860 $967,965,378 $520,411 $453,000 3,505 3,927 99% 23 57 $29,602,850 $519,348 $400,000 117 159 98% 26 11 $5,662,300 $514,755 $399,000 31 49 101% 12 3 $883,500 $294,500 $288,000 3 4 95% 36 16 $6,691,500 $418,219 $414,750 18 15 98% 29 27 $16,365,550 $606,131 $408,000 65 91 97% 29 241 $92,926,625 $385,588 $365,000 465 568 98% 25 33 $11,091,000 $336,091 $330,000 56 80 97% 30 0 - - - 0 0 - - 208 $81,835,625 $393,441 $367,500 409 488 98% 24 1,362 $754,641,965 $554,069 $487,900 2,484 2,620 100% 22 255 $114,873,780 $450,485 $420,000 499 563 99% 22 917 $564,554,899 $615,654 $531,000 1,639 1,661 100% 22 190 $75,213,286 $395,859 $360,000 346 396 99% 23 156 $75,057,450 $481,138 $450,000 363 489 98% 28 2 $1,125,000 $562,500 $562,500 7 11 104% 10 0 - - - 0 0 - - 1 $235,000 $235,000 $235,000 2 3 98% 22 0 - - - 3 6 - - 78 $37,936,750 $486,369 $449,450 135 183 98% 26 4 $1,777,000 $444,250 $472,000 5 7 99% 17 37 $16,520,700 $446,505 $430,000 101 132 97% 30 34 $17,463,000 $513,618 $449,500 107 143 98% 31 0 - - - 3 4 - - 42 $15,342,488 $365,297 $359,000 69 67 99% 21 8 $3,177,000 $397,125 $359,000 12 11 100% 15 0 - - - 0 0 - - 7 $2,172,200 $310,314 $294,900 17 22 99% 28 4 $905,388 $226,347 $231,750 11 14 97% 32 11 $4,227,300 $384,300 $380,000 12 7 99% 15 0 - - - 1 1 - - 3 $1,299,900 $433,300 $389,900 3 1 98% 32 9 $3,560,700 $395,633 $390,000 13 11 98% 22 1 $149,000 $149,000 $149,000 1 7 100% 29 1 $149,000 $149,000 $149,000 1 7 100% 29 1 $245,000 $245,000 $245,000 6 17 98% 13 0 - - - 0 0 - - 0 - - - 2 3 - - 0 - - - 0 0 - - 0 - - - 2 9 - - 1 $245,000 $245,000 $245,000 2 5 98% 13 1 1 1 1 2 3 4 5
- 14. Toronto Real Estate Board Market Watch, September 2017 SUMMARY OF EXISTING HOME TRANSACTIONS CONDOMINIUM APARTMENT, SEPTEMBER 2017 CITY OF TORONTO MUNICIPAL BREAKDOWN 14 Sales Dollar Volume Average Price Median Price New Listings Active Listings Avg. SP / LP Avg. DOM TREB Total City of Toronto Total Toronto West Toronto W01 Toronto W02 Toronto W03 Toronto W04 Toronto W05 Toronto W06 Toronto W07 Toronto W08 Toronto W09 Toronto W10 Toronto Central Toronto C01 Toronto C02 Toronto C03 Toronto C04 Toronto C06 Toronto C07 Toronto C08 Toronto C09 Toronto C10 Toronto C11 Toronto C12 Toronto C13 Toronto C14 Toronto C15 Toronto East Toronto E01 Toronto E02 Toronto E03 Toronto E04 Toronto E05 Toronto E06 Toronto E07 Toronto E08 Toronto E09 Toronto E10 Toronto E11 1,860 $967,965,378 $520,411 $453,000 3,505 3,927 99% 23 1,362 $754,641,965 $554,069 $487,900 2,484 2,620 100% 22 255 $114,873,780 $450,485 $420,000 499 563 99% 22 19 $9,051,300 $476,384 $470,000 41 38 99% 15 12 $7,290,900 $607,575 $523,750 29 19 103% 15 4 $2,146,500 $536,625 $557,500 6 4 107% 6 21 $7,872,300 $374,871 $355,000 42 47 99% 19 24 $6,013,800 $250,575 $266,500 32 42 98% 30 76 $40,883,901 $537,946 $475,500 133 146 99% 23 1 $485,000 $485,000 $485,000 8 9 97% 15 69 $32,283,379 $467,875 $422,000 119 112 99% 21 8 $2,076,800 $259,600 $215,950 24 34 95% 25 21 $6,769,900 $322,376 $333,000 65 112 96% 24 917 $564,554,899 $615,654 $531,000 1,639 1,661 100% 22 377 $238,889,788 $633,660 $545,000 632 611 102% 21 37 $34,041,988 $920,054 $745,000 72 100 98% 38 8 $4,683,290 $585,411 $521,745 14 24 99% 36 22 $16,241,918 $738,269 $537,500 37 24 102% 20 16 $7,118,000 $444,875 $419,250 29 28 98% 22 48 $27,628,800 $575,600 $548,500 108 124 98% 26 142 $86,727,664 $610,758 $537,500 243 231 100% 19 11 $12,498,000 $1,136,182 $825,000 28 23 101% 16 38 $25,385,989 $668,052 $614,500 48 37 101% 17 15 $5,828,500 $388,567 $355,000 39 35 98% 27 3 $4,298,000 $1,432,667 $1,380,000 13 13 95% 26 25 $11,389,400 $455,576 $435,000 49 52 96% 28 106 $57,547,686 $542,903 $516,000 175 175 99% 21 69 $32,275,876 $467,766 $438,000 152 184 98% 22 190 $75,213,286 $395,859 $360,000 346 396 99% 23 13 $8,294,898 $638,069 $565,000 19 10 100% 14 9 $6,963,800 $773,756 $620,000 24 20 100% 6 11 $3,671,900 $333,809 $298,000 17 15 100% 24 18 $6,060,500 $336,694 $338,500 42 53 97% 24 20 $7,700,500 $385,025 $354,500 36 54 98% 28 3 $1,194,000 $398,000 $330,000 5 4 98% 21 38 $14,438,300 $379,955 $372,500 52 63 97% 29 11 $3,117,400 $283,400 $258,500 25 35 99% 19 49 $18,456,088 $376,655 $365,000 86 93 100% 21 2 $435,000 $217,500 $217,500 8 12 97% 33 16 $4,880,900 $305,056 $308,500 32 37 97% 31 1 1 1 1 2 3 4 5
- 15. Toronto Real Estate Board Market Watch, September 2017 SUMMARY OF EXISTING HOME TRANSACTIONS LINK, SEPTEMBER 2017 ALL TREB AREAS 15 Sales Dollar Volume Average Price Median Price New Listings Active Listings Avg. SP / LP Avg. DOM TREB Total Halton Region Burlington Halton Hills Milton Oakville Peel Region Brampton Caledon Mississauga City of Toronto Toronto West Toronto Central Toronto East York Region Aurora E. Gwillimbury Georgina King Markham Newmarket Richmond Hill Vaughan Whitchurch-Stouffville Durham Region Ajax Brock Clarington Oshawa Pickering Scugog Uxbridge Whitby Dufferin County Orangeville Simcoe County Adjala-Tosorontio Bradford West GwillimburyEssa Innisfil New Tecumseth 87 $60,958,200 $700,669 $685,000 201 203 99% 24 7 $4,576,000 $653,714 $650,000 12 12 98% 36 1 $610,000 $610,000 $610,000 2 2 102% 4 0 - - - 0 0 - - 3 $1,807,000 $602,333 $625,000 2 1 98% 40 3 $2,159,000 $719,667 $719,000 8 9 98% 42 6 $4,351,000 $725,167 $728,500 24 27 100% 19 3 $2,151,000 $717,000 $711,000 14 17 98% 30 1 $665,000 $665,000 $665,000 2 1 98% 4 2 $1,535,000 $767,500 $767,500 8 9 104% 10 9 $6,503,500 $722,611 $685,000 6 11 97% 23 0 - - - 0 0 - - 1 $858,500 $858,500 $858,500 1 2 95% 12 8 $5,645,000 $705,625 $681,500 5 9 97% 25 31 $28,448,800 $917,703 $905,000 93 97 98% 28 1 $909,000 $909,000 $909,000 4 4 96% 7 0 - - - 0 0 - - 0 - - - 0 0 - - 0 - - - 2 3 - - 23 $21,496,300 $934,622 $925,000 49 56 99% 33 0 - - - 0 0 - - 3 $2,480,000 $826,667 $830,000 24 22 94% 22 4 $3,563,500 $890,875 $862,500 14 12 99% 9 0 - - - 0 0 - - 31 $15,672,400 $505,561 $500,000 50 33 100% 21 3 $1,626,000 $542,000 $506,000 4 2 97% 40 0 - - - 0 0 - - 16 $7,913,400 $494,588 $501,000 20 10 101% 11 5 $2,090,000 $418,000 $407,000 8 5 98% 39 0 - - - 4 5 - - 0 - - - 0 0 - - 0 - - - 0 0 - - 7 $4,043,000 $577,571 $570,000 14 11 98% 20 0 - - - 0 0 - - 0 - - - 0 0 - - 3 $1,406,500 $468,833 $490,000 16 23 99% 11 0 - - - 0 0 - - 2 $1,001,500 $500,750 $500,750 9 8 100% 13 1 $405,000 $405,000 $405,000 6 10 96% 8 0 - - - 0 2 - - 0 - - - 1 3 - - 1 1 1 1 2 3 4 5
- 16. Toronto Real Estate Board Market Watch, September 2017 SUMMARY OF EXISTING HOME TRANSACTIONS LINK, SEPTEMBER 2017 CITY OF TORONTO MUNICIPAL BREAKDOWN 16 Sales Dollar Volume Average Price Median Price New Listings Active Listings Avg. SP / LP Avg. DOM TREB Total City of Toronto Total Toronto West Toronto W01 Toronto W02 Toronto W03 Toronto W04 Toronto W05 Toronto W06 Toronto W07 Toronto W08 Toronto W09 Toronto W10 Toronto Central Toronto C01 Toronto C02 Toronto C03 Toronto C04 Toronto C06 Toronto C07 Toronto C08 Toronto C09 Toronto C10 Toronto C11 Toronto C12 Toronto C13 Toronto C14 Toronto C15 Toronto East Toronto E01 Toronto E02 Toronto E03 Toronto E04 Toronto E05 Toronto E06 Toronto E07 Toronto E08 Toronto E09 Toronto E10 Toronto E11 87 $60,958,200 $700,669 $685,000 201 203 99% 24 9 $6,503,500 $722,611 $685,000 6 11 97% 23 0 - - - 0 0 - - 0 - - - 0 0 - - 0 - - - 0 0 - - 0 - - - 0 0 - - 0 - - - 0 0 - - 0 - - - 0 0 - - 0 - - - 0 0 - - 0 - - - 0 0 - - 0 - - - 0 0 - - 0 - - - 0 0 - - 0 - - - 0 0 - - 1 $858,500 $858,500 $858,500 1 2 95% 12 0 - - - 0 0 - - 0 - - - 0 0 - - 0 - - - 0 0 - - 0 - - - 0 0 - - 0 - - - 0 0 - - 0 - - - 0 0 - - 0 - - - 0 0 - - 0 - - - 0 0 - - 0 - - - 0 0 - - 0 - - - 0 0 - - 0 - - - 0 0 - - 1 $858,500 $858,500 $858,500 0 0 95% 12 0 - - - 0 0 - - 0 - - - 1 2 - - 8 $5,645,000 $705,625 $681,500 5 9 97% 25 0 - - - 0 0 - - 0 - - - 0 0 - - 0 - - - 0 0 - - 0 - - - 0 0 - - 1 $790,000 $790,000 $790,000 2 4 99% 1 0 - - - 0 0 - - 3 $2,171,000 $723,667 $719,000 1 5 96% 19 0 - - - 0 0 - - 0 - - - 0 0 - - 0 - - - 0 0 - - 4 $2,684,000 $671,000 $671,500 2 0 97% 35 1 1 1 1 2 3 4 5
- 17. Toronto Real Estate Board Market Watch, September 2017 SUMMARY OF EXISTING HOME TRANSACTIONS ATTACHED/ROW/TOWNHOUSE, SEPTEMBER 2017 ALL TREB AREAS 17 Sales Dollar Volume Average Price Median Price New Listings Active Listings Avg. SP / LP Avg. DOM TREB Total Halton Region Burlington Halton Hills Milton Oakville Peel Region Brampton Caledon Mississauga City of Toronto Toronto West Toronto Central Toronto East York Region Aurora E. Gwillimbury Georgina King Markham Newmarket Richmond Hill Vaughan Whitchurch-Stouffville Durham Region Ajax Brock Clarington Oshawa Pickering Scugog Uxbridge Whitby Dufferin County Orangeville Simcoe County Adjala-Tosorontio Bradford West GwillimburyEssa Innisfil New Tecumseth 533 $353,557,351 $663,335 $615,000 1,277 1,343 99% 21 109 $70,848,300 $649,984 $599,900 235 244 98% 23 19 $11,746,400 $618,232 $614,500 36 40 98% 36 7 $3,964,600 $566,371 $582,000 14 12 99% 20 53 $30,094,300 $567,817 $556,000 73 47 99% 16 30 $25,043,000 $834,767 $788,000 112 145 98% 29 100 $59,658,626 $596,586 $599,950 241 256 98% 18 77 $44,345,039 $575,910 $590,000 176 187 98% 19 7 $4,214,000 $602,000 $610,000 17 17 99% 19 16 $11,099,587 $693,724 $692,000 48 52 98% 11 68 $58,977,937 $867,323 $761,500 159 152 100% 16 11 $7,930,651 $720,968 $712,000 36 46 98% 22 25 $27,643,700 $1,105,748 $1,090,000 48 43 101% 17 32 $23,403,586 $731,362 $654,893 75 63 101% 14 131 $101,508,288 $774,872 $747,000 405 468 98% 22 6 $4,168,000 $694,667 $700,000 35 40 99% 14 6 $3,523,000 $587,167 $592,500 15 15 97% 43 3 $1,490,000 $496,667 $492,000 10 18 98% 23 3 $2,850,000 $950,000 $1,075,000 6 4 95% 50 22 $17,924,088 $814,731 $801,250 92 117 99% 16 14 $9,195,500 $656,821 $646,500 39 37 99% 14 24 $21,909,800 $912,908 $879,000 79 99 98% 21 37 $29,968,900 $809,970 $782,000 105 116 98% 27 16 $10,479,000 $654,938 $660,000 24 22 98% 22 96 $47,841,400 $498,348 $501,500 183 157 98% 20 14 $7,740,900 $552,921 $562,500 31 33 98% 21 0 - - - 0 0 - - 21 $8,711,400 $414,829 $410,000 33 20 99% 15 19 $8,735,501 $459,763 $465,000 39 33 99% 17 12 $6,870,449 $572,537 $578,500 27 30 99% 23 0 - - - 0 0 - - 2 $1,016,000 $508,000 $508,000 3 3 93% 16 28 $14,767,150 $527,398 $524,000 50 38 99% 23 5 $2,450,500 $490,100 $525,000 20 22 100% 18 5 $2,450,500 $490,100 $525,000 20 22 100% 18 24 $12,272,300 $511,346 $473,750 34 44 98% 45 0 - - - 0 0 - - 6 $3,440,000 $573,333 $562,500 7 8 98% 42 3 $1,129,000 $376,333 $375,500 2 2 97% 31 3 $2,169,000 $723,000 $465,000 11 17 99% 39 12 $5,534,300 $461,192 $431,000 14 17 98% 50 1 1 1 1 2 3 4 5
- 18. Toronto Real Estate Board Market Watch, September 2017 SUMMARY OF EXISTING HOME TRANSACTIONS ATTACHED/ROW/TOWNHOUSE, SEPTEMBER 2017 CITY OF TORONTO MUNICIPAL BREAKDOWN 18 Sales Dollar Volume Average Price Median Price New Listings Active Listings Avg. SP / LP Avg. DOM TREB Total City of Toronto Total Toronto West Toronto W01 Toronto W02 Toronto W03 Toronto W04 Toronto W05 Toronto W06 Toronto W07 Toronto W08 Toronto W09 Toronto W10 Toronto Central Toronto C01 Toronto C02 Toronto C03 Toronto C04 Toronto C06 Toronto C07 Toronto C08 Toronto C09 Toronto C10 Toronto C11 Toronto C12 Toronto C13 Toronto C14 Toronto C15 Toronto East Toronto E01 Toronto E02 Toronto E03 Toronto E04 Toronto E05 Toronto E06 Toronto E07 Toronto E08 Toronto E09 Toronto E10 Toronto E11 533 $353,557,351 $663,335 $615,000 1,277 1,343 99% 21 68 $58,977,937 $867,323 $761,500 159 152 100% 16 11 $7,930,651 $720,968 $712,000 36 46 98% 22 0 - - - 1 4 - - 2 $1,600,000 $800,000 $800,000 5 5 96% 27 1 $658,000 $658,000 $658,000 4 4 94% 59 2 $1,297,000 $648,500 $648,500 2 2 98% 19 1 $659,000 $659,000 $659,000 3 12 100% 43 1 $712,500 $712,500 $712,500 11 11 103% 1 2 $1,866,151 $933,076 $933,076 3 3 99% 14 0 - - - 3 3 - - 1 $560,000 $560,000 $560,000 2 0 96% 15 1 $578,000 $578,000 $578,000 2 2 100% 9 25 $27,643,700 $1,105,748 $1,090,000 48 43 101% 17 6 $7,369,900 $1,228,317 $1,302,500 16 11 105% 6 4 $4,473,000 $1,118,250 $1,080,000 6 5 102% 7 0 - - - 0 1 - - 0 - - - 0 1 - - 0 - - - 0 0 - - 4 $3,228,000 $807,000 $814,000 6 5 101% 14 7 $6,885,000 $983,571 $982,000 10 10 93% 37 1 $1,410,000 $1,410,000 $1,410,000 2 1 119% 6 0 - - - 1 1 - - 0 - - - 0 0 - - 0 - - - 0 0 - - 1 $1,491,000 $1,491,000 $1,491,000 3 2 100% 7 2 $2,786,800 $1,393,400 $1,393,400 4 6 104% 15 0 - - - 0 0 - - 32 $23,403,586 $731,362 $654,893 75 63 101% 14 4 $3,284,000 $821,000 $761,500 16 14 100% 7 5 $4,976,800 $995,360 $785,000 6 1 99% 6 3 $2,085,000 $695,000 $620,000 8 3 98% 7 3 $2,130,000 $710,000 $770,000 9 9 102% 15 0 - - - 1 1 - - 0 - - - 0 0 - - 1 $618,000 $618,000 $618,000 2 4 100% 12 3 $2,190,000 $730,000 $720,000 5 4 96% 19 2 $1,261,500 $630,750 $630,750 5 3 113% 12 3 $2,080,000 $693,333 $675,000 6 4 104% 7 8 $4,778,286 $597,286 $601,000 17 20 101% 27 1 1 1 1 2 3 4 5
- 19. Toronto Real Estate Board Market Watch, September 2017 SUMMARY OF EXISTING HOME TRANSACTIONS CO-OP APARTMENT, SEPTEMBER 2017 ALL TREB AREAS 19 Sales Dollar Volume Average Price Median Price New Listings Active Listings Avg. SP / LP Average DOM TREB Total Halton Region Burlington Halton Hills Milton Oakville Peel Region Brampton Caledon Mississauga City of Toronto Toronto West Toronto Central Toronto East York Region Aurora E. Gwillimbury Georgina King Markham Newmarket Richmond Hill Vaughan Whitchurch-Stouffville Durham Region Ajax Brock Clarington Oshawa Pickering Scugog Uxbridge Whitby Dufferin County Orangeville Simcoe County Adjala-Tosorontio Bradford West GwillimburyEssa Innisfil New Tecumseth 7 $3,139,500 $448,500 $415,000 16 14 105% 12 0 - - - 0 1 - - 0 - - - 0 1 - - 0 - - - 0 0 - - 0 - - - 0 0 - - 0 - - - 0 0 - - 0 - - - 0 0 - - 0 - - - 0 0 - - 0 - - - 0 0 - - 0 - - - 0 0 - - 7 $3,139,500 $448,500 $415,000 15 12 105% 12 2 $460,000 $230,000 $230,000 4 4 97% 16 4 $2,484,000 $621,000 $572,000 7 5 107% 12 1 $195,500 $195,500 $195,500 4 3 106% 9 0 - - - 1 1 - - 0 - - - 0 0 - - 0 - - - 0 0 - - 0 - - - 0 0 - - 0 - - - 0 0 - - 0 - - - 0 0 - - 0 - - - 0 0 - - 0 - - - 1 1 - - 0 - - - 0 0 - - 0 - - - 0 0 - - 0 - - - 0 0 - - 0 - - - 0 0 - - 0 - - - 0 0 - - 0 - - - 0 0 - - 0 - - - 0 0 - - 0 - - - 0 0 - - 0 - - - 0 0 - - 0 - - - 0 0 - - 0 - - - 0 0 - - 0 - - - 0 0 - - 0 - - - 0 0 - - 0 - - - 0 0 - - 0 - - - 0 0 - - 0 - - - 0 0 - - 0 - - - 0 0 - - 0 - - - 0 0 - - 0 - - - 0 0 - - 1 1 1 1 2 3 4 5
- 20. Toronto Real Estate Board Market Watch, September 2017 SUMMARY OF EXISTING HOME TRANSACTIONS CO-OP APARTMENT, SEPTEMBER 2017 CITY OF TORONTO MUNICIPAL BREAKDOWN 20 Sales Dollar Volume Average Price Median Price New Listings Active Listings Avg. SP / LP Avg. DOM TREB Total City of Toronto Total Toronto West Toronto W01 Toronto W02 Toronto W03 Toronto W04 Toronto W05 Toronto W06 Toronto W07 Toronto W08 Toronto W09 Toronto W10 Toronto Central Toronto C01 Toronto C02 Toronto C03 Toronto C04 Toronto C06 Toronto C07 Toronto C08 Toronto C09 Toronto C10 Toronto C11 Toronto C12 Toronto C13 Toronto C14 Toronto C15 Toronto East Toronto E01 Toronto E02 Toronto E03 Toronto E04 Toronto E05 Toronto E06 Toronto E07 Toronto E08 Toronto E09 Toronto E10 Toronto E11 7 $3,139,500 $448,500 $415,000 16 14 105% 12 7 $3,139,500 $448,500 $415,000 15 12 105% 12 2 $460,000 $230,000 $230,000 4 4 97% 16 0 - - - 0 0 - - 0 - - - 1 2 - - 0 - - - 0 0 - - 0 - - - 0 0 - - 1 $180,000 $180,000 $180,000 0 0 90% 12 0 - - - 1 1 - - 0 - - - 0 0 - - 1 $280,000 $280,000 $280,000 1 0 102% 19 0 - - - 1 1 - - 0 - - - 0 0 - - 4 $2,484,000 $621,000 $572,000 7 5 107% 12 1 $415,000 $415,000 $415,000 0 0 101% 9 1 $725,000 $725,000 $725,000 1 0 112% 16 0 - - - 1 1 - - 0 - - - 0 0 - - 0 - - - 0 0 - - 0 - - - 0 0 - - 0 - - - 0 0 - - 1 $925,000 $925,000 $925,000 5 4 109% 5 1 $419,000 $419,000 $419,000 0 0 100% 16 0 - - - 0 0 - - 0 - - - 0 0 - - 0 - - - 0 0 - - 0 - - - 0 0 - - 0 - - - 0 0 - - 1 $195,500 $195,500 $195,500 4 3 106% 9 0 - - - 0 0 - - 0 - - - 1 1 - - 0 - - - 0 0 - - 0 - - - 1 1 - - 0 - - - 0 0 - - 0 - - - 0 0 - - 0 - - - 0 0 - - 0 - - - 0 0 - - 0 - - - 0 0 - - 1 $195,500 $195,500 $195,500 2 1 106% 9 0 - - - 0 0 - - 1 1 1 1 2 3 4 5
- 21. Toronto Real Estate Board Market Watch, September 2017 SUMMARY OF EXISTING HOME TRANSACTIONS DETACHED CONDOMINIUM, SEPTEMBER 2017 ALL TREB AREAS 21 Sales Dollar Volume Average Price Median Price New Listings Active Listings Avg. SP / LP Avg. DOM TREB Total Halton Region Burlington Halton Hills Milton Oakville Peel Region Brampton Caledon Mississauga City of Toronto Toronto West Toronto Central Toronto East York Region Aurora E. Gwillimbury Georgina King Markham Newmarket Richmond Hill Vaughan Whitchurch-Stouffville Durham Region Ajax Brock Clarington Oshawa Pickering Scugog Uxbridge Whitby Dufferin County Orangeville Simcoe County Adjala-Tosorontio Bradford West GwillimburyEssa Innisfil New Tecumseth 3 $2,693,000 $897,667 $875,000 17 26 98% 18 0 - - - 2 3 - - 0 - - - 2 3 - - 0 - - - 0 0 - - 0 - - - 0 0 - - 0 - - - 0 0 - - 1 $525,000 $525,000 $525,000 3 5 97% 7 0 - - - 1 2 - - 0 - - - 1 1 - - 1 $525,000 $525,000 $525,000 1 2 97% 7 0 - - - 1 1 - - 0 - - - 0 0 - - 0 - - - 0 0 - - 0 - - - 1 1 - - 1 $1,293,000 $1,293,000 $1,293,000 0 1 98% 35 0 - - - 0 0 - - 0 - - - 0 0 - - 0 - - - 0 0 - - 0 - - - 0 0 - - 1 $1,293,000 $1,293,000 $1,293,000 0 1 98% 35 0 - - - 0 0 - - 0 - - - 0 0 - - 0 - - - 0 0 - - 0 - - - 0 0 - - 0 - - - 0 0 - - 0 - - - 0 0 - - 0 - - - 0 0 - - 0 - - - 0 0 - - 0 - - - 0 0 - - 0 - - - 0 0 - - 0 - - - 0 0 - - 0 - - - 0 0 - - 0 - - - 0 0 - - 0 - - - 0 0 - - 0 - - - 0 0 - - 1 $875,000 $875,000 $875,000 11 16 97% 13 0 - - - 0 0 - - 0 - - - 0 0 - - 0 - - - 0 0 - - 0 - - - 0 0 - - 1 $875,000 $875,000 $875,000 11 16 97% 13 1 1 1 1 2 3 4 5
- 22. Toronto Real Estate Board Market Watch, September 2017 SUMMARY OF EXISTING HOME TRANSACTIONS DETACHED CONDOMINIUM, SEPTEMBER 2017 CITY OF TORONTO MUNICIPAL BREAKDOWN 22 Sales Dollar Volume Average Price Median Price New Listings Active Listings Avg. SP / LP Avg. DOM TREB Total City of Toronto Total Toronto West Toronto W01 Toronto W02 Toronto W03 Toronto W04 Toronto W05 Toronto W06 Toronto W07 Toronto W08 Toronto W09 Toronto W10 Toronto Central Toronto C01 Toronto C02 Toronto C03 Toronto C04 Toronto C06 Toronto C07 Toronto C08 Toronto C09 Toronto C10 Toronto C11 Toronto C12 Toronto C13 Toronto C14 Toronto C15 Toronto East Toronto E01 Toronto E02 Toronto E03 Toronto E04 Toronto E05 Toronto E06 Toronto E07 Toronto E08 Toronto E09 Toronto E10 Toronto E11 3 $2,693,000 $897,667 $875,000 17 26 98% 18 0 - - - 1 1 - - 0 - - - 0 0 - - 0 - - - 0 0 - - 0 - - - 0 0 - - 0 - - - 0 0 - - 0 - - - 0 0 - - 0 - - - 0 0 - - 0 - - - 0 0 - - 0 - - - 0 0 - - 0 - - - 0 0 - - 0 - - - 0 0 - - 0 - - - 0 0 - - 0 - - - 0 0 - - 0 - - - 0 0 - - 0 - - - 0 0 - - 0 - - - 0 0 - - 0 - - - 0 0 - - 0 - - - 0 0 - - 0 - - - 0 0 - - 0 - - - 0 0 - - 0 - - - 0 0 - - 0 - - - 0 0 - - 0 - - - 0 0 - - 0 - - - 0 0 - - 0 - - - 0 0 - - 0 - - - 0 0 - - 0 - - - 0 0 - - 0 - - - 1 1 - - 0 - - - 0 0 - - 0 - - - 0 0 - - 0 - - - 0 0 - - 0 - - - 0 0 - - 0 - - - 0 0 - - 0 - - - 0 0 - - 0 - - - 0 0 - - 0 - - - 0 0 - - 0 - - - 0 0 - - 0 - - - 0 0 - - 0 - - - 1 1 - - 1 1 1 1 2 3 4 5
- 23. Toronto Real Estate Board Market Watch, September 2017 SUMMARY OF EXISTING HOME TRANSACTIONS CO-OWNERSHIP APARTMENT, SEPTEMBER 2017 ALL TREB AREAS 23 Sales Dollar Volume Average Price Median Price New Listings Active Listings Avg. SP / LP Avg. DOM TREB Total Halton Region Burlington Halton Hills Milton Oakville Peel Region Brampton Caledon Mississauga City of Toronto Toronto West Toronto Central Toronto East York Region Aurora E. Gwillimbury Georgina King Markham Newmarket Richmond Hill Vaughan Whitchurch-Stouffville Durham Region Ajax Brock Clarington Oshawa Pickering Scugog Uxbridge Whitby Dufferin County Orangeville Simcoe County Adjala-Tosorontio Bradford West GwillimburyEssa Innisfil New Tecumseth 5 $1,630,777 $326,155 $315,777 6 7 100% 21 0 - - - 0 0 - - 0 - - - 0 0 - - 0 - - - 0 0 - - 0 - - - 0 0 - - 0 - - - 0 0 - - 0 - - - 0 0 - - 0 - - - 0 0 - - 0 - - - 0 0 - - 0 - - - 0 0 - - 5 $1,630,777 $326,155 $315,777 6 7 100% 21 0 - - - 1 4 - - 5 $1,630,777 $326,155 $315,777 5 3 100% 21 0 - - - 0 0 - - 0 - - - 0 0 - - 0 - - - 0 0 - - 0 - - - 0 0 - - 0 - - - 0 0 - - 0 - - - 0 0 - - 0 - - - 0 0 - - 0 - - - 0 0 - - 0 - - - 0 0 - - 0 - - - 0 0 - - 0 - - - 0 0 - - 0 - - - 0 0 - - 0 - - - 0 0 - - 0 - - - 0 0 - - 0 - - - 0 0 - - 0 - - - 0 0 - - 0 - - - 0 0 - - 0 - - - 0 0 - - 0 - - - 0 0 - - 0 - - - 0 0 - - 0 - - - 0 0 - - 0 - - - 0 0 - - 0 - - - 0 0 - - 0 - - - 0 0 - - 0 - - - 0 0 - - 0 - - - 0 0 - - 0 - - - 0 0 - - 0 - - - 0 0 - - 1 1 1 1 2 3 4 5
- 24. Toronto Real Estate Board Market Watch, September 2017 SUMMARY OF EXISTING HOME TRANSACTIONS CO-OWNERSHIP APARTMENT, SEPTEMBER 2017 CITY OF TORONTO MUNICIPAL BREAKDOWN 24 Sales Dollar Volume Average Price Median Price New Listings Active Listings Avg. SP / LP Avg. DOM TREB Total City of Toronto Total Toronto West Toronto W01 Toronto W02 Toronto W03 Toronto W04 Toronto W05 Toronto W06 Toronto W07 Toronto W08 Toronto W09 Toronto W10 Toronto Central Toronto C01 Toronto C02 Toronto C03 Toronto C04 Toronto C06 Toronto C07 Toronto C08 Toronto C09 Toronto C10 Toronto C11 Toronto C12 Toronto C13 Toronto C14 Toronto C15 Toronto East Toronto E01 Toronto E02 Toronto E03 Toronto E04 Toronto E05 Toronto E06 Toronto E07 Toronto E08 Toronto E09 Toronto E10 Toronto E11 5 $1,630,777 $326,155 $315,777 6 7 100% 21 5 $1,630,777 $326,155 $315,777 6 7 100% 21 0 - - - 1 4 - - 0 - - - 0 0 - - 0 - - - 0 0 - - 0 - - - 0 0 - - 0 - - - 0 0 - - 0 - - - 1 4 - - 0 - - - 0 0 - - 0 - - - 0 0 - - 0 - - - 0 0 - - 0 - - - 0 0 - - 0 - - - 0 0 - - 5 $1,630,777 $326,155 $315,777 5 3 100% 21 0 - - - 0 0 - - 1 $285,000 $285,000 $285,000 0 0 103% 30 0 - - - 0 0 - - 1 $315,777 $315,777 $315,777 3 3 96% 29 0 - - - 0 0 - - 0 - - - 0 0 - - 3 $1,030,000 $343,333 $335,000 2 0 100% 15 0 - - - 0 0 - - 0 - - - 0 0 - - 0 - - - 0 0 - - 0 - - - 0 0 - - 0 - - - 0 0 - - 0 - - - 0 0 - - 0 - - - 0 0 - - 0 - - - 0 0 - - 0 - - - 0 0 - - 0 - - - 0 0 - - 0 - - - 0 0 - - 0 - - - 0 0 - - 0 - - - 0 0 - - 0 - - - 0 0 - - 0 - - - 0 0 - - 0 - - - 0 0 - - 0 - - - 0 0 - - 0 - - - 0 0 - - 0 - - - 0 0 - - 1 1 1 1 2 3 4 5
- 25. Toronto Real Estate Board Market Watch, September 2017 FOCUS ON THE MLS HOME PRICE INDEX INDEX AND BENCHMARK PRICE, SEPTEMBER 2017 ALL TREB AREAS 25 Composite Single-Family Detached Single-Family Attached Townhouse Apartment Index Benchmark Yr./Yr. % Chg. Index Benchmark Yr./Yr. % Chg. Index Benchmark Yr./Yr. % Chg. Index Benchmark Yr./Yr. % Chg. Index Benchmark Yr./Yr. % Chg. TREB Total Halton Region Burlington Halton Hills Milton Oakville Peel Region Brampton Caledon Mississauga City of Toronto York Region Aurora East Gwillimbury Georgina King Markham Newmarket Richmond Hill Vaughan Whitchurch-Stouffville Durham Region Ajax Brock Clarington Oshawa Pickering Scugog Uxbridge Whitby Dufferin County Orangeville Simcoe County Adjala-Tosorontio Bradford West GwillimburyEssa Innisfil New Tecumseth 247.0 $750,800 12.22% 251.2 $930,500 8.56% 251.5 $707,500 7.80% 248.9 $552,200 16.47% 230.3 $460,200 24.22% 258.7 $834,200 13.37% 262.1 $966,700 12.30% 261.0 $667,700 10.64% 266.9 $492,300 15.24% 238.0 $440,100 18.35% 255.7 $694,600 12.49% 261.0 $883,600 10.97% 252.1 $604,800 8.20% 273.5 $502,700 15.06% 237.9 $391,600 18.01% 241.3 $714,200 9.78% 242.2 $788,000 9.89% 245.1 $555,400 9.18% 239.1 $384,300 15.28% 225.6 $456,100 16.83% 243.7 $722,400 10.17% 241.9 $865,700 9.46% 252.0 $609,100 9.33% 242.3 $401,100 16.77% 234.2 $477,000 20.72% 271.3 $992,400 14.67% 275.0 $1,162,500 12.89% 277.8 $775,700 10.63% 266.3 $576,200 15.68% 239.6 $460,300 18.32% 235.3 $668,200 12.15% 234.4 $827,600 9.12% 237.5 $608,000 9.40% 239.5 $514,200 16.55% 222.1 $381,800 22.44% 236.2 $599,100 12.05% 230.6 $673,500 10.23% 235.4 $552,100 9.95% 245.9 $449,600 22.77% 217.0 $323,900 22.05% 213.6 $784,400 11.89% 213.3 $810,800 11.97% 243.3 $601,000 13.22% - - - 232.3 $564,700 25.57% 236.3 $701,500 12.26% 243.1 $971,000 7.19% 240.1 $662,200 8.35% 237.1 $533,000 14.43% 222.9 $392,900 22.47% 243.0 $787,700 15.28% 249.3 $1,093,900 6.63% 253.6 $845,400 8.70% 252.3 $608,700 17.95% 233.7 $479,800 25.98% 265.4 $896,000 6.20% 273.5 $1,040,800 4.87% 269.0 $778,300 2.83% 242.9 $621,900 16.28% 212.4 $466,900 21.51% 278.1 $920,200 11.46% 280.8 $1,060,700 10.42% 277.5 $715,700 8.70% 257.7 $704,600 20.25% 245.6 $513,400 19.57% 237.0 $809,800 8.92% 241.3 $860,000 9.14% 240.5 $503,000 5.76% - - - - - - 249.7 $475,800 14.38% 255.9 $482,500 14.29% 262.8 $518,100 13.18% - - - - - - 237.7 $994,400 6.02% 238.9 $993,800 5.80% 239.7 $561,400 0.46% - - - 226.0 $618,200 24.79% 269.1 $932,500 4.75% 293.0 $1,205,400 3.06% 276.5 $826,900 2.48% 231.7 $611,600 14.99% 201.1 $481,400 20.35% 246.2 $725,500 6.44% 247.7 $834,900 4.82% 244.1 $574,900 1.29% 251.5 $522,200 21.20% 259.0 $436,300 22.34% 290.0 $1,041,900 6.89% 313.5 $1,332,300 5.66% 288.9 $878,000 4.26% 233.7 $591,800 10.65% 218.9 $445,500 21.95% 252.8 $914,400 5.64% 248.2 $1,031,700 3.63% 258.2 $782,200 0.39% 267.7 $727,900 17.88% 214.7 $495,500 23.68% 268.3 $924,600 2.44% 267.4 $959,300 1.33% 241.9 $664,400 5.45% 227.4 $408,300 20.38% 252.2 $560,300 19.02% 234.3 $547,200 11.04% 231.4 $601,300 10.88% 238.4 $476,100 8.71% 235.4 $373,300 13.72% 229.5 $391,300 14.52% 237.5 $585,300 8.50% 237.4 $636,900 7.91% 241.7 $521,600 8.73% 227.3 $415,500 9.33% 214.0 $346,800 19.42% 199.3 $362,500 19.48% 200.5 $365,900 19.56% - - - - - - - - - 222.8 $470,300 7.58% 216.6 $521,600 7.02% 219.7 $419,700 2.14% 256.8 $402,300 19.61% 205.6 $304,800 17.02% 236.7 $450,700 12.50% 230.7 $492,300 11.56% 248.6 $416,100 11.93% 247.2 $307,000 20.82% 218.1 $255,700 10.71% 242.7 $650,900 11.28% 239.0 $744,600 11.06% 247.2 $576,900 11.30% 232.6 $415,300 9.25% 266.0 $494,400 14.80% 233.3 $609,100 23.31% 241.2 $624,800 24.07% 220.3 $461,100 18.12% - - - - - - 232.9 $711,900 19.68% 231.5 $714,900 19.58% 230.9 $566,600 22.23% - - - - - - 235.4 $613,000 11.04% 236.6 $680,500 10.66% 236.8 $521,700 8.92% 209.9 $382,200 6.44% 215.4 $390,500 14.64% 243.8 $558,800 19.33% 254.8 $580,700 18.95% 239.5 $448,800 20.59% - - - - - - 243.8 $558,800 19.33% 254.8 $580,700 18.95% 239.5 $448,800 20.59% - - - - - - 249.2 $559,400 13.07% 245.1 $569,800 13.05% 250.0 $468,400 13.95% - - - - - - 238.0 $716,200 13.28% 238.0 $717,800 13.28% - - - - - - - - - 261.4 $637,100 11.42% 246.6 $674,700 11.74% 262.9 $546,400 13.08% - - - - - - 245.6 $469,200 12.20% 245.8 $490,100 10.77% 245.8 $382,800 14.43% - - - - - - 259.7 $502,700 15.12% 259.7 $501,900 14.81% 260.3 $398,000 20.57% - - - - - - 226.1 $537,200 13.28% 221.4 $561,100 11.48% 231.9 $420,300 13.12% - - - - - -
- 26. Toronto Real Estate Board Market Watch, September 2017 FOCUS ON THE MLS HOME PRICE INDEX INDEX AND BENCHMARK PRICE, SEPTEMBER 2017 CITY OF TORONTO 26 Composite Single-Family Detached Single-Family Attached Townhouse Apartment Index Benchmark Yr./Yr. % Chg. Index Benchmark Yr./Yr. % Chg. Index Benchmark Yr./Yr. % Chg. Index Benchmark Yr./Yr. % Chg. Index Benchmark Yr./Yr. % Chg. TREB Total City of Toronto Toronto W01 Toronto W02 Toronto W03 Toronto W04 Toronto W05 Toronto W06 Toronto W07 Toronto W08 Toronto W09 Toronto W10 Toronto C01 Toronto C02 Toronto C03 Toronto C04 Toronto C06 Toronto C07 Toronto C08 Toronto C09 Toronto C10 Toronto C11 Toronto C12 Toronto C13 Toronto C14 Toronto C15 Toronto E01 Toronto E02 Toronto E03 Toronto E04 Toronto E05 Toronto E06 Toronto E07 Toronto E08 Toronto E09 Toronto E10 Toronto E11 247.0 $750,800 12.22% 251.2 $930,500 8.56% 251.5 $707,500 7.80% 248.9 $552,200 16.47% 230.3 $460,200 24.22% 243.0 $787,700 15.28% 249.3 $1,093,900 6.63% 253.6 $845,400 8.70% 252.3 $608,700 17.95% 233.7 $479,800 25.98% 219.1 $883,000 14.23% 212.4 $1,108,300 3.91% 230.2 $887,600 4.12% 232.7 $492,500 12.47% 217.4 $491,500 24.09% 250.0 $889,200 4.56% 243.0 $1,027,900 -1.58% 278.8 $854,500 0.14% 242.1 $570,400 10.45% 234.7 $503,200 25.51% 263.0 $678,800 10.97% 266.5 $724,500 10.12% 263.0 $673,600 7.65% 231.5 $472,200 12.76% 234.1 $403,000 25.39% 236.6 $605,900 15.41% 240.9 $758,700 10.10% 228.7 $661,300 7.62% 213.2 $503,800 15.43% 232.9 $341,100 32.18% 220.9 $524,300 15.90% 235.2 $780,100 8.69% 214.6 $626,600 7.84% 214.5 $389,500 21.60% 219.5 $288,400 33.84% 194.2 $568,800 9.29% 255.7 $816,400 4.58% 211.3 $640,300 4.55% 290.1 $862,800 25.42% 158.9 $402,600 20.56% 217.1 $930,700 4.48% 230.0 $996,800 2.59% 208.5 $854,900 1.81% 0.0 $0 -100.00% 139.2 $564,500 19.69% 200.7 $800,200 13.33% 202.6 $1,059,000 3.37% 202.9 $751,700 1.35% 232.3 $558,700 27.92% 197.1 $410,400 23.73% 222.2 $559,300 14.60% 217.1 $809,600 5.59% 197.9 $569,100 6.40% 245.3 $638,200 21.26% 224.7 $288,100 29.96% 227.8 $524,700 18.65% 232.8 $698,400 8.99% 237.5 $607,800 12.51% 206.9 $440,600 20.15% 227.0 $315,300 36.91% 255.8 $633,700 20.26% 266.3 $1,008,500 10.18% 257.6 $901,700 8.10% 254.8 $724,500 14.62% 254.7 $530,300 22.39% 245.8 $1,175,700 9.10% 219.6 $1,754,500 5.53% 256.3 $1,344,200 8.23% 251.7 $1,124,000 5.40% 241.9 $689,100 12.30% 270.2 $1,412,700 11.10% 253.3 $1,556,700 6.43% 268.9 $997,100 7.95% - - - 299.8 $788,600 23.22% 240.7 $1,485,400 12.11% 243.8 $1,717,700 8.55% 250.9 $1,174,600 9.28% 283.1 $1,040,600 30.46% 220.0 $508,800 32.29% 268.1 $1,044,000 12.84% 282.1 $1,204,900 3.03% 211.1 $780,900 -0.28% 230.5 $618,100 17.24% 256.1 $566,400 29.21% 258.3 $893,600 16.30% 317.8 $1,453,800 7.95% 230.3 $824,100 6.72% 229.3 $646,300 17.41% 225.2 $549,900 29.72% 237.7 $621,800 18.55% 254.2 $1,483,100 6.32% 251.8 $1,201,200 3.92% 240.7 $628,600 8.28% 236.4 $511,000 21.17% 160.4 $1,135,400 15.48% 131.6 $1,653,100 2.89% 142.3 $1,158,000 -0.56% 261.3 $1,431,200 22.50% 177.8 $589,100 26.64% 252.6 $986,200 15.08% 249.4 $1,539,800 4.88% 239.9 $1,185,100 2.30% 243.3 $710,200 12.74% 256.8 $613,200 21.88% 242.6 $858,500 20.64% 198.5 $1,352,200 4.20% 219.6 $972,400 3.20% 209.1 $362,200 14.76% 279.7 $406,100 32.69% 215.9 $1,842,000 11.98% 202.4 $2,169,200 4.49% 268.5 $1,123,900 13.82% 213.1 $852,600 15.44% 254.4 $797,600 32.09% 237.8 $861,100 17.78% 262.8 $1,401,500 10.51% 232.9 $743,100 4.96% 237.1 $685,400 20.42% 214.7 $432,300 30.76% 259.5 $848,700 20.47% 312.7 $1,691,700 8.35% 259.9 $1,265,600 9.89% 305.5 $822,800 21.86% 238.0 $599,400 28.37% 248.2 $805,500 15.76% 314.2 $1,475,300 7.90% 264.8 $860,900 4.66% 282.6 $676,600 23.24% 207.4 $482,300 30.11% 297.9 $930,200 19.98% 298.1 $1,051,900 18.72% 305.2 $962,700 19.69% 345.3 $631,200 21.20% 260.3 $617,400 23.95% 259.5 $974,100 14.57% 226.5 $1,032,000 14.39% 273.4 $915,500 17.24% 290.1 $871,000 18.50% 238.3 $651,500 4.98% 239.6 $737,100 7.98% 249.7 $841,800 7.44% 227.2 $744,000 7.27% - - - 208.2 $304,100 14.84% 242.5 $598,900 12.69% 239.2 $705,200 3.59% 248.8 $599,500 13.66% 243.9 $528,700 20.98% 249.7 $383,100 31.42% 248.4 $651,800 11.29% 259.7 $914,600 0.89% 253.9 $699,600 0.24% 260.6 $566,700 12.47% 227.7 $447,200 30.79% 253.4 $706,700 9.89% 257.3 $734,900 9.96% 270.5 $643,400 16.54% 237.7 $587,800 10.46% 218.7 $462,600 10.01% 263.1 $644,900 16.11% 281.5 $922,700 5.59% 277.6 $725,900 10.07% 266.4 $577,100 12.31% 245.1 $419,700 30.93% 251.5 $606,900 21.50% 245.7 $765,900 8.43% 231.0 $598,800 14.41% 253.3 $517,000 26.90% 261.2 $416,700 49.86% 238.9 $571,200 16.03% 242.8 $689,400 2.88% 231.4 $566,000 7.13% 278.1 $516,800 26.07% 230.6 $432,500 32.38% 261.2 $732,100 14.41% 252.2 $808,100 10.28% 247.3 $641,300 13.18% 307.4 $536,700 26.24% 241.7 $389,600 50.59% 256.6 $561,300 20.70% 261.4 $727,100 9.42% 253.3 $573,700 8.95% 202.0 $396,400 13.67% 294.6 $439,700 60.11%
- 27. Toronto Real Estate Board Market Watch, September 2017 HISTORIC ANNUAL STATISTICS 27 Year Sales Average Price 2005 2006 2007 2008 2009 2010 2011 2012 2013 2014 2015 84,145 $335,907 83,084 $351,941 93,193 $376,236 74,552 $379,347 87,308 $395,460 85,545 $431,276 89,096 $465,014 85,496 $497,130 87,049 $522,958 92,782 $566,624 101,213 $622,121 2016 MONTHLY STATISTICS NOTES 1 - Sales, dollar volume, average sale prices and median sale prices are based on firm transactions entered into the TREB MLS® system between the first and last day of the month/period being reported. 2 - New listings entered into the TREB MLS® system between the first and last day of the month/period being reported. 3 - Active listings at the end of the last day of the month/period being reported. 4 - Ratio of the average selling price to the average listing price for firm transactions entered into the TREB MLS® system between the first and last day of the month/period being reported. 5 - Average number of days on the market for firm transactions entered into the TREB MLS® system between the first and last day of the month/period being reported. 6 - Due to past changes to TREB's service area, caution should be exercised when making historical comparisons. 7 - Past monthly and year-to-date figures are revised on a monthly basis. 8 - SNLR = Sales-to-New Listings Ratio. Calculated using a 12-month moving average (sales/new listings). 9 - Mos. Inv. = Months of Inventory. Calculated using a 12-month moving average (active listings/sales). 2017 MONTHLY STATISTICS *For historic annual sales and average price data over a longer time frame go to: January February March April May June July August September October November December Year to Date 5,155 $768,351 7,956 $876,302 11,965 $916,257 11,480 $918,285 10,083 $863,484 7,911 $792,528 5,888 $745,598 6,335 $732,039 6,379 $775,546 - - - - - - 73,152 $820,932 January February March April May June July August September October November December Annual 4,640 $630,193 7,582 $685,628 10,260 $688,011 12,016 $739,762 12,790 $752,100 12,725 $747,018 9,929 $710,471 9,748 $710,978 9,830 $756,021 9,715 $762,691 8,503 $777,091 5,305 $730,124 113,043 $729,835 1,6,7 1,7 1,7 http://www.torontorealestateboard.com/market_news/market_watch/historic_stats/p df/TREB_historic_statistics.pdf Copyright® 2017 Toronto Real Estate Board $839,19273,152