March 2017 market watch
•
0 likes•116 views

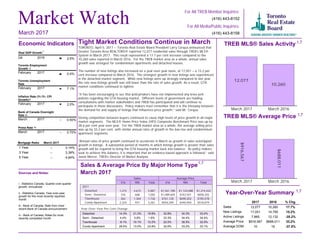
Toronto real estate market conditions remained tight in March 2017, with sales up 17.7% and new listings up 15.2% compared to March 2016. While new listings increased, the rate of growth was lower than the rate of sales growth, contributing to ongoing tight market conditions. The average selling price increased 33.2% year-over-year to $916,567. Price growth continued to accelerate as demand outpaced supply. Policymakers were urged to follow an evidence-based approach to balancing the market through increased listings growth over an extended period.

Recommended
Recommended
More Related Content
What's hot
What's hot (14)
Similar to March 2017 market watch
Similar to March 2017 market watch (18)
Recently uploaded
Recently uploaded (20)
March 2017 market watch
- 1. Toronto Employment Growth February 2017 0.4% Month March 2017 1 Year 3 Year 5 Year 3.14% 3.39% 4.64% March 2017 1 Year 3 Year 5 Year -- -- -- Market Watch For All TREB Member Inquiries: (416) 443-8158 For All Media/Public Inquiries: (416) 443-8152 Tight Market Conditions Continue in March TORONTO, April 5, 2017 – Toronto Real Estate Board President Larry Cerqua announced that Greater Toronto Area REALTORS® reported 12,077 residential sales through TREB’s MLS® System in March 2017. This result represented a 17.7 per cent increase compared to the 10,260 sales reported in March 2016. For the TREB market area as a whole, annual sales growth was strongest for condominium apartments and detached houses. The number of new listings also increased on a year-over-year basis, at 17,051 – a 15.2 per cent increase compared to March 2016. The strongest growth in new listings was experienced in the detached market segment. While new listings were up strongly compared to last year, the rate new listings growth was still lower than the rate of sales growth. As a result, GTA market conditions continued to tighten. “It has been encouraging to see that policymakers have not implemented any knee-jerk policies regarding the GTA housing market. Different levels of government are holding consultations with market stakeholders and TREB has participated and will continue to participate in these discussions. Policy makers must remember that it is the interplay between the demand for and supply of listings that influences price growth,” said Mr. Cerqua. Strong competition between buyers continued to cause high levels of price growth in all major market segments. The MLS® Home Price Index (HPI) Composite Benchmark Price was up by 28.6 per cent year-over-year. For the TREB market area as a whole, the average selling price was up by 33.2 per cent, with similar annual rates of growth in the low-rise and condominium apartment segments. “Annual rates of price growth continued to accelerate in March as growth in sales outstripped growth in listings. A substantial period of months in which listings growth is greater than sales growth will be required to bring the GTA housing market back into balance. As policy makers seek to achieve this balance, it is important that an evidence-based approach is followed,” said Jason Mercer, TREB’s Director of Market Analysis. TREB MLS® Sales Activity 12,077 10,260 March 2017 March 2016 TREB MLS® Average Price $916,567 $688,011 March 2017 March 2016 Year-Over-Year Summary 2017 2016 % Chg. Sales New Listings Active Listings Average Price Average DOM 12,077 10,260 17.7% 17,051 14,795 15.2% 7,865 12,132 -35.2% $916,567 $688,011 33.2% 10 16 -37.5% Sources and Notes: i - Statistics Canada, Quarter-over-quarter growth, annualized ii - Statistics Canada, Year-over-year growth for the most recently reported month iii - Bank of Canada, Rate from most recent Bank of Canada announcement iv - Bank of Canada, Rates for most recently completed month Real GDP Growth Q4 2016 2.6% Toronto Unemployment Rate February 2017 7.1% Inflation Rate (Yr./Yr. CPI Growth) February 2017 2.0% Bank of Canada Overnight Rate March 2017 -- 0.50% Prime Rate March 2017 -- 2.70% Economic Indicators Metrics Sales Average Price 416 905 Total 416 905 Total 2017 Detached Semi - Detached Townhouse Condo Apartment 1,215 4,672 5,887 $1,561,780 $1,124,088 $1,214,422 334 668 1,002 $1,089,605 $742,501 $858,202 362 1,364 1,726 $761,128 $690,202 $705,078 2,324 937 3,261 $550,299 $440,950 $518,879 Sales & Average Price By Major Home Type March 2017 March 2017 i ii ii iii iv Detached Semi - Detached Townhouse Condo Apartment 32.8% 34.3% 33.4% 33.3% 34.4% 34.4% 22.0% 38.5% 32.9% 32.0% 33.2% 33.1% Detached Semi - Detached Townhouse Condo Apartment 14.3% 21.3% 19.8% 4.4% 0.8% 1.9% -8.1% 19.1% 12.2% 29.0% 13.0% 23.9% 1,7 1,7 1,7 1,7 Year-Over-Year Per Cent Change Mortgage Rates
- 2. Toronto Real Estate Board Market Watch, March 2017 SALES BY PRICE RANGE AND HOUSE TYPE MARCH 2017 2 Price Range Detached Semi-Detached Att/Row/Twnhouse Condo Townhouse Condo Apt Link Co-op Apt Det Condo Co-ownership Apt Total $0 to $99,999 $100,000 to $199,999 $200,000 to $299,999 $300,000 to $399,999 $400,000 to $499,999 $500,000 to $599,999 $600,000 to $699,999 $700,000 to $799,999 $800,000 to $899,999 $900,000 to $999,999 $1,000,000 to $1,249,999 $1,250,000 to $1,499,999 $1,500,000 to $1,749,999 $1,750,000 to $1,999,999 $2,000,000+ 0 0 0 0 6 0 0 0 0 6 1 0 0 3 33 0 0 0 0 37 9 0 0 32 197 0 3 0 2 243 38 11 2 53 876 0 2 0 3 985 117 43 35 158 857 16 1 2 0 1,229 309 51 119 173 506 30 2 4 1 1,195 458 206 273 183 323 29 0 0 1 1,473 568 215 163 88 175 18 2 4 0 1,233 745 170 117 39 105 18 0 1 0 1,195 577 111 82 22 53 26 0 1 0 872 1,022 113 91 22 60 23 1 1 0 1,333 698 44 43 7 30 10 0 0 0 832 486 11 6 6 13 0 0 0 0 522 268 6 4 1 11 0 0 0 0 290 591 21 2 2 16 0 0 0 0 632 Price Range Detached Semi-Detached Att/Row/Twnhouse Condo Townhouse Condo Apt Link Co-op Apt Det Condo Co-ownership Apt Total $0 to $99,999 $100,000 to $199,999 $200,000 to $299,999 $300,000 to $399,999 $400,000 to $499,999 $500,000 to $599,999 $600,000 to $699,999 $700,000 to $799,999 $800,000 to $899,999 $900,000 to $999,999 $1,000,000 to $1,249,999 $1,250,000 to $1,499,999 $1,500,000 to $1,749,999 $1,750,000 to $1,999,999 $2,000,000+ 0 0 0 0 15 0 0 0 0 15 2 0 0 12 119 0 3 0 2 138 25 0 0 86 675 0 6 0 6 798 109 40 18 197 2,197 2 4 0 5 2,572 327 84 128 388 1,796 33 1 4 1 2,762 710 208 320 357 1,021 64 2 6 1 2,689 1,059 468 538 319 586 50 0 3 1 3,024 1,295 414 317 148 331 32 2 5 0 2,544 1,422 316 241 67 184 51 0 1 0 2,282 1,170 198 165 35 82 53 0 1 0 1,704 1,786 195 164 39 111 47 1 1 0 2,344 1,371 77 67 24 59 18 1 1 0 1,618 929 21 9 10 27 0 0 0 0 996 534 12 5 1 16 0 0 0 0 568 1,109 36 2 5 32 0 1 0 0 1,185 SALES BY PRICE RANGE AND HOUSE TYPE YEAR-TO-DATE, 2017 Total Sales Share of Total Sales Average Price 5,887 1,002 937 789 3,261 170 11 13 7 12,077 48.7% 8.3% 7.8% 6.5% 27.0% 1.4% 0.1% 0.1% 0.1% 100.0% $1,214,422 $858,202 $788,366 $606,166 $518,879 $787,797 $481,327 $701,100 $399,400 $916,567 Total Sales Share of Total Sales Average Price 11,848 2,069 1,974 1,688 7,251 350 21 22 16 25,239 46.9% 8.2% 7.8% 6.7% 28.7% 1.4% 0.1% 0.1% 0.1% 100.0% $1,184,484 $822,010 $752,623 $576,324 $489,551 $787,845 $507,957 $686,409 $331,050 $873,631 1,7 1,7
- 3. Toronto Real Estate Board Market Watch, March 2017 Number of Sales Dollar Volume Average Price Median Price New Listings SNLR (Trend) Active Listings Mos. Inv. (Trend) Avg. SP / LP Avg. DOM TREB Total Halton Region Burlington Halton Hills Milton Oakville Peel Region Brampton Caledon Mississauga City of Toronto Toronto West Toronto Central Toronto East York Region Aurora E. Gwillimbury Georgina King Markham Newmarket Richmond Hill Vaughan Whitchurch-Stouffville Durham Region Ajax Brock Clarington Oshawa Pickering Scugog Uxbridge Whitby Dufferin County Orangeville Simcoe County Adjala-Tosorontio Bradford West GwillimburyEssa Innisfil New Tecumseth 12,077 $11,069,381,891 916,567 $765,000 17,051 75.5% 7,865 1.0 111% 10 1,209 $1,226,844,253 1,014,760 $860,000 1,663 80.8% 798 0.9 107% 12 320 $278,504,215 870,326 $800,750 393 83.4% 172 0.9 105% 13 129 $94,148,541 729,834 $673,000 139 82.3% 83 1.1 105% 15 272 $218,322,450 802,656 $768,500 376 84.2% 142 0.7 112% 9 488 $635,869,047 1,303,010 $1,237,500 755 77.3% 401 1.0 108% 12 2,382 $1,882,378,275 790,251 $731,750 3,358 76.4% 1,416 0.8 110% 8 1,108 $847,792,426 765,156 $725,000 1,606 75.8% 607 0.7 109% 7 119 $112,122,450 942,205 $885,000 186 71.4% 126 1.5 106% 14 1,155 $922,463,399 798,670 $715,000 1,566 77.6% 683 0.9 111% 8 4,258 $3,829,866,009 899,452 $680,000 5,740 73.6% 2,809 1.2 112% 11 1,111 $863,871,149 777,562 $668,000 1,457 74.2% 749 1.2 112% 12 2,166 $2,174,174,475 1,003,774 $629,995 2,951 72.3% 1,507 1.3 110% 11 981 $791,820,385 807,156 $805,000 1,332 75.7% 553 0.8 118% 8 2,402 $2,840,138,272 1,182,406 $1,072,500 3,847 71.6% 1,847 1.0 113% 9 152 $177,625,412 1,168,588 $1,057,500 259 72.4% 129 0.8 112% 11 88 $99,551,200 1,131,264 $1,050,000 136 75.9% 73 1.3 115% 9 208 $150,266,975 722,437 $662,500 329 74.8% 137 1.0 111% 9 56 $96,750,615 1,727,690 $1,552,500 94 62.1% 75 2.3 105% 28 632 $753,424,108 1,192,127 $1,133,400 959 71.0% 433 1.0 115% 9 248 $260,563,086 1,050,658 $1,031,500 411 77.9% 188 0.6 116% 7 424 $570,179,999 1,344,764 $1,284,995 686 69.5% 320 1.0 113% 9 496 $613,663,689 1,237,225 $1,125,000 812 71.3% 401 1.0 111% 9 98 $118,113,188 1,205,237 $1,058,500 161 73.6% 91 1.0 110% 10 1,349 $941,461,957 697,896 $660,000 1,800 81.6% 679 0.6 115% 7 216 $161,689,558 748,563 $730,200 300 79.1% 120 0.5 116% 6 17 $9,075,100 533,829 $480,000 26 78.0% 23 2.1 102% 16 227 $142,511,823 627,805 $610,000 309 82.9% 121 0.7 115% 7 396 $239,060,663 603,689 $575,000 521 83.0% 162 0.5 116% 7 154 $126,079,049 818,695 $767,500 186 80.4% 65 0.7 114% 7 37 $25,315,896 684,213 $600,000 50 78.1% 33 1.2 104% 19 43 $40,168,300 934,147 $820,000 55 81.6% 32 1.6 106% 19 259 $197,561,568 762,786 $751,908 353 82.6% 123 0.5 116% 6 76 $45,325,442 596,387 $560,000 89 89.6% 35 0.6 106% 11 76 $45,325,442 596,387 $560,000 89 89.6% 35 0.6 106% 11 401 $303,367,683 756,528 $652,000 554 80.6% 281 1.1 105% 13 17 $13,793,800 811,400 $615,000 25 79.9% 28 2.0 98% 36 122 $118,928,949 974,827 $900,000 167 78.1% 68 0.8 109% 8 54 $32,558,301 602,932 $542,500 69 82.3% 41 1.2 101% 23 97 $70,482,233 726,621 $640,000 164 77.4% 89 1.2 105% 14 111 $67,604,400 609,049 $561,000 129 86.4% 55 1.0 103% 11 SUMMARY OF EXISTING HOME TRANSACTIONS ALL HOME TYPES, MARCH 2017 ALL TREB AREAS 3 1 1 1 2 5498 3
- 4. Toronto Real Estate Board Market Watch, March 2017 SUMMARY OF EXISTING HOME TRANSACTIONS ALL HOME TYPES, MARCH 2017 CITY OF TORONTO MUNICIPAL BREAKDOWN 4 Number of Sales Dollar Volume Average Price Median Price New Listings SNLR (Trend) Active Listings Mos. Inv. (Trend) Avg. SP / LP Avg. DOM TREB Total City of Toronto Total Toronto West Toronto W01 Toronto W02 Toronto W03 Toronto W04 Toronto W05 Toronto W06 Toronto W07 Toronto W08 Toronto W09 Toronto W10 Toronto Central Toronto C01 Toronto C02 Toronto C03 Toronto C04 Toronto C06 Toronto C07 Toronto C08 Toronto C09 Toronto C10 Toronto C11 Toronto C12 Toronto C13 Toronto C14 Toronto C15 Toronto East Toronto E01 Toronto E02 Toronto E03 Toronto E04 Toronto E05 Toronto E06 Toronto E07 Toronto E08 Toronto E09 Toronto E10 Toronto E11 12,077 $11,069,381,891 $916,567 $765,000 17,051 75.5% 7,865 1.0 111% 10 4,258 $3,829,866,009 $899,452 $680,000 5,740 73.6% 2,809 1.2 112% 11 1,111 $863,871,149 $777,562 $668,000 1,457 74.2% 749 1.2 112% 12 60 $51,439,311 $857,322 $595,500 82 76.5% 40 1.0 111% 10 105 $100,864,361 $960,613 $900,000 116 78.1% 40 0.8 120% 8 68 $49,315,782 $725,232 $776,750 91 76.1% 45 0.8 118% 9 106 $80,547,185 $759,879 $742,500 167 71.1% 81 1.2 110% 15 136 $78,118,000 $574,397 $485,000 168 71.3% 96 1.5 109% 20 207 $138,113,042 $667,213 $550,000 275 69.3% 177 1.6 110% 13 33 $40,005,989 $1,212,303 $1,155,000 40 76.4% 17 0.9 120% 7 226 $225,816,750 $999,189 $763,000 288 78.6% 143 1.1 110% 10 56 $40,479,777 $722,853 $659,750 85 76.7% 30 1.0 117% 8 114 $59,170,952 $519,043 $409,500 145 74.3% 80 1.1 108% 15 2,166 $2,174,174,475 $1,003,774 $629,995 2,951 72.3% 1,507 1.3 110% 11 682 $458,274,729 $671,957 $565,000 921 73.7% 461 1.4 108% 11 101 $142,236,988 $1,408,287 $1,150,000 166 57.3% 147 2.3 106% 19 67 $115,300,074 $1,720,897 $1,230,000 83 68.1% 44 1.3 110% 15 100 $182,982,158 $1,829,822 $1,861,625 144 67.1% 86 1.2 116% 9 62 $68,667,800 $1,107,545 $892,500 82 74.4% 33 0.9 117% 11 157 $158,604,833 $1,010,222 $647,000 238 72.7% 114 1.2 111% 8 260 $175,807,093 $676,181 $598,500 349 72.5% 184 1.3 108% 12 24 $45,342,788 $1,889,283 $984,350 45 70.9% 41 1.6 103% 14 88 $73,616,695 $836,553 $574,000 90 74.9% 44 1.0 113% 10 54 $50,640,386 $937,785 $430,000 65 80.9% 22 0.8 115% 9 47 $163,655,206 $3,482,026 $3,510,000 66 68.2% 53 1.8 104% 18 90 $107,477,841 $1,194,198 $925,000 131 78.6% 64 0.9 118% 8 230 $254,409,845 $1,106,130 $623,000 294 72.2% 108 1.3 109% 9 204 $177,158,039 $868,422 $546,900 277 74.9% 106 1.1 115% 7 981 $791,820,385 $807,156 $805,000 1,332 75.7% 553 0.8 118% 8 74 $72,645,441 $981,695 $966,500 90 80.6% 35 0.6 122% 6 67 $75,061,744 $1,120,325 $1,053,000 83 74.3% 41 0.8 117% 12 96 $97,924,297 $1,020,045 $995,500 128 76.6% 52 0.6 120% 8 134 $94,636,695 $706,244 $778,500 170 75.7% 63 0.8 118% 8 114 $96,211,105 $843,957 $706,500 162 75.0% 65 0.9 118% 9 45 $43,167,900 $959,287 $775,000 77 67.4% 39 0.8 112% 8 103 $68,092,297 $661,090 $480,000 147 72.4% 59 1.0 119% 7 73 $59,660,718 $817,270 $807,000 87 77.8% 29 0.8 113% 8 119 $75,491,191 $634,380 $560,000 167 78.4% 73 0.9 119% 6 71 $59,614,131 $839,636 $865,900 114 71.3% 56 1.0 118% 12 85 $49,314,866 $580,175 $605,000 107 79.3% 41 0.8 115% 7 1 1 1 2 8 3 9 4 5
- 5. Toronto Real Estate Board Market Watch, March 2017 SUMMARY OF EXISTING HOME TRANSACTIONS ALL HOME TYPES, YEAR-TO-DATE 2017 ALL TREB AREAS 5 Number of Sales Dollar Volume Average Price Median Price New Listings Avg. SP / LP Avg. DOM TREB Total Halton Region Burlington Halton Hills Milton Oakville Peel Region Brampton Caledon Mississauga City of Toronto Toronto West Toronto Central Toronto East York Region Aurora E. Gwillimbury Georgina King Markham Newmarket Richmond Hill Vaughan Whitchurch-Stouffville Durham Region Ajax Brock Clarington Oshawa Pickering Scugog Uxbridge Whitby Dufferin County Orangeville Simcoe County Adjala-Tosorontio Bradford West GwillimburyEssa Innisfil New Tecumseth 25,239 $22,049,562,186 $873,631 $720,000 34,168 109% 12 2,461 $2,420,327,440 $983,473 $840,000 3,262 106% 14 651 $540,682,870 $830,542 $763,000 790 104% 16 257 $182,719,529 $710,971 $662,500 320 104% 17 542 $423,732,346 $781,794 $750,000 701 109% 10 1,011 $1,273,192,695 $1,259,340 $1,175,000 1,451 106% 14 5,072 $3,808,606,325 $750,908 $693,500 6,681 107% 11 2,412 $1,765,085,870 $731,793 $695,000 3,161 106% 10 218 $202,770,106 $930,138 $870,000 340 104% 18 2,442 $1,840,750,349 $753,788 $670,250 3,180 109% 11 9,047 $7,696,409,714 $850,714 $625,000 12,194 109% 14 2,336 $1,699,296,239 $727,438 $610,000 3,157 109% 16 4,614 $4,421,735,433 $958,330 $590,000 6,336 108% 14 2,097 $1,575,378,042 $751,253 $732,000 2,701 114% 12 4,924 $5,614,125,112 $1,140,155 $1,025,000 7,278 110% 12 320 $359,554,688 $1,123,608 $1,035,000 497 111% 11 141 $149,187,589 $1,058,068 $976,000 222 112% 13 383 $261,732,010 $683,373 $630,000 528 109% 13 139 $218,949,236 $1,575,174 $1,388,000 211 102% 28 1,244 $1,425,555,709 $1,145,945 $1,050,944 1,834 112% 11 492 $503,566,666 $1,023,509 $1,002,000 727 114% 8 938 $1,206,423,751 $1,286,166 $1,253,000 1,368 111% 11 1,084 $1,272,509,993 $1,173,902 $1,073,750 1,607 109% 11 183 $216,645,470 $1,183,855 $1,030,800 284 108% 16 2,775 $1,855,994,433 $668,827 $637,000 3,507 111% 10 448 $319,360,341 $712,858 $692,500 571 113% 9 35 $17,288,590 $493,960 $425,000 49 100% 31 467 $278,451,145 $596,255 $570,000 602 111% 10 815 $476,983,287 $585,256 $560,000 1,016 113% 8 318 $243,871,725 $766,892 $725,900 382 110% 10 85 $58,265,516 $685,477 $600,000 115 102% 21 78 $73,376,000 $940,718 $817,500 95 102% 34 529 $388,397,829 $734,211 $720,000 677 113% 8 152 $82,628,616 $543,609 $530,000 185 105% 13 152 $82,628,616 $543,609 $530,000 185 105% 13 808 $571,470,546 $707,266 $628,250 1,061 104% 16 38 $27,307,200 $718,611 $549,500 52 98% 36 254 $225,468,112 $887,670 $822,500 321 106% 12 106 $58,547,901 $552,339 $506,000 146 101% 18 193 $127,597,632 $661,128 $599,000 281 103% 18 217 $132,549,701 $610,828 $561,000 261 102% 16 1 1 1 2 4 5
- 6. Toronto Real Estate Board Market Watch, March 2017 SUMMARY OF EXISTING HOME TRANSACTIONS ALL HOME TYPES, YEAR-TO-DATE 2017 CITY OF TORONTO MUNICIPAL BREAKDOWN 6 Number of Sales Dollar Volume Average Price Median Price New Listings Avg. SP / LP Avg. DOM TREB Total City of Toronto Total Toronto West Toronto W01 Toronto W02 Toronto W03 Toronto W04 Toronto W05 Toronto W06 Toronto W07 Toronto W08 Toronto W09 Toronto W10 Toronto Central Toronto C01 Toronto C02 Toronto C03 Toronto C04 Toronto C06 Toronto C07 Toronto C08 Toronto C09 Toronto C10 Toronto C11 Toronto C12 Toronto C13 Toronto C14 Toronto C15 Toronto East Toronto E01 Toronto E02 Toronto E03 Toronto E04 Toronto E05 Toronto E06 Toronto E07 Toronto E08 Toronto E09 Toronto E10 Toronto E11 25,239 $22,049,562,186 $873,631 $720,000 34,168 109% 12 9,047 $7,696,409,714 $850,714 $625,000 12,194 109% 14 2,336 $1,699,296,239 $727,438 $610,000 3,157 109% 16 121 $100,790,984 $832,983 $587,500 169 109% 16 197 $185,825,565 $943,277 $907,000 248 115% 11 154 $110,641,399 $718,451 $741,000 216 113% 12 220 $153,298,398 $696,811 $615,994 312 108% 17 295 $159,329,525 $540,100 $494,000 373 106% 22 436 $275,008,067 $630,752 $515,608 634 107% 18 68 $84,546,689 $1,243,334 $1,191,000 84 115% 11 471 $423,933,144 $900,070 $575,000 632 108% 13 123 $85,934,625 $698,655 $690,000 160 113% 13 251 $119,987,843 $478,039 $377,000 329 106% 16 4,614 $4,421,735,433 $958,330 $590,000 6,336 108% 14 1,480 $956,559,505 $646,324 $527,750 1,974 106% 15 199 $276,363,729 $1,388,762 $1,125,500 377 105% 22 132 $212,526,123 $1,610,046 $1,125,000 192 108% 16 200 $353,672,878 $1,768,364 $1,776,375 304 111% 15 108 $109,361,300 $1,012,605 $630,000 147 114% 12 367 $346,155,852 $943,204 $615,000 489 107% 12 536 $343,510,082 $640,877 $562,750 745 106% 15 49 $98,779,413 $2,015,906 $1,250,000 93 103% 15 185 $167,601,105 $905,952 $630,000 239 110% 13 112 $99,760,666 $890,720 $405,750 133 112% 11 104 $335,381,606 $3,224,823 $3,194,500 158 103% 20 205 $249,110,079 $1,215,171 $821,500 286 118% 11 490 $506,184,283 $1,033,029 $552,750 631 107% 12 447 $366,768,812 $820,512 $500,000 568 111% 11 2,097 $1,575,378,042 $751,253 $732,000 2,701 114% 12 159 $152,132,932 $956,811 $902,000 201 120% 10 127 $138,035,367 $1,086,893 $990,000 175 114% 14 199 $192,891,319 $969,303 $940,000 273 118% 11 264 $177,177,021 $671,125 $730,000 329 115% 12 261 $200,116,833 $766,731 $608,000 323 115% 13 97 $85,638,002 $882,866 $770,000 140 110% 10 214 $130,527,037 $609,939 $411,000 286 115% 10 145 $115,090,816 $793,730 $770,000 188 108% 10 287 $163,131,882 $568,404 $466,000 360 114% 10 156 $121,600,708 $779,492 $801,000 216 112% 17 188 $99,036,125 $526,788 $542,500 210 110% 12 1 1 1 2 4 5
- 7. Toronto Real Estate Board Market Watch, March 2017 SUMMARY OF EXISTING HOME TRANSACTIONS DETACHED HOUSES, MARCH 2017 ALL TREB AREAS 7 Sales Dollar Volume Average Price Median Price New Listings Active Listings Avg. SP / LP Avg. DOM TREB Total Halton Region Burlington Halton Hills Milton Oakville Peel Region Brampton Caledon Mississauga City of Toronto Toronto West Toronto Central Toronto East York Region Aurora E. Gwillimbury Georgina King Markham Newmarket Richmond Hill Vaughan Whitchurch-Stouffville Durham Region Ajax Brock Clarington Oshawa Pickering Scugog Uxbridge Whitby Dufferin County Orangeville Simcoe County Adjala-Tosorontio Bradford West GwillimburyEssa Innisfil New Tecumseth 5,887 $7,149,303,314 $1,214,422 $1,023,000 9,012 4,347 111% 10 727 $905,888,128 $1,246,063 $1,100,000 1,049 532 107% 14 195 $206,560,289 $1,059,284 $945,000 237 103 103% 16 100 $78,580,987 $785,810 $720,000 109 72 104% 17 126 $123,170,727 $977,545 $932,500 197 95 110% 13 306 $497,576,125 $1,626,066 $1,475,000 506 262 108% 11 1,115 $1,154,005,774 $1,034,983 $950,000 1,671 777 109% 8 619 $552,000,327 $891,761 $855,000 912 355 108% 7 87 $89,222,417 $1,025,545 $940,000 139 104 104% 17 409 $512,783,030 $1,253,748 $1,126,000 620 318 112% 8 1,215 $1,897,562,752 $1,561,780 $1,263,275 1,924 987 113% 9 390 $477,242,889 $1,223,700 $1,081,500 580 304 114% 10 389 $953,421,635 $2,450,955 $2,150,000 649 370 111% 10 436 $466,898,228 $1,070,867 $957,875 695 313 118% 8 1,490 $2,156,135,891 $1,447,071 $1,330,000 2,534 1,276 113% 9 98 $135,403,422 $1,381,668 $1,233,000 165 87 113% 10 82 $95,660,700 $1,166,594 $1,075,000 124 68 115% 9 189 $138,941,775 $735,142 $688,000 301 130 111% 9 50 $92,732,615 $1,854,652 $1,622,500 81 66 104% 30 296 $497,526,588 $1,680,833 $1,566,400 513 245 115% 9 191 $218,360,986 $1,143,251 $1,105,000 309 134 116% 7 235 $431,393,940 $1,835,719 $1,680,000 422 216 113% 9 278 $448,897,265 $1,614,738 $1,452,500 498 256 112% 7 71 $97,218,600 $1,369,276 $1,202,000 121 74 109% 12 952 $731,097,094 $767,959 $745,400 1,321 523 114% 8 141 $118,748,362 $842,187 $821,000 201 80 116% 6 15 $8,406,300 $560,420 $512,500 25 23 101% 17 166 $112,287,356 $676,430 $650,000 243 102 113% 7 281 $185,277,539 $659,351 $620,000 384 122 115% 7 105 $98,502,389 $938,118 $855,000 126 46 113% 8 35 $24,308,500 $694,529 $607,000 49 33 104% 19 31 $33,691,300 $1,086,816 $975,000 46 30 106% 21 178 $149,875,348 $841,996 $815,500 247 87 116% 6 53 $35,459,692 $669,051 $610,000 60 22 105% 14 53 $35,459,692 $669,051 $610,000 60 22 105% 14 335 $269,153,983 $803,445 $700,000 453 230 105% 14 17 $13,793,800 $811,400 $615,000 24 27 98% 36 106 $109,235,449 $1,030,523 $930,000 141 53 108% 8 43 $27,549,501 $640,686 $574,000 49 34 100% 28 93 $68,173,433 $733,048 $649,900 151 78 105% 14 76 $50,401,800 $663,182 $592,000 88 38 102% 11 1 2 3 4 51 1 1
- 8. Toronto Real Estate Board Market Watch, March 2017 SUMMARY OF EXISTING HOME TRANSACTIONS DETACHED HOUSES, MARCH 2017 CITY OF TORONTO MUNICIPAL BREAKDOWN 8 Sales Dollar Volume Average Price Median Price New Listings Active Listings Avg. SP / LP Avg. DOM TREB Total City of Toronto Total Toronto West Toronto W01 Toronto W02 Toronto W03 Toronto W04 Toronto W05 Toronto W06 Toronto W07 Toronto W08 Toronto W09 Toronto W10 Toronto Central Toronto C01 Toronto C02 Toronto C03 Toronto C04 Toronto C06 Toronto C07 Toronto C08 Toronto C09 Toronto C10 Toronto C11 Toronto C12 Toronto C13 Toronto C14 Toronto C15 Toronto East Toronto E01 Toronto E02 Toronto E03 Toronto E04 Toronto E05 Toronto E06 Toronto E07 Toronto E08 Toronto E09 Toronto E10 Toronto E11 5,887 $7,149,303,314 $1,214,422 $1,023,000 9,012 4,347 111% 10 1,215 $1,897,562,752 $1,561,780 $1,263,275 1,924 987 113% 9 390 $477,242,889 $1,223,700 $1,081,500 580 304 114% 10 13 $20,071,499 $1,543,961 $1,599,999 16 12 110% 13 27 $37,312,513 $1,381,945 $1,302,000 39 20 123% 7 31 $25,711,277 $829,396 $800,000 54 25 124% 8 54 $57,970,697 $1,073,531 $958,833 94 50 112% 15 28 $28,695,000 $1,024,821 $942,500 41 28 113% 17 41 $46,271,937 $1,128,584 $1,037,000 64 37 115% 7 24 $32,449,000 $1,352,042 $1,290,000 31 13 120% 6 103 $165,846,788 $1,610,163 $1,450,000 144 83 110% 11 24 $26,783,277 $1,115,970 $1,019,000 38 13 123% 4 45 $36,130,901 $802,909 $819,000 59 23 113% 8 389 $953,421,635 $2,450,955 $2,150,000 649 370 111% 10 6 $10,166,000 $1,694,333 $1,621,500 16 9 102% 27 15 $32,562,800 $2,170,853 $1,655,000 24 15 110% 13 35 $86,576,265 $2,473,608 $2,230,000 40 24 111% 9 74 $166,190,170 $2,245,813 $2,196,500 107 59 117% 9 30 $54,335,500 $1,811,183 $1,663,500 47 20 120% 6 38 $81,903,888 $2,155,365 $1,962,900 94 59 109% 11 2 $3,250,000 $1,625,000 $1,625,000 4 2 102% 8 5 $22,405,000 $4,481,000 $4,900,000 14 15 99% 10 11 $19,647,000 $1,786,091 $2,030,000 13 7 115% 8 13 $28,619,000 $2,201,462 $2,080,000 21 11 119% 8 33 $145,872,206 $4,420,370 $4,180,000 51 47 103% 22 36 $75,892,941 $2,108,137 $1,950,000 60 28 120% 7 56 $149,694,265 $2,673,112 $2,615,000 93 43 106% 11 35 $76,306,600 $2,180,189 $1,978,000 65 31 117% 5 436 $466,898,228 $1,070,867 $957,875 695 313 118% 8 14 $16,889,028 $1,206,359 $1,241,750 17 7 123% 6 20 $30,141,808 $1,507,090 $1,419,500 27 14 111% 16 60 $67,310,793 $1,121,847 $1,055,500 96 47 118% 8 74 $65,787,340 $889,018 $860,750 107 39 119% 7 46 $59,979,041 $1,303,892 $1,350,000 81 33 122% 8 28 $30,864,000 $1,102,286 $823,000 57 31 112% 7 29 $33,135,733 $1,142,611 $1,138,800 59 27 124% 6 44 $48,077,363 $1,092,667 $905,443 52 19 113% 7 52 $46,561,685 $895,417 $873,000 85 42 122% 7 43 $46,005,937 $1,069,906 $1,045,000 79 40 117% 8 26 $22,145,500 $851,750 $811,500 35 14 114% 8 1 1 1 1 2 3 4 5
- 9. Toronto Real Estate Board Market Watch, March 2017 SUMMARY OF EXISTING HOME TRANSACTIONS SEMI-DETACHED HOUSES, MARCH 2017 ALL TREB AREAS 9 Sales Dollar Volume Average Price Median Price New Listings Active Listings Avg. SP / LP Avg. DOM TREB Total Halton Region Burlington Halton Hills Milton Oakville Peel Region Brampton Caledon Mississauga City of Toronto Toronto West Toronto Central Toronto East York Region Aurora E. Gwillimbury Georgina King Markham Newmarket Richmond Hill Vaughan Whitchurch-Stouffville Durham Region Ajax Brock Clarington Oshawa Pickering Scugog Uxbridge Whitby Dufferin County Orangeville Simcoe County Adjala-Tosorontio Bradford West GwillimburyEssa Innisfil New Tecumseth 1,002 $859,918,440 $858,202 $781,500 1,444 543 116% 6 54 $42,816,088 $792,891 $779,000 78 31 115% 5 10 $7,679,100 $767,910 $772,250 17 8 112% 5 7 $4,148,900 $592,700 $640,500 6 3 108% 5 22 $17,119,000 $778,136 $779,000 36 15 117% 4 15 $13,869,088 $924,606 $900,000 19 5 115% 4 375 $271,730,083 $724,614 $720,000 535 181 111% 6 214 $147,286,453 $688,254 $680,000 316 104 110% 5 15 $10,948,433 $729,896 $725,000 21 7 112% 5 146 $113,495,197 $777,364 $775,000 198 70 112% 6 334 $363,927,907 $1,089,605 $950,000 436 173 119% 7 106 $96,803,389 $913,240 $840,000 130 54 117% 8 105 $148,123,762 $1,410,702 $1,175,000 159 72 115% 7 123 $119,000,756 $967,486 $900,000 147 47 125% 5 135 $126,826,765 $939,458 $935,000 256 116 118% 6 12 $11,387,600 $948,967 $958,500 27 8 116% 7 0 - - - 3 2 - - 5 $3,257,000 $651,400 $642,000 7 2 108% 9 0 - - - 0 0 - - 35 $35,676,488 $1,019,328 $1,010,000 61 29 121% 6 28 $22,976,800 $820,600 $837,500 55 28 119% 6 18 $19,052,600 $1,058,478 $1,022,000 30 12 119% 7 34 $31,849,889 $936,761 $920,000 66 31 116% 6 3 $2,626,388 $875,463 $898,888 7 4 114% 8 82 $43,710,597 $533,056 $497,500 111 33 122% 5 12 $7,985,900 $665,492 $667,600 17 8 119% 5 0 - - - 0 0 - - 6 $2,679,614 $446,602 $450,000 7 0 120% 6 46 $21,449,286 $466,289 $460,000 61 17 123% 5 11 $7,372,401 $670,218 $685,500 13 2 122% 5 1 $457,396 $457,396 $457,396 1 0 106% 6 0 - - - 0 0 - - 6 $3,766,000 $627,667 $637,500 12 6 132% 6 7 $3,158,000 $451,143 $440,000 9 3 110% 6 7 $3,158,000 $451,143 $440,000 9 3 110% 6 15 $7,749,000 $516,600 $508,000 19 6 106% 5 0 - - - 1 1 - - 5 $3,267,000 $653,400 $665,000 6 1 112% 3 2 $780,000 $390,000 $390,000 6 3 107% 9 0 - - - 0 0 - - 8 $3,702,000 $462,750 $437,250 6 1 100% 5 1 1 1 1 2 3 4 5
- 10. Toronto Real Estate Board Market Watch, March 2017 SUMMARY OF EXISTING HOME TRANSACTIONS SEMI-DETACHED HOUSES, MARCH 2017 CITY OF TORONTO MUNICIPAL BREAKDOWN 10 Sales Dollar Volume Average Price Median Price New Listings Active Listings Avg. SP / LP Avg. DOM TREB Total City of Toronto Total Toronto West Toronto W01 Toronto W02 Toronto W03 Toronto W04 Toronto W05 Toronto W06 Toronto W07 Toronto W08 Toronto W09 Toronto W10 Toronto Central Toronto C01 Toronto C02 Toronto C03 Toronto C04 Toronto C06 Toronto C07 Toronto C08 Toronto C09 Toronto C10 Toronto C11 Toronto C12 Toronto C13 Toronto C14 Toronto C15 Toronto East Toronto E01 Toronto E02 Toronto E03 Toronto E04 Toronto E05 Toronto E06 Toronto E07 Toronto E08 Toronto E09 Toronto E10 Toronto E11 1,002 $859,918,440 $858,202 $781,500 1,444 543 116% 6 334 $363,927,907 $1,089,605 $950,000 436 173 119% 7 106 $96,803,389 $913,240 $840,000 130 54 117% 8 6 $8,425,000 $1,404,167 $1,220,000 10 5 116% 4 36 $36,848,207 $1,023,561 $961,000 32 8 122% 8 21 $16,589,305 $789,967 $820,000 24 15 113% 9 6 $4,610,000 $768,333 $787,500 7 1 107% 14 27 $20,181,200 $747,452 $720,000 42 16 111% 6 6 $6,348,677 $1,058,113 $1,085,450 5 2 124% 6 2 $1,851,000 $925,500 $925,500 2 0 124% 9 1 $1,025,000 $1,025,000 $1,025,000 2 2 128% 7 1 $925,000 $925,000 $925,000 3 3 116% 3 0 - - - 3 2 - - 105 $148,123,762 $1,410,702 $1,175,000 159 72 115% 7 21 $30,572,125 $1,455,815 $1,285,000 30 11 119% 7 20 $41,252,000 $2,062,600 $2,247,500 32 17 106% 11 9 $10,911,249 $1,212,361 $1,028,249 12 3 116% 4 2 $2,468,000 $1,234,000 $1,234,000 6 3 103% 24 1 $1,120,000 $1,120,000 $1,120,000 3 2 118% 7 8 $8,525,500 $1,065,688 $1,060,500 7 2 124% 7 1 $1,288,000 $1,288,000 $1,288,000 7 6 100% 6 3 $7,666,000 $2,555,333 $2,605,000 5 4 107% 5 7 $10,499,280 $1,499,897 $1,551,000 7 6 127% 8 4 $5,155,508 $1,288,877 $1,335,754 6 3 121% 5 1 $1,290,000 $1,290,000 $1,290,000 2 1 145% 6 9 $8,335,000 $926,111 $900,000 10 2 122% 5 0 - - - 0 0 - - 19 $19,041,100 $1,002,163 $962,800 32 12 122% 6 123 $119,000,756 $967,486 $900,000 147 47 125% 5 31 $33,884,964 $1,093,063 $1,040,000 39 14 126% 5 26 $26,344,100 $1,013,235 $920,000 27 10 128% 6 19 $22,418,304 $1,179,911 $1,165,000 17 2 129% 6 9 $6,888,000 $765,333 $750,000 7 1 122% 6 7 $6,454,500 $922,071 $928,000 14 7 119% 5 7 $5,321,200 $760,171 $720,000 6 0 118% 5 6 $4,917,700 $819,617 $829,000 8 3 121% 7 0 - - - 3 2 - - 3 $2,215,000 $738,333 $682,000 4 1 126% 3 7 $5,192,988 $741,855 $688,000 10 2 128% 5 8 $5,364,000 $670,500 $664,500 12 5 114% 4 1 1 1 1 2 3 4 5
- 11. Toronto Real Estate Board Market Watch, March 2017 SUMMARY OF EXISTING HOME TRANSACTIONS CONDOMINIUM TOWNHOUSES, MARCH 2017 ALL TREB AREAS 11 Sales Dollar Volume Average Price Median Price New Listings Active Listings Avg. SP / LP Avg. DOM TREB Total Halton Region Burlington Halton Hills Milton Oakville Peel Region Brampton Caledon Mississauga City of Toronto Toronto West Toronto Central Toronto East York Region Aurora E. Gwillimbury Georgina King Markham Newmarket Richmond Hill Vaughan Whitchurch-Stouffville Durham Region Ajax Brock Clarington Oshawa Pickering Scugog Uxbridge Whitby Dufferin County Orangeville Simcoe County Adjala-Tosorontio Bradford West GwillimburyEssa Innisfil New Tecumseth 789 $478,264,789 $606,166 $580,000 1,008 419 113% 9 102 $59,818,357 $586,454 $543,000 122 44 110% 8 46 $25,589,326 $556,290 $549,000 57 20 108% 7 10 $4,708,243 $470,824 $467,500 8 1 114% 8 8 $3,973,188 $496,649 $502,594 10 3 118% 5 38 $25,547,600 $672,305 $626,500 47 20 111% 9 259 $148,282,245 $572,518 $580,000 338 125 114% 7 67 $32,713,050 $488,254 $480,000 90 42 113% 8 0 - - - 0 0 - - 192 $115,569,195 $601,923 $608,500 248 83 114% 6 255 $168,675,569 $661,473 $601,000 331 163 113% 11 80 $41,950,891 $524,386 $507,450 102 56 109% 17 91 $78,825,410 $866,213 $768,000 124 65 114% 9 84 $47,899,268 $570,229 $565,000 105 42 117% 9 100 $69,478,789 $694,788 $692,000 138 62 112% 9 12 $6,573,700 $547,808 $456,000 25 13 112% 7 0 - - - 0 0 - - 0 - - - 1 1 - - 0 - - - 0 0 - - 43 $31,179,299 $725,100 $720,000 53 21 114% 11 12 $7,843,600 $653,633 $619,500 20 12 110% 9 14 $10,025,800 $716,129 $782,500 14 4 114% 8 19 $13,856,390 $729,284 $717,900 24 10 107% 9 0 - - - 1 1 - - 69 $30,486,079 $441,827 $465,000 72 23 119% 9 11 $5,487,500 $498,864 $500,000 12 6 118% 7 1 $240,000 $240,000 $240,000 0 0 100% 9 2 $681,000 $340,500 $340,500 3 1 106% 10 21 $7,204,538 $343,073 $365,000 22 8 124% 7 15 $7,368,041 $491,203 $475,000 19 6 123% 7 0 - - - 0 0 - - 5 $2,704,000 $540,800 $649,000 3 1 100% 27 14 $6,801,000 $485,786 $502,500 13 1 120% 8 3 $1,143,750 $381,250 $350,000 3 0 113% 3 3 $1,143,750 $381,250 $350,000 3 0 113% 3 1 $380,000 $380,000 $380,000 4 2 127% 1 0 - - - 0 0 - - 0 - - - 3 2 - - 0 - - - 0 0 - - 0 - - - 0 0 - - 1 $380,000 $380,000 $380,000 1 0 127% 1 1 1 1 1 2 3 4 5
- 12. Toronto Real Estate Board Market Watch, March 2017 SUMMARY OF EXISTING HOME TRANSACTIONS CONDOMINIUM TOWNHOUSES, MARCH 2017 CITY OF TORONTO MUNICIPAL BREAKDOWN 12 Sales Dollar Volume Average Price Median Price New Listings Active Listings Avg. SP / LP Avg. DOM TREB Total City of Toronto Total Toronto West Toronto W01 Toronto W02 Toronto W03 Toronto W04 Toronto W05 Toronto W06 Toronto W07 Toronto W08 Toronto W09 Toronto W10 Toronto Central Toronto C01 Toronto C02 Toronto C03 Toronto C04 Toronto C06 Toronto C07 Toronto C08 Toronto C09 Toronto C10 Toronto C11 Toronto C12 Toronto C13 Toronto C14 Toronto C15 Toronto East Toronto E01 Toronto E02 Toronto E03 Toronto E04 Toronto E05 Toronto E06 Toronto E07 Toronto E08 Toronto E09 Toronto E10 Toronto E11 789 $478,264,789 $606,166 $580,000 1,008 419 113% 9 255 $168,675,569 $661,473 $601,000 331 163 113% 11 80 $41,950,891 $524,386 $507,450 102 56 109% 17 7 $4,299,111 $614,159 $550,000 6 1 120% 9 8 $5,639,129 $704,891 $645,565 8 2 116% 7 0 - - - 0 0 - - 7 $3,438,100 $491,157 $498,000 9 4 108% 28 28 $11,847,400 $423,121 $434,000 42 33 105% 28 9 $6,216,000 $690,667 $725,000 9 2 109% 5 0 - - - 0 0 - - 5 $3,328,000 $665,600 $667,000 6 0 114% 8 5 $3,112,100 $622,420 $640,100 5 2 107% 8 11 $4,071,051 $370,096 $402,000 17 12 102% 9 91 $78,825,410 $866,213 $768,000 124 65 114% 9 22 $18,084,739 $822,034 $757,750 32 24 112% 12 5 $5,748,500 $1,149,700 $1,099,000 5 2 121% 9 1 $2,175,000 $2,175,000 $2,175,000 2 1 95% 57 2 $1,060,000 $530,000 $530,000 2 1 100% 15 0 - - - 0 0 - - 7 $4,194,491 $599,213 $631,000 11 7 113% 7 8 $6,469,600 $808,700 $775,000 11 5 105% 9 0 - - - 0 0 - - 2 $2,050,000 $1,025,000 $1,025,000 1 1 130% 4 4 $4,382,800 $1,095,700 $1,024,950 4 0 102% 13 7 $8,775,000 $1,253,571 $1,238,000 6 1 117% 5 2 $1,709,500 $854,750 $854,750 4 3 123% 5 14 $12,299,680 $878,549 $794,000 18 8 123% 6 17 $11,876,100 $698,594 $665,000 28 12 113% 8 84 $47,899,268 $570,229 $565,000 105 42 117% 9 9 $6,826,774 $758,530 $767,767 6 2 116% 7 5 $3,474,900 $694,980 $620,000 8 4 105% 6 0 - - - 0 0 - - 6 $3,774,800 $629,133 $623,400 11 5 120% 5 14 $8,139,800 $581,414 $597,500 19 8 115% 12 1 $565,000 $565,000 $565,000 2 1 97% 17 9 $5,930,188 $658,910 $673,000 10 3 125% 8 6 $2,597,000 $432,833 $428,000 9 3 115% 8 7 $3,144,000 $449,143 $500,000 8 2 115% 3 10 $4,851,206 $485,121 $518,500 12 7 121% 14 17 $8,595,600 $505,624 $523,000 20 7 118% 9 1 1 1 1 2 3 4 5
- 13. Toronto Real Estate Board Market Watch, March 2017 SUMMARY OF EXISTING HOME TRANSACTIONS CONDOMINIUM APARTMENT, MARCH 2017 ALL TREB AREAS 13 Sales Dollar Volume Average Price Median Price New Listings Active Listings Avg. SP / LP Avg. DOM TREB Total Halton Region Burlington Halton Hills Milton Oakville Peel Region Brampton Caledon Mississauga City of Toronto Toronto West Toronto Central Toronto East York Region Aurora E. Gwillimbury Georgina King Markham Newmarket Richmond Hill Vaughan Whitchurch-Stouffville Durham Region Ajax Brock Clarington Oshawa Pickering Scugog Uxbridge Whitby Dufferin County Orangeville Simcoe County Adjala-Tosorontio Bradford West GwillimburyEssa Innisfil New Tecumseth 3,261 $1,692,065,726 $518,879 $451,000 3,981 1,922 108% 12 108 $51,432,000 $476,222 $414,000 129 95 103% 22 34 $15,197,000 $446,971 $367,500 31 19 104% 14 2 $723,000 $361,500 $361,500 4 3 105% 22 17 $7,269,100 $427,594 $437,000 21 9 110% 8 55 $28,242,900 $513,507 $450,000 73 64 100% 30 433 $171,116,268 $395,188 $374,000 525 222 108% 10 65 $22,776,091 $350,401 $341,000 83 34 108% 9 1 $680,000 $680,000 $680,000 4 3 99% 3 367 $147,660,177 $402,344 $379,000 438 185 108% 11 2,324 $1,278,895,759 $550,299 $482,000 2,860 1,383 108% 12 501 $217,542,981 $434,218 $405,000 605 316 106% 15 1,536 $945,683,791 $615,680 $530,050 1,944 952 108% 11 287 $115,668,987 $403,028 $370,000 311 115 110% 10 342 $171,155,934 $500,456 $450,550 406 180 107% 12 8 $5,478,990 $684,874 $690,000 9 7 102% 38 1 $287,500 $287,500 $287,500 0 0 91% 25 0 - - - 0 0 - - 3 $1,373,000 $457,667 $380,000 8 6 97% 14 139 $69,980,286 $503,455 $461,800 161 63 109% 11 5 $2,001,700 $400,340 $396,000 4 1 108% 17 94 $44,187,143 $470,076 $432,500 111 41 107% 10 91 $47,447,415 $521,400 $500,000 109 58 106% 11 1 $399,900 $399,900 $399,900 4 4 103% 27 47 $17,683,765 $376,250 $362,000 50 30 111% 11 13 $4,932,603 $379,431 $377,000 14 8 110% 13 0 - - - 0 0 - - 8 $2,630,063 $328,758 $323,604 4 5 110% 19 8 $2,520,600 $315,075 $278,250 9 7 111% 9 7 $2,816,213 $402,316 $375,000 8 4 118% 7 0 - - - 0 0 - - 2 $670,000 $335,000 $335,000 2 1 105% 10 9 $4,114,286 $457,143 $453,888 13 5 110% 8 3 $765,000 $255,000 $180,000 6 7 103% 12 3 $765,000 $255,000 $180,000 6 7 103% 12 4 $1,017,000 $254,250 $248,500 5 5 98% 29 0 - - - 0 0 - - 2 $563,000 $281,500 $281,500 2 2 100% 22 0 - - - 0 0 - - 0 - - - 1 2 - - 2 $454,000 $227,000 $227,000 2 1 97% 36 1 1 1 1 2 3 4 5
- 14. Toronto Real Estate Board Market Watch, March 2017 SUMMARY OF EXISTING HOME TRANSACTIONS CONDOMINIUM APARTMENT, MARCH 2017 CITY OF TORONTO MUNICIPAL BREAKDOWN 14 Sales Dollar Volume Average Price Median Price New Listings Active Listings Avg. SP / LP Avg. DOM TREB Total City of Toronto Total Toronto West Toronto W01 Toronto W02 Toronto W03 Toronto W04 Toronto W05 Toronto W06 Toronto W07 Toronto W08 Toronto W09 Toronto W10 Toronto Central Toronto C01 Toronto C02 Toronto C03 Toronto C04 Toronto C06 Toronto C07 Toronto C08 Toronto C09 Toronto C10 Toronto C11 Toronto C12 Toronto C13 Toronto C14 Toronto C15 Toronto East Toronto E01 Toronto E02 Toronto E03 Toronto E04 Toronto E05 Toronto E06 Toronto E07 Toronto E08 Toronto E09 Toronto E10 Toronto E11 3,261 $1,692,065,726 $518,879 $451,000 3,981 1,922 108% 12 2,324 $1,278,895,759 $550,299 $482,000 2,860 1,383 108% 12 501 $217,542,981 $434,218 $405,000 605 316 106% 15 32 $16,562,201 $517,569 $465,000 47 20 109% 11 27 $14,321,012 $530,408 $490,000 31 7 113% 7 13 $5,108,200 $392,938 $407,000 9 4 107% 14 38 $13,878,388 $365,221 $344,000 54 25 104% 11 49 $14,689,400 $299,784 $320,000 37 16 101% 26 143 $70,883,928 $495,692 $444,000 188 132 105% 16 2 $671,990 $335,995 $335,995 3 3 98% 22 117 $55,616,962 $475,359 $415,000 134 56 108% 10 25 $8,734,400 $349,376 $295,000 36 10 106% 12 55 $17,076,500 $310,482 $332,500 66 43 101% 19 1,536 $945,683,791 $615,680 $530,050 1,944 952 108% 11 627 $391,008,565 $623,618 $542,000 832 407 108% 12 57 $58,051,688 $1,018,451 $670,000 97 108 103% 24 19 $14,470,660 $761,614 $655,000 25 12 104% 19 22 $13,263,988 $602,909 $510,000 26 20 111% 10 31 $13,212,300 $426,203 $410,000 32 11 106% 16 100 $59,237,954 $592,380 $555,944 122 45 111% 7 237 $151,124,416 $637,656 $590,000 304 159 108% 12 11 $11,805,088 $1,073,190 $830,000 18 16 105% 20 66 $38,060,415 $576,673 $524,408 69 30 107% 10 33 $12,483,078 $378,275 $340,000 32 7 108% 9 6 $7,718,000 $1,286,333 $1,090,000 7 4 103% 12 39 $17,803,500 $456,500 $418,800 52 28 107% 10 157 $89,129,900 $567,706 $510,000 179 55 113% 8 131 $68,314,239 $521,483 $452,218 149 50 110% 8 287 $115,668,987 $403,028 $370,000 311 115 110% 10 15 $10,265,675 $684,378 $635,000 20 6 114% 6 8 $6,177,900 $772,238 $628,500 13 9 106% 29 13 $4,670,200 $359,246 $261,000 11 3 109% 14 35 $11,401,300 $325,751 $325,000 35 14 109% 11 44 $19,042,764 $432,790 $412,500 43 15 108% 9 8 $5,667,700 $708,463 $603,750 11 7 103% 12 55 $20,745,588 $377,193 $376,000 60 19 110% 8 20 $6,561,355 $328,068 $320,500 20 5 108% 12 54 $21,474,506 $397,676 $395,500 66 28 113% 6 9 $2,008,000 $223,111 $205,000 9 4 108% 30 26 $7,653,999 $294,385 $310,500 23 5 114% 8 1 1 1 1 2 3 4 5
- 15. Toronto Real Estate Board Market Watch, March 2017 SUMMARY OF EXISTING HOME TRANSACTIONS LINK, MARCH 2017 ALL TREB AREAS 15 Sales Dollar Volume Average Price Median Price New Listings Active Listings Avg. SP / LP Avg. DOM TREB Total Halton Region Burlington Halton Hills Milton Oakville Peel Region Brampton Caledon Mississauga City of Toronto Toronto West Toronto Central Toronto East York Region Aurora E. Gwillimbury Georgina King Markham Newmarket Richmond Hill Vaughan Whitchurch-Stouffville Durham Region Ajax Brock Clarington Oshawa Pickering Scugog Uxbridge Whitby Dufferin County Orangeville Simcoe County Adjala-Tosorontio Bradford West GwillimburyEssa Innisfil New Tecumseth 170 $133,925,526 $787,797 $749,250 243 91 115% 6 6 $4,616,500 $769,417 $767,500 10 4 108% 7 1 $651,500 $651,500 $651,500 2 1 131% 4 1 $675,000 $675,000 $675,000 1 0 96% 14 1 $855,000 $855,000 $855,000 1 0 114% 6 3 $2,435,000 $811,667 $805,000 6 3 106% 6 16 $12,281,000 $767,563 $755,500 25 6 111% 6 8 $5,381,500 $672,688 $678,000 15 4 109% 7 1 $731,000 $731,000 $731,000 1 0 117% 5 7 $6,168,500 $881,214 $880,000 9 2 112% 5 8 $6,771,755 $846,469 $822,544 19 13 120% 7 0 - - - 0 1 - - 1 $1,120,000 $1,120,000 $1,120,000 2 1 121% 11 7 $5,651,755 $807,394 $800,088 17 11 120% 6 63 $65,742,021 $1,043,524 $1,000,000 101 41 117% 6 2 $2,080,000 $1,040,000 $1,040,000 4 2 99% 6 0 - - - 0 0 - - 0 - - - 0 0 - - 0 - - - 1 1 - - 50 $52,788,971 $1,055,779 $1,010,400 72 28 119% 6 0 - - - 0 0 - - 4 $4,122,000 $1,030,500 $985,500 14 7 115% 3 6 $5,921,050 $986,842 $993,025 10 3 110% 7 1 $830,000 $830,000 $830,000 0 0 114% 6 57 $33,771,150 $592,476 $585,000 61 16 116% 6 3 $1,821,000 $607,000 $606,000 4 1 107% 8 0 - - - 0 0 - - 28 $15,346,550 $548,091 $537,500 33 9 123% 5 5 $2,596,000 $519,200 $518,000 4 0 119% 5 3 $2,025,000 $675,000 $665,000 4 2 102% 11 1 $550,000 $550,000 $550,000 0 0 98% 22 2 $1,099,000 $549,500 $549,500 1 0 110% 8 15 $10,333,600 $688,907 $720,000 15 4 114% 4 0 - - - 0 0 - - 0 - - - 0 0 - - 20 $10,743,100 $537,155 $507,500 27 11 108% 5 0 - - - 0 0 - - 5 $3,262,500 $652,500 $685,000 7 5 113% 4 9 $4,228,800 $469,867 $458,900 12 2 104% 3 3 $1,818,800 $606,267 $630,000 3 1 111% 11 3 $1,433,000 $477,667 $463,000 5 3 107% 3 1 1 1 1 2 3 4 5
- 16. Toronto Real Estate Board Market Watch, March 2017 SUMMARY OF EXISTING HOME TRANSACTIONS LINK, MARCH 2017 CITY OF TORONTO MUNICIPAL BREAKDOWN 16 Sales Dollar Volume Average Price Median Price New Listings Active Listings Avg. SP / LP Avg. DOM TREB Total City of Toronto Total Toronto West Toronto W01 Toronto W02 Toronto W03 Toronto W04 Toronto W05 Toronto W06 Toronto W07 Toronto W08 Toronto W09 Toronto W10 Toronto Central Toronto C01 Toronto C02 Toronto C03 Toronto C04 Toronto C06 Toronto C07 Toronto C08 Toronto C09 Toronto C10 Toronto C11 Toronto C12 Toronto C13 Toronto C14 Toronto C15 Toronto East Toronto E01 Toronto E02 Toronto E03 Toronto E04 Toronto E05 Toronto E06 Toronto E07 Toronto E08 Toronto E09 Toronto E10 Toronto E11 170 $133,925,526 $787,797 $749,250 243 91 115% 6 8 $6,771,755 $846,469 $822,544 19 13 120% 7 0 - - - 0 1 - - 0 - - - 0 0 - - 0 - - - 0 0 - - 0 - - - 0 0 - - 0 - - - 0 0 - - 0 - - - 0 1 - - 0 - - - 0 0 - - 0 - - - 0 0 - - 0 - - - 0 0 - - 0 - - - 0 0 - - 0 - - - 0 0 - - 1 $1,120,000 $1,120,000 $1,120,000 2 1 121% 11 0 - - - 0 0 - - 0 - - - 0 0 - - 0 - - - 0 0 - - 0 - - - 0 0 - - 0 - - - 0 0 - - 0 - - - 0 0 - - 0 - - - 0 0 - - 0 - - - 0 0 - - 0 - - - 0 0 - - 0 - - - 0 0 - - 0 - - - 0 0 - - 0 - - - 0 0 - - 0 - - - 0 0 - - 1 $1,120,000 $1,120,000 $1,120,000 2 1 121% 11 7 $5,651,755 $807,394 $800,088 17 11 120% 6 0 - - - 0 0 - - 0 - - - 0 0 - - 0 - - - 0 0 - - 0 - - - 0 0 - - 1 $985,000 $985,000 $985,000 3 2 123% 7 0 - - - 0 0 - - 4 $3,363,088 $840,772 $822,544 9 6 124% 7 0 - - - 0 0 - - 0 - - - 0 0 - - 0 - - - 0 0 - - 2 $1,303,667 $651,834 $651,834 5 3 110% 4 1 1 1 1 2 3 4 5
- 17. Toronto Real Estate Board Market Watch, March 2017 SUMMARY OF EXISTING HOME TRANSACTIONS ATTACHED/ROW/TOWNHOUSE, MARCH 2017 ALL TREB AREAS 17 Sales Dollar Volume Average Price Median Price New Listings Active Listings Avg. SP / LP Avg. DOM TREB Total Halton Region Burlington Halton Hills Milton Oakville Peel Region Brampton Caledon Mississauga City of Toronto Toronto West Toronto Central Toronto East York Region Aurora E. Gwillimbury Georgina King Markham Newmarket Richmond Hill Vaughan Whitchurch-Stouffville Durham Region Ajax Brock Clarington Oshawa Pickering Scugog Uxbridge Whitby Dufferin County Orangeville Simcoe County Adjala-Tosorontio Bradford West GwillimburyEssa Innisfil New Tecumseth 937 $738,699,396 $788,366 $715,000 1,318 510 113% 7 210 $161,662,180 $769,820 $699,318 272 91 110% 6 33 $22,593,000 $684,636 $663,000 47 20 109% 7 9 $5,312,411 $590,268 $575,000 11 4 105% 6 98 $65,935,435 $672,811 $673,000 111 20 113% 5 70 $67,821,334 $968,876 $861,500 103 47 107% 8 179 $120,897,905 $675,407 $661,000 259 103 110% 6 132 $85,795,005 $649,962 $654,000 186 67 110% 6 14 $9,300,600 $664,329 $675,050 21 12 110% 5 33 $25,802,300 $781,888 $769,000 52 24 111% 7 107 $106,852,867 $998,625 $925,000 146 68 114% 9 34 $30,330,999 $892,088 $912,500 37 12 112% 13 30 $40,030,477 $1,334,349 $1,235,450 54 33 113% 9 43 $36,491,391 $848,637 $810,000 55 23 118% 6 271 $250,338,872 $923,760 $900,000 411 172 114% 8 20 $16,701,700 $835,085 $823,500 29 12 110% 10 5 $3,603,000 $720,600 $740,000 9 3 126% 4 14 $8,068,200 $576,300 $572,500 20 4 110% 6 3 $2,645,000 $881,667 $950,000 4 2 113% 8 68 $65,812,476 $967,831 $945,500 99 47 118% 6 12 $9,380,000 $781,667 $779,000 23 13 116% 4 59 $61,398,516 $1,040,653 $1,010,000 95 40 115% 9 68 $65,691,680 $966,054 $937,500 104 43 110% 11 22 $17,038,300 $774,468 $798,500 28 8 112% 7 142 $84,713,272 $596,572 $605,000 184 53 117% 5 36 $22,714,193 $630,950 $649,000 51 16 115% 5 1 $428,800 $428,800 $428,800 1 0 128% 5 17 $8,887,240 $522,779 $525,000 19 4 127% 4 35 $20,012,700 $571,791 $560,000 41 8 117% 6 13 $7,995,005 $615,000 $612,000 16 5 113% 6 0 - - - 0 0 - - 3 $2,004,000 $668,000 $664,000 3 0 109% 3 37 $22,671,334 $612,739 $615,000 53 20 118% 6 10 $4,799,000 $479,900 $501,500 11 3 110% 5 10 $4,799,000 $479,900 $501,500 11 3 110% 5 18 $9,435,300 $524,183 $525,000 35 20 110% 3 0 - - - 0 0 - - 4 $2,601,000 $650,250 $650,000 8 5 110% 3 0 - - - 2 2 - - 1 $490,000 $490,000 $490,000 9 8 109% 2 13 $6,344,300 $488,023 $511,100 16 5 110% 4 1 1 1 1 2 3 4 5
- 18. Toronto Real Estate Board Market Watch, March 2017 SUMMARY OF EXISTING HOME TRANSACTIONS ATTACHED/ROW/TOWNHOUSE, MARCH 2017 CITY OF TORONTO MUNICIPAL BREAKDOWN 18 Sales Dollar Volume Average Price Median Price New Listings Active Listings Avg. SP / LP Avg. DOM TREB Total City of Toronto Total Toronto West Toronto W01 Toronto W02 Toronto W03 Toronto W04 Toronto W05 Toronto W06 Toronto W07 Toronto W08 Toronto W09 Toronto W10 Toronto Central Toronto C01 Toronto C02 Toronto C03 Toronto C04 Toronto C06 Toronto C07 Toronto C08 Toronto C09 Toronto C10 Toronto C11 Toronto C12 Toronto C13 Toronto C14 Toronto C15 Toronto East Toronto E01 Toronto E02 Toronto E03 Toronto E04 Toronto E05 Toronto E06 Toronto E07 Toronto E08 Toronto E09 Toronto E10 Toronto E11 937 $738,699,396 $788,366 $715,000 1,318 510 113% 7 107 $106,852,867 $998,625 $925,000 146 68 114% 9 34 $30,330,999 $892,088 $912,500 37 12 112% 13 2 $2,081,500 $1,040,750 $1,040,750 2 2 105% 4 7 $6,743,500 $963,357 $1,010,000 6 3 108% 22 3 $1,907,000 $635,667 $672,000 4 1 120% 4 1 $650,000 $650,000 $650,000 3 1 99% 17 4 $2,705,000 $676,250 $662,500 5 1 103% 4 8 $8,392,500 $1,049,063 $1,067,500 9 1 119% 5 5 $5,033,999 $1,006,800 $999,999 4 0 118% 6 0 - - - 2 2 - - 1 $925,000 $925,000 $925,000 2 1 103% 7 3 $1,892,500 $630,833 $677,500 0 0 103% 51 30 $40,030,477 $1,334,349 $1,235,450 54 33 113% 9 6 $8,443,300 $1,407,217 $1,404,250 11 10 107% 6 3 $4,250,000 $1,416,667 $1,275,000 6 3 102% 10 0 - - - 0 0 - - 0 - - - 2 2 - - 0 - - - 0 0 - - 4 $4,743,000 $1,185,750 $1,182,500 4 1 112% 10 10 $12,789,277 $1,278,928 $1,290,000 21 11 113% 10 0 - - - 1 1 - - 2 $3,360,000 $1,680,000 $1,680,000 0 0 124% 15 0 - - - 2 1 - - 0 - - - 0 0 - - 3 $3,457,900 $1,152,633 $1,172,000 4 2 133% 5 2 $2,987,000 $1,493,500 $1,493,500 3 2 120% 5 0 - - - 0 0 - - 43 $36,491,391 $848,637 $810,000 55 23 118% 6 5 $4,779,000 $955,800 $965,000 8 6 120% 7 8 $8,923,036 $1,115,380 $1,076,518 7 3 121% 5 4 $3,525,000 $881,250 $768,000 4 0 127% 7 9 $6,575,255 $730,584 $730,000 10 4 111% 7 2 $1,610,000 $805,000 $805,000 2 0 117% 3 1 $750,000 $750,000 $750,000 1 0 134% 12 0 - - - 1 1 - - 3 $2,425,000 $808,333 $775,000 3 0 121% 9 3 $2,096,000 $698,667 $685,000 4 0 111% 3 2 $1,556,000 $778,000 $778,000 3 2 117% 5 6 $4,252,100 $708,683 $683,000 12 7 117% 5 1 1 1 1 2 3 4 5
- 19. Toronto Real Estate Board Market Watch, March 2017 SUMMARY OF EXISTING HOME TRANSACTIONS CO-OP APARTMENT, MARCH 2017 ALL TREB AREAS 19 Sales Dollar Volume Average Price Median Price New Listings Active Listings Avg. SP / LP Average DOM TREB Total Halton Region Burlington Halton Hills Milton Oakville Peel Region Brampton Caledon Mississauga City of Toronto Toronto West Toronto Central Toronto East York Region Aurora E. Gwillimbury Georgina King Markham Newmarket Richmond Hill Vaughan Whitchurch-Stouffville Durham Region Ajax Brock Clarington Oshawa Pickering Scugog Uxbridge Whitby Dufferin County Orangeville Simcoe County Adjala-Tosorontio Bradford West GwillimburyEssa Innisfil New Tecumseth 11 $5,294,600 $481,327 $425,000 18 17 114% 10 2 $611,000 $305,500 $305,500 2 0 106% 9 1 $234,000 $234,000 $234,000 1 0 100% 10 0 - - - 0 0 - - 0 - - - 0 0 - - 1 $377,000 $377,000 $377,000 1 0 111% 7 1 $300,000 $300,000 $300,000 2 1 109% 1 1 $300,000 $300,000 $300,000 1 0 109% 1 0 - - - 0 0 - - 0 - - - 1 1 - - 8 $4,383,600 $547,950 $505,000 14 16 116% 12 0 - - - 2 6 - - 7 $4,173,600 $596,229 $510,000 10 8 116% 9 1 $210,000 $210,000 $210,000 2 2 105% 32 0 - - - 0 0 - - 0 - - - 0 0 - - 0 - - - 0 0 - - 0 - - - 0 0 - - 0 - - - 0 0 - - 0 - - - 0 0 - - 0 - - - 0 0 - - 0 - - - 0 0 - - 0 - - - 0 0 - - 0 - - - 0 0 - - 0 - - - 0 0 - - 0 - - - 0 0 - - 0 - - - 0 0 - - 0 - - - 0 0 - - 0 - - - 0 0 - - 0 - - - 0 0 - - 0 - - - 0 0 - - 0 - - - 0 0 - - 0 - - - 0 0 - - 0 - - - 0 0 - - 0 - - - 0 0 - - 0 - - - 0 0 - - 0 - - - 0 0 - - 0 - - - 0 0 - - 0 - - - 0 0 - - 0 - - - 0 0 - - 0 - - - 0 0 - - 1 1 1 1 2 3 4 5
- 20. Toronto Real Estate Board Market Watch, March 2017 SUMMARY OF EXISTING HOME TRANSACTIONS CO-OP APARTMENT, MARCH 2017 CITY OF TORONTO MUNICIPAL BREAKDOWN 20 Sales Dollar Volume Average Price Median Price New Listings Active Listings Avg. SP / LP Avg. DOM TREB Total City of Toronto Total Toronto West Toronto W01 Toronto W02 Toronto W03 Toronto W04 Toronto W05 Toronto W06 Toronto W07 Toronto W08 Toronto W09 Toronto W10 Toronto Central Toronto C01 Toronto C02 Toronto C03 Toronto C04 Toronto C06 Toronto C07 Toronto C08 Toronto C09 Toronto C10 Toronto C11 Toronto C12 Toronto C13 Toronto C14 Toronto C15 Toronto East Toronto E01 Toronto E02 Toronto E03 Toronto E04 Toronto E05 Toronto E06 Toronto E07 Toronto E08 Toronto E09 Toronto E10 Toronto E11 11 $5,294,600 $481,327 $425,000 18 17 114% 10 8 $4,383,600 $547,950 $505,000 14 16 116% 12 0 - - - 2 6 - - 0 - - - 0 0 - - 0 - - - 0 0 - - 0 - - - 0 0 - - 0 - - - 0 0 - - 0 - - - 1 1 - - 0 - - - 0 3 - - 0 - - - 0 1 - - 0 - - - 0 0 - - 0 - - - 1 1 - - 0 - - - 0 0 - - 7 $4,173,600 $596,229 $510,000 10 8 116% 9 0 - - - 0 0 - - 0 - - - 0 0 - - 1 $206,900 $206,900 $206,900 2 2 99% 9 0 - - - 0 1 - - 0 - - - 0 0 - - 0 - - - 0 0 - - 0 - - - 0 0 - - 5 $3,466,700 $693,340 $738,000 7 5 115% 10 0 - - - 0 0 - - 0 - - - 0 0 - - 0 - - - 0 0 - - 0 - - - 0 0 - - 0 - - - 0 0 - - 1 $500,000 $500,000 $500,000 1 0 139% 1 1 $210,000 $210,000 $210,000 2 2 105% 32 0 - - - 0 0 - - 0 - - - 1 1 - - 0 - - - 0 0 - - 1 $210,000 $210,000 $210,000 0 0 105% 32 0 - - - 0 0 - - 0 - - - 0 0 - - 0 - - - 0 0 - - 0 - - - 0 0 - - 0 - - - 0 0 - - 0 - - - 1 1 - - 0 - - - 0 0 - - 1 1 1 1 2 3 4 5
- 21. Toronto Real Estate Board Market Watch, March 2017 SUMMARY OF EXISTING HOME TRANSACTIONS DETACHED CONDOMINIUM, MARCH 2017 ALL TREB AREAS 21 Sales Dollar Volume Average Price Median Price New Listings Active Listings Avg. SP / LP Avg. DOM TREB Total Halton Region Burlington Halton Hills Milton Oakville Peel Region Brampton Caledon Mississauga City of Toronto Toronto West Toronto Central Toronto East York Region Aurora E. Gwillimbury Georgina King Markham Newmarket Richmond Hill Vaughan Whitchurch-Stouffville Durham Region Ajax Brock Clarington Oshawa Pickering Scugog Uxbridge Whitby Dufferin County Orangeville Simcoe County Adjala-Tosorontio Bradford West GwillimburyEssa Innisfil New Tecumseth 13 $9,114,300 $701,100 $700,000 17 10 104% 21 0 - - - 1 1 - - 0 - - - 1 1 - - 0 - - - 0 0 - - 0 - - - 0 0 - - 0 - - - 0 0 - - 4 $3,765,000 $941,250 $912,500 3 1 108% 9 2 $1,540,000 $770,000 $770,000 3 1 103% 14 1 $1,240,000 $1,240,000 $1,240,000 0 0 124% 7 1 $985,000 $985,000 $985,000 0 0 99% 2 0 - - - 0 0 - - 0 - - - 0 0 - - 0 - - - 0 0 - - 0 - - - 0 0 - - 1 $460,000 $460,000 $460,000 1 0 99% 44 0 - - - 0 0 - - 0 - - - 0 0 - - 0 - - - 0 0 - - 0 - - - 0 0 - - 1 $460,000 $460,000 $460,000 0 0 99% 44 0 - - - 0 0 - - 0 - - - 0 0 - - 0 - - - 1 0 - - 0 - - - 0 0 - - 0 - - - 1 1 - - 0 - - - 1 1 - - 0 - - - 0 0 - - 0 - - - 0 0 - - 0 - - - 0 0 - - 0 - - - 0 0 - - 0 - - - 0 0 - - 0 - - - 0 0 - - 0 - - - 0 0 - - 0 - - - 0 0 - - 0 - - - 0 0 - - 8 $4,889,300 $611,163 $552,500 11 7 102% 24 0 - - - 0 0 - - 0 - - - 0 0 - - 0 - - - 0 0 - - 0 - - - 0 0 - - 8 $4,889,300 $611,163 $552,500 11 7 102% 24 1 1 1 1 2 3 4 5
- 22. Toronto Real Estate Board Market Watch, March 2017 SUMMARY OF EXISTING HOME TRANSACTIONS DETACHED CONDOMINIUM, MARCH 2017 CITY OF TORONTO MUNICIPAL BREAKDOWN 22 Sales Dollar Volume Average Price Median Price New Listings Active Listings Avg. SP / LP Avg. DOM TREB Total City of Toronto Total Toronto West Toronto W01 Toronto W02 Toronto W03 Toronto W04 Toronto W05 Toronto W06 Toronto W07 Toronto W08 Toronto W09 Toronto W10 Toronto Central Toronto C01 Toronto C02 Toronto C03 Toronto C04 Toronto C06 Toronto C07 Toronto C08 Toronto C09 Toronto C10 Toronto C11 Toronto C12 Toronto C13 Toronto C14 Toronto C15 Toronto East Toronto E01 Toronto E02 Toronto E03 Toronto E04 Toronto E05 Toronto E06 Toronto E07 Toronto E08 Toronto E09 Toronto E10 Toronto E11 13 $9,114,300 $701,100 $700,000 17 10 104% 21 0 - - - 0 0 - - 0 - - - 0 0 - - 0 - - - 0 0 - - 0 - - - 0 0 - - 0 - - - 0 0 - - 0 - - - 0 0 - - 0 - - - 0 0 - - 0 - - - 0 0 - - 0 - - - 0 0 - - 0 - - - 0 0 - - 0 - - - 0 0 - - 0 - - - 0 0 - - 0 - - - 0 0 - - 0 - - - 0 0 - - 0 - - - 0 0 - - 0 - - - 0 0 - - 0 - - - 0 0 - - 0 - - - 0 0 - - 0 - - - 0 0 - - 0 - - - 0 0 - - 0 - - - 0 0 - - 0 - - - 0 0 - - 0 - - - 0 0 - - 0 - - - 0 0 - - 0 - - - 0 0 - - 0 - - - 0 0 - - 0 - - - 0 0 - - 0 - - - 0 0 - - 0 - - - 0 0 - - 0 - - - 0 0 - - 0 - - - 0 0 - - 0 - - - 0 0 - - 0 - - - 0 0 - - 0 - - - 0 0 - - 0 - - - 0 0 - - 0 - - - 0 0 - - 0 - - - 0 0 - - 0 - - - 0 0 - - 0 - - - 0 0 - - 1 1 1 1 2 3 4 5
- 23. Toronto Real Estate Board Market Watch, March 2017 SUMMARY OF EXISTING HOME TRANSACTIONS CO-OWNERSHIP APARTMENT, MARCH 2017 ALL TREB AREAS 23 Sales Dollar Volume Average Price Median Price New Listings Active Listings Avg. SP / LP Avg. DOM TREB Total Halton Region Burlington Halton Hills Milton Oakville Peel Region Brampton Caledon Mississauga City of Toronto Toronto West Toronto Central Toronto East York Region Aurora E. Gwillimbury Georgina King Markham Newmarket Richmond Hill Vaughan Whitchurch-Stouffville Durham Region Ajax Brock Clarington Oshawa Pickering Scugog Uxbridge Whitby Dufferin County Orangeville Simcoe County Adjala-Tosorontio Bradford West GwillimburyEssa Innisfil New Tecumseth 7 $2,795,800 $399,400 $350,800 10 6 106% 40 0 - - - 0 0 - - 0 - - - 0 0 - - 0 - - - 0 0 - - 0 - - - 0 0 - - 0 - - - 0 0 - - 0 - - - 0 0 - - 0 - - - 0 0 - - 0 - - - 0 0 - - 0 - - - 0 0 - - 7 $2,795,800 $399,400 $350,800 10 6 106% 40 0 - - - 1 0 - - 7 $2,795,800 $399,400 $350,800 9 6 106% 40 0 - - - 0 0 - - 0 - - - 0 0 - - 0 - - - 0 0 - - 0 - - - 0 0 - - 0 - - - 0 0 - - 0 - - - 0 0 - - 0 - - - 0 0 - - 0 - - - 0 0 - - 0 - - - 0 0 - - 0 - - - 0 0 - - 0 - - - 0 0 - - 0 - - - 0 0 - - 0 - - - 0 0 - - 0 - - - 0 0 - - 0 - - - 0 0 - - 0 - - - 0 0 - - 0 - - - 0 0 - - 0 - - - 0 0 - - 0 - - - 0 0 - - 0 - - - 0 0 - - 0 - - - 0 0 - - 0 - - - 0 0 - - 0 - - - 0 0 - - 0 - - - 0 0 - - 0 - - - 0 0 - - 0 - - - 0 0 - - 0 - - - 0 0 - - 0 - - - 0 0 - - 1 1 1 1 2 3 4 5
- 24. Toronto Real Estate Board Market Watch, March 2017 SUMMARY OF EXISTING HOME TRANSACTIONS CO-OWNERSHIP APARTMENT, MARCH 2017 CITY OF TORONTO MUNICIPAL BREAKDOWN 24 Sales Dollar Volume Average Price Median Price New Listings Active Listings Avg. SP / LP Avg. DOM TREB Total City of Toronto Total Toronto West Toronto W01 Toronto W02 Toronto W03 Toronto W04 Toronto W05 Toronto W06 Toronto W07 Toronto W08 Toronto W09 Toronto W10 Toronto Central Toronto C01 Toronto C02 Toronto C03 Toronto C04 Toronto C06 Toronto C07 Toronto C08 Toronto C09 Toronto C10 Toronto C11 Toronto C12 Toronto C13 Toronto C14 Toronto C15 Toronto East Toronto E01 Toronto E02 Toronto E03 Toronto E04 Toronto E05 Toronto E06 Toronto E07 Toronto E08 Toronto E09 Toronto E10 Toronto E11 7 $2,795,800 $399,400 $350,800 10 6 106% 40 7 $2,795,800 $399,400 $350,800 10 6 106% 40 0 - - - 1 0 - - 0 - - - 1 0 - - 0 - - - 0 0 - - 0 - - - 0 0 - - 0 - - - 0 0 - - 0 - - - 0 0 - - 0 - - - 0 0 - - 0 - - - 0 0 - - 0 - - - 0 0 - - 0 - - - 0 0 - - 0 - - - 0 0 - - 7 $2,795,800 $399,400 $350,800 9 6 106% 40 0 - - - 0 0 - - 1 $372,000 $372,000 $372,000 2 2 101% 24 2 $960,000 $480,000 $480,000 2 2 106% 116 0 - - - 1 0 - - 0 - - - 0 0 - - 0 - - - 0 0 - - 2 $885,800 $442,900 $442,900 2 1 113% 3 0 - - - 0 0 - - 0 - - - 0 0 - - 0 - - - 0 0 - - 0 - - - 0 0 - - 1 $279,000 $279,000 $279,000 1 1 100% 19 1 $299,000 $299,000 $299,000 1 0 100% 1 0 - - - 0 0 - - 0 - - - 0 0 - - 0 - - - 0 0 - - 0 - - - 0 0 - - 0 - - - 0 0 - - 0 - - - 0 0 - - 0 - - - 0 0 - - 0 - - - 0 0 - - 0 - - - 0 0 - - 0 - - - 0 0 - - 0 - - - 0 0 - - 0 - - - 0 0 - - 0 - - - 0 0 - - 1 1 1 1 2 3 4 5
- 25. Toronto Real Estate Board Market Watch, March 2017 FOCUS ON THE MLS HOME PRICE INDEX INDEX AND BENCHMARK PRICE, MARCH 2017 ALL TREB AREAS 25 Composite Single-Family Detached Single-Family Attached Townhouse Apartment Index Benchmark Yr./Yr. % Chg. Index Benchmark Yr./Yr. % Chg. Index Benchmark Yr./Yr. % Chg. Index Benchmark Yr./Yr. % Chg. Index Benchmark Yr./Yr. % Chg. TREB Total Halton Region Burlington Halton Hills Milton Oakville Peel Region Brampton Caledon Mississauga City of Toronto York Region Aurora East Gwillimbury Georgina King Markham Newmarket Richmond Hill Vaughan Whitchurch-Stouffville Durham Region Ajax Brock Clarington Oshawa Pickering Scugog Uxbridge Whitby Dufferin County Orangeville Simcoe County Adjala-Tosorontio Bradford West GwillimburyEssa Innisfil New Tecumseth 252.8 $772,500 28.59% 265.5 $992,700 30.53% 265.8 $749,600 27.73% 241.3 $540,900 28.15% 212.5 $426,700 23.98% 264.3 $905,600 28.11% 264.3 $1,007,700 27.37% 265.8 $706,800 28.59% 266.8 $540,600 33.33% - - - 253.8 $771,600 25.71% 252.1 $900,900 24.37% 248.1 $618,300 23.62% 266.8 $548,100 33.00% - - - 247.4 $765,900 26.22% 243.3 $815,800 25.22% 255.0 $638,800 28.92% 267.5 $476,000 32.03% - - - 254.3 $763,200 29.15% 251.7 $881,000 28.81% 261.9 $661,000 29.98% 245.0 $429,800 32.72% - - - 278.9 $1,066,700 28.53% 279.0 $1,182,900 27.75% 280.9 $784,600 28.74% 271.0 $645,800 33.43% - - - 244.7 $694,200 30.02% 251.4 $885,100 31.14% 252.4 $646,200 30.64% 240.3 $516,400 29.68% 207.9 $359,400 24.05% 244.9 $622,100 32.24% 244.7 $713,800 32.41% 248.1 $582,000 31.76% 232.1 $426,100 30.69% 175.6 $274,900 21.61% 211.9 $756,500 24.14% 212.5 $780,800 24.27% 240.1 $593,100 25.51% - - - - - - 247.2 $733,700 28.75% 266.8 $1,065,600 30.66% 259.0 $714,300 29.82% 242.9 $546,000 29.34% 213.1 $375,100 24.26% 239.7 $778,700 24.13% 267.2 $1,171,900 27.72% 263.4 $877,900 22.45% 231.6 $568,200 21.26% 214.1 $441,200 24.04% 289.2 $989,100 31.34% 300.6 $1,171,200 33.60% 296.5 $858,200 30.16% 236.8 $607,400 20.82% 207.2 $455,800 21.52% 280.4 $900,000 31.27% 285.9 $1,062,700 33.35% 278.2 $719,300 25.94% 212.8 $540,500 24.15% 211.0 $437,000 18.34% 251.7 $806,500 32.06% 253.4 $833,700 32.81% 219.6 $505,000 23.16% - - - - - - 262.2 $544,400 42.42% 274.7 $568,400 42.41% 264.1 $520,700 34.81% - - - - - - 253.9 $1,062,800 31.15% 254.3 $1,057,900 30.75% 263.7 $617,600 26.96% - - - - - - 300.2 $1,040,700 30.58% 325.1 $1,337,500 34.67% 304.9 $911,900 29.30% 239.5 $608,800 19.27% 212.0 $513,500 23.83% 273.4 $806,200 35.62% 280.0 $943,800 36.52% 282.0 $664,200 34.09% 240.6 $489,300 22.19% 214.4 $361,600 18.13% 309.7 $1,120,100 32.46% 341.7 $1,452,100 35.17% 314.8 $956,700 31.66% 224.0 $619,900 19.79% 197.3 $409,700 18.57% 274.7 $992,200 28.79% 271.8 $1,129,800 30.17% 291.3 $882,400 29.29% 258.8 $704,400 24.36% 209.7 $467,000 21.85% 299.5 $1,052,600 33.47% 298.3 $1,074,100 33.35% 267.8 $735,600 32.84% - - - - - - 242.1 $566,700 31.79% 239.7 $623,200 31.41% 251.0 $501,300 29.45% 232.5 $377,700 36.85% 208.4 $374,200 32.74% 251.0 $619,300 28.26% 249.7 $669,300 28.45% 260.5 $560,100 26.52% 242.1 $442,500 32.88% 194.0 $329,100 30.55% 181.3 $329,800 22.67% 182.4 $332,900 22.66% - - - - - - - - - 238.4 $503,200 31.49% 231.8 $558,200 31.11% 238.6 $455,800 25.12% 228.6 $357,800 31.83% 215.9 $305,500 36.13% 243.4 $465,700 34.48% 240.3 $511,900 33.35% 255.9 $429,700 33.91% 221.4 $298,500 47.99% 198.3 $241,300 31.50% 243.0 $654,300 31.14% 242.7 $759,700 30.62% 247.2 $576,000 28.62% 248.6 $443,900 34.09% 224.9 $443,600 36.55% 209.8 $547,800 25.25% 216.6 $561,100 25.49% 204.5 $428,000 27.81% - - - - - - 215.1 $657,400 23.98% 213.6 $659,600 23.75% 211.2 $518,300 27.31% - - - - - - 248.0 $646,500 34.86% 250.7 $721,000 35.15% 250.9 $552,700 31.98% 217.7 $396,400 26.20% 198.4 $381,700 30.53% 234.4 $537,300 26.50% 244.9 $558,100 26.24% 229.3 $429,700 27.11% - - - - - - 234.4 $537,300 26.50% 244.9 $558,100 26.24% 229.3 $429,700 27.11% - - - - - - 243.3 $521,200 35.24% 234.7 $523,100 36.06% 247.3 $470,300 31.19% - - - - - - 196.6 $697,700 32.03% 196.6 $697,700 32.03% - - - - - - - - - 271.6 $671,300 33.07% 246.8 $752,800 33.05% 273.8 $569,200 32.14% - - - - - - 235.2 $537,600 33.11% 226.9 $557,700 32.46% 233.5 $397,800 32.82% - - - - - - 239.6 $440,500 39.14% 239.6 $441,000 39.46% 249.9 $388,700 30.97% - - - - - - 217.5 $503,500 32.06% 212.8 $548,600 33.58% 218.4 $417,100 27.64% - - - - - -
- 26. Toronto Real Estate Board Market Watch, March 2017 FOCUS ON THE MLS HOME PRICE INDEX INDEX AND BENCHMARK PRICE, MARCH 2017 CITY OF TORONTO 26 Composite Single-Family Detached Single-Family Attached Townhouse Apartment Index Benchmark Yr./Yr. % Chg. Index Benchmark Yr./Yr. % Chg. Index Benchmark Yr./Yr. % Chg. Index Benchmark Yr./Yr. % Chg. Index Benchmark Yr./Yr. % Chg. TREB Total City of Toronto Toronto W01 Toronto W02 Toronto W03 Toronto W04 Toronto W05 Toronto W06 Toronto W07 Toronto W08 Toronto W09 Toronto W10 Toronto C01 Toronto C02 Toronto C03 Toronto C04 Toronto C06 Toronto C07 Toronto C08 Toronto C09 Toronto C10 Toronto C11 Toronto C12 Toronto C13 Toronto C14 Toronto C15 Toronto E01 Toronto E02 Toronto E03 Toronto E04 Toronto E05 Toronto E06 Toronto E07 Toronto E08 Toronto E09 Toronto E10 Toronto E11 253 $772,500 28.59% 266 $992,700 30.53% 266 $749,600 27.73% 241 $540,900 28.15% 213 $426,700 23.98% 240 $778,700 24.13% 267 $1,171,900 27.72% 263 $877,900 22.45% 232 $568,200 21.26% 214 $441,200 24.04% 199 $805,300 15.42% 219 $1,140,100 16.78% 240 $926,200 18.79% 214 $453,000 10.54% 178 $415,000 18.35% 241 $876,800 14.75% 253 $1,063,700 14.27% 292 $893,800 15.71% 182 $540,400 14.06% 180 $708,300 21.54% 260 $676,100 24.00% 271 $735,300 25.00% 266 $681,800 22.90% 156 $378,100 15.90% 187 $357,900 24.19% 230 $589,600 23.88% 244 $769,700 25.33% 229 $662,500 20.01% 197 $465,700 5.64% 204 $299,400 27.75% 210 $491,200 22.35% 232 $767,800 20.57% 213 $621,900 20.34% 213 $344,800 27.09% 185 $242,800 26.40% 200 $584,300 24.84% 294 $937,400 39.68% 233 $706,100 30.31% 255 $756,900 37.94% 145 $367,700 19.03% 246 $1,051,700 35.33% 266 $1,151,100 36.21% 227 $931,200 23.49% 170 $626,000 29.60% 132 $536,100 16.68% 201 $798,000 23.46% 224 $1,170,400 25.36% 221 $818,000 21.65% 195 $469,000 24.28% 181 $372,700 22.64% 216 $542,500 21.68% 231 $862,900 20.65% 198 $568,800 15.13% 228 $593,800 23.09% 189 $242,400 24.67% 216 $498,000 22.54% 236 $709,200 21.36% 235 $602,400 22.16% 185 $390,800 19.19% 198 $275,000 28.16% 249 $617,900 26.05% 267 $1,009,000 21.44% 261 $911,200 17.07% 233 $677,200 20.47% 247 $514,600 27.75% 240 $1,149,100 18.47% 226 $1,788,600 21.01% 261 $1,367,800 19.91% 229 $1,069,400 12.51% 227 $645,300 17.54% 274 $1,429,400 26.96% 265 $1,623,200 27.52% 282 $1,045,000 26.09% - - - 280 $735,200 24.83% 246 $1,515,600 27.84% 257 $1,801,400 27.42% 260 $1,217,700 25.77% 225 $842,100 31.89% 196 $453,800 30.54% 268 $1,054,000 29.65% 293 $1,249,800 30.80% 220 $813,800 17.27% - - - 241 $531,900 26.98% 248 $861,700 28.59% 327 $1,497,300 34.14% 239 $853,400 24.54% 196 $575,000 19.43% 201 $490,600 27.80% 233 $610,900 21.66% 268 $1,562,400 16.74% 266 $1,269,900 16.24% 229 $653,500 18.26% 230 $496,700 22.95% 162 $1,141,500 11.83% 147 $1,844,000 7.94% 157 $1,280,800 4.72% 175 $902,800 4.05% 173 $573,900 14.78% 242 $939,000 16.84% 259 $1,596,600 21.01% 248 $1,227,100 17.67% 245 $638,100 13.29% 235 $562,200 15.56% 231 $818,500 19.87% 218 $1,483,600 13.73% 244 $1,081,300 12.38% 157 $250,100 27.07% 244 $353,500 25.06% 235 $1,992,100 28.71% 224 $2,395,400 27.93% 296 $1,236,900 34.26% 292 $1,020,900 41.33% 225 $704,800 19.32% 245 $886,700 27.23% 295 $1,572,700 37.29% 267 $850,700 32.18% 261 $756,100 34.36% 191 $384,600 14.85% 254 $845,000 29.74% 343 $1,857,200 39.67% 278 $1,353,200 28.48% 262 $884,300 13.73% 223 $560,600 28.30% 242 $790,600 23.62% 347 $1,629,800 39.57% 294 $954,200 32.57% 261 $643,200 26.42% 177 $411,600 14.56% 294 $920,200 22.19% 306 $1,077,500 22.51% 314 $991,500 25.97% 240 $484,500 9.31% 242 $575,000 15.21% 267 $1,003,200 21.38% 231 $1,052,900 19.68% 279 $933,600 23.31% 314 $1,003,800 37.43% 257 $708,800 15.51% 263 $808,900 23.37% 278 $936,600 24.97% 259 $846,500 23.86% - - - 189 $277,300 15.46% 256 $631,800 31.11% 277 $815,200 35.61% 271 $652,500 35.26% 222 $481,000 13.68% 223 $341,900 23.08% 250 $656,800 26.99% 301 $1,061,100 35.84% 289 $795,000 34.31% 245 $533,300 16.93% 187 $366,500 15.54% 266 $739,800 26.67% 273 $778,600 28.65% 270 $642,500 26.75% 215 $530,400 5.82% 209 $438,500 15.89% 247 $606,200 19.12% 293 $959,400 22.52% 270 $706,800 19.23% 246 $533,000 11.51% 208 $355,500 18.90% 243 $585,200 27.97% 262 $815,700 26.98% 231 $599,000 24.38% 226 $461,100 21.13% 212 $337,600 33.33% 234 $559,500 25.54% 271 $768,600 28.23% 254 $621,500 28.20% 252 $467,400 30.72% 196 $367,600 22.04% 255 $714,700 24.21% 253 $811,300 21.97% 238 $616,600 18.72% 283 $493,900 34.14% 192 $309,100 33.57% 229 $500,700 21.05% 255 $709,000 19.28% 246 $556,000 19.06% 180 $353,300 17.34% 213 $317,100 27.40%
- 27. Toronto Real Estate Board Market Watch, March 2017 HISTORIC ANNUAL STATISTICS 27 Year Sales Average Price 2005 2006 2007 2008 2009 2010 2011 2012 2013 2014 2015 84,145 $335,907 83,084 $351,941 93,193 $376,236 74,552 $379,347 87,308 $395,460 85,545 $431,276 89,096 $465,014 85,496 $497,130 87,049 $522,958 92,782 $566,624 101,213 $622,121 2016 MONTHLY STATISTICS NOTES 1 - Sales, dollar volume, average sale prices and median sale prices are based on firm transactions entered into the TREB MLS® system between the first and last day of the month/period being reported. 2 - New listings entered into the TREB MLS® system between the first and last day of the month/period being reported. 3 - Active listings at the end of the last day of the month/period being reported. 4 - Ratio of the average selling price to the average listing price for firm transactions entered into the TREB MLS® system between the first and last day of the month/period being reported. 5 - Average number of days on the market for firm transactions entered into the TREB MLS® system between the first and last day of the month/period being reported. 6 - Due to past changes to TREB's service area, caution should be exercised when making historical comparisons. 7 - Past monthly and year-to-date figures are revised on a monthly basis. 8 - SNLR = Sales-to-New Listings Ratio. Calculated using a 12-month moving average (sales/new listings). 9 - Mos. Inv. = Months of Inventory. Calculated using a 12-month moving average (active listings/sales). 2017 MONTHLY STATISTICS *For historic annual sales and average price data over a longer time frame go to: January February March April May June July August September October November December Year to Date 5,165 $769,278 7,997 $876,186 12,077 $916,567 - - - - - - - - - - - - - - - - - - 25,239 $854,010 January February March April May June July August September October November December Annual 4,640 $630,193 7,583 $685,738 10,260 $688,011 12,016 $739,762 12,791 $752,266 12,726 $746,974 9,931 $710,420 9,749 $710,999 9,831 $756,129 9,719 $762,664 8,503 $777,345 5,310 $730,751 113,059 $729,910 1,6,7 1,7 1,7 http://www.torontorealestateboard.com/market_news/market_watch/historic_stats/p df/TREB_historic_statistics.pdf Copyright® 2017 Toronto Real Estate Board $873,63125,239