Download to read offline

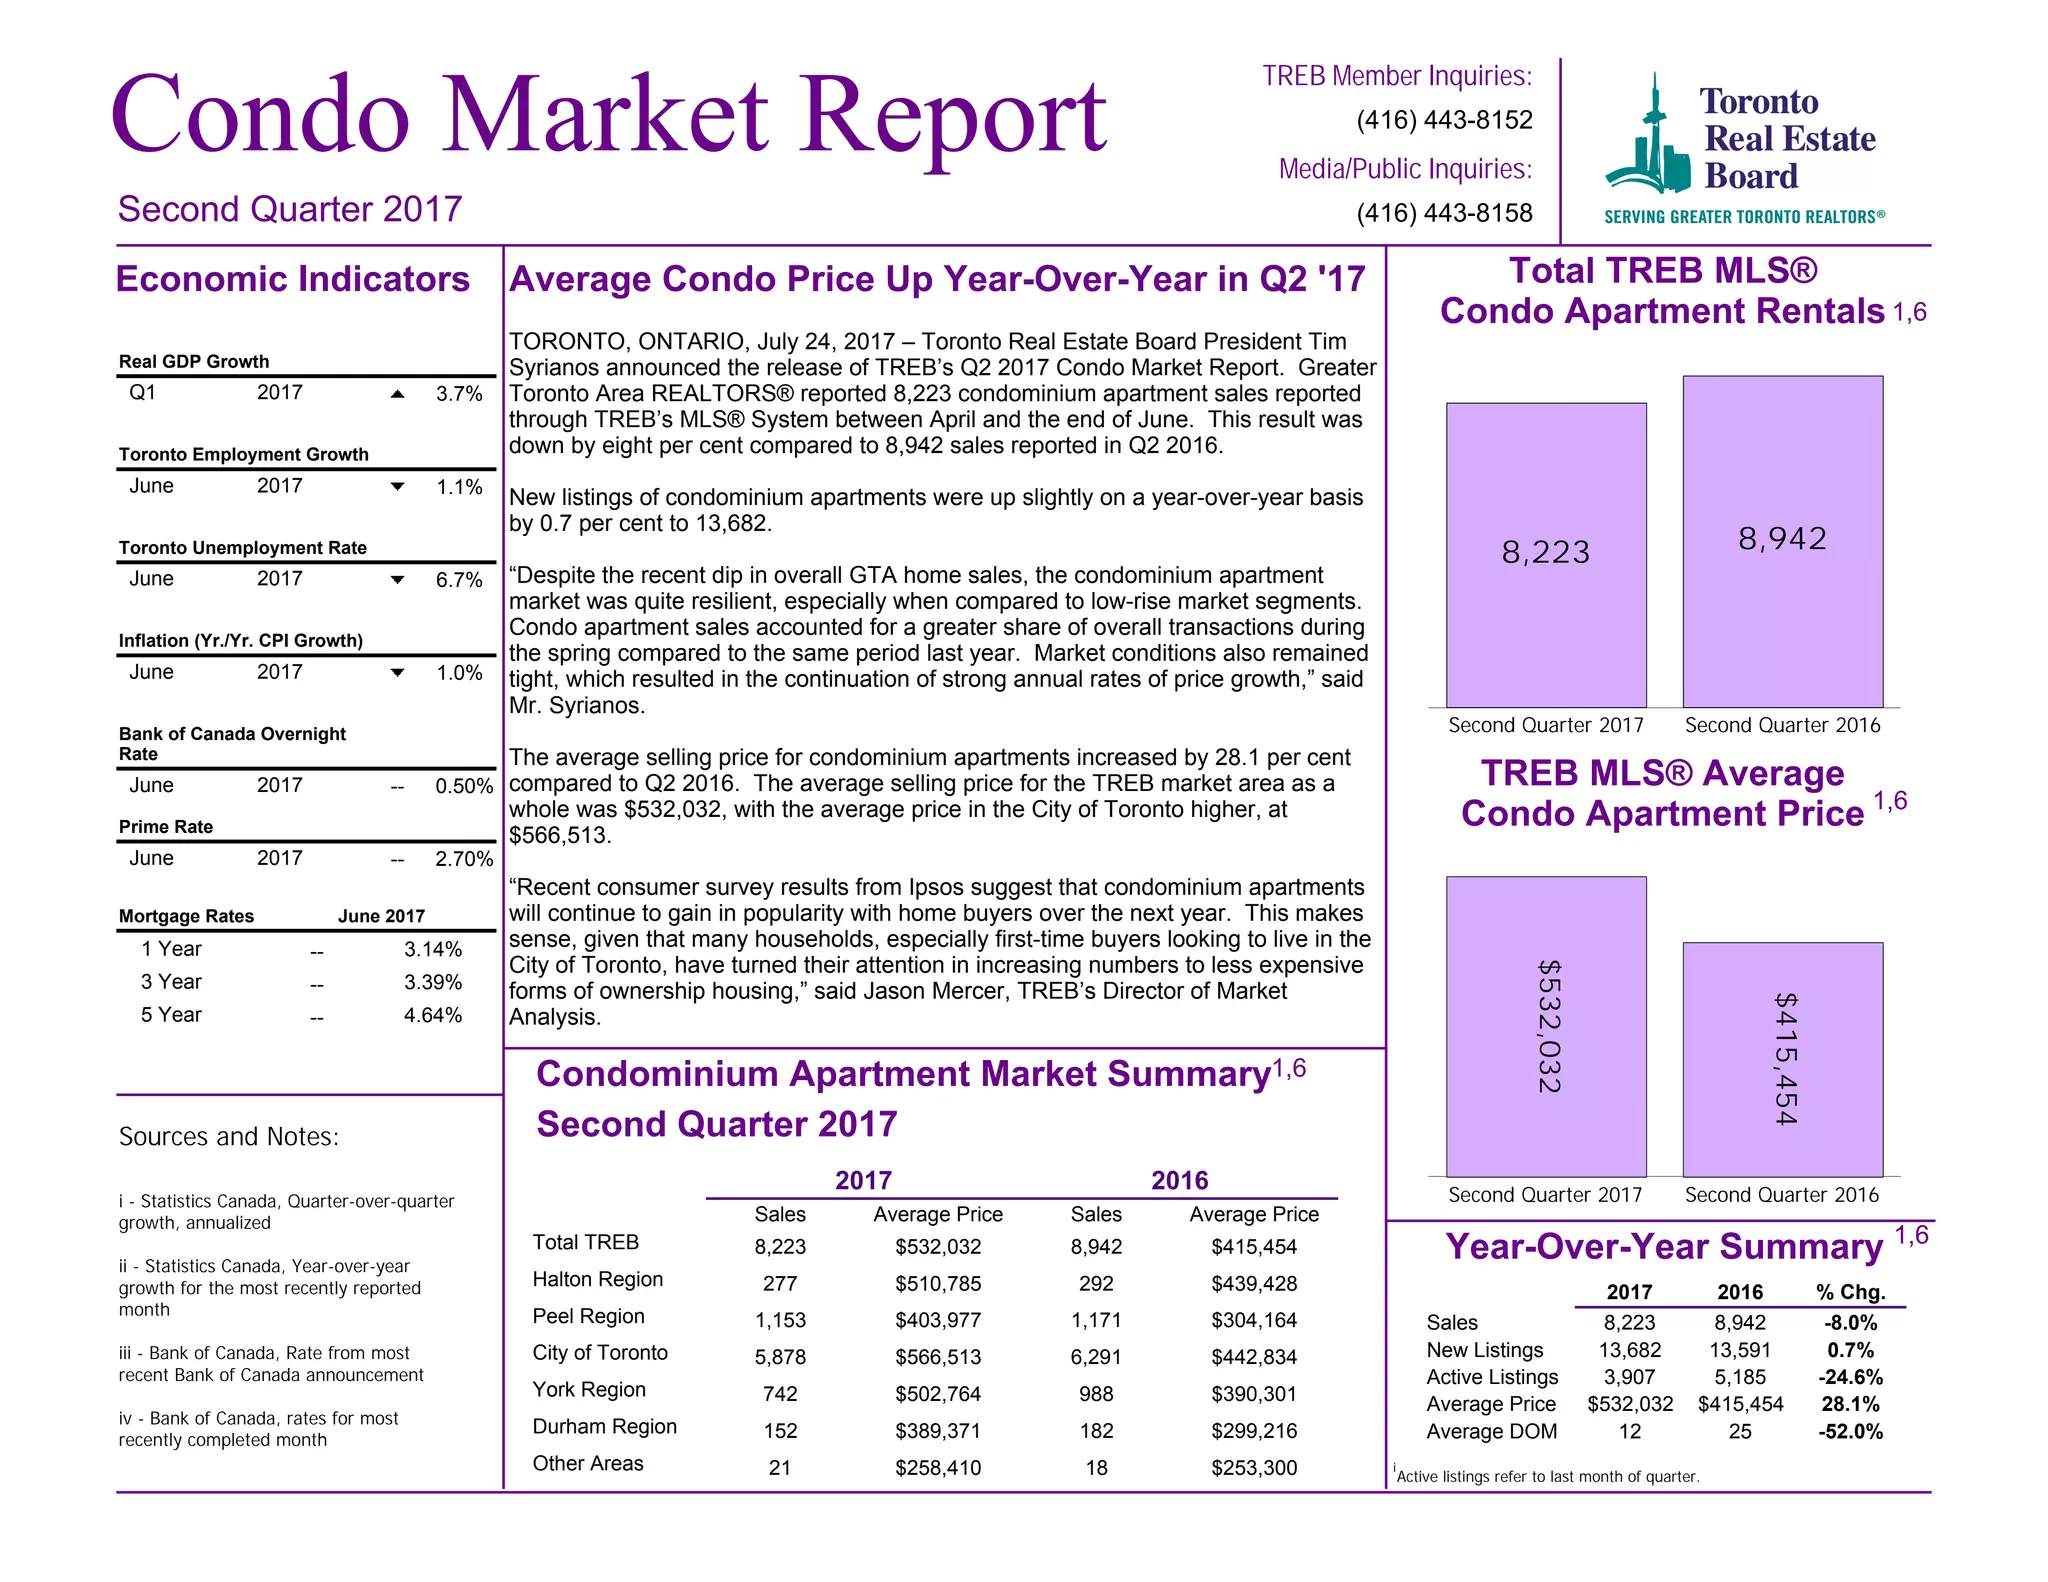

- Condominium apartment sales in the GTA were down 8% year-over-year in Q2 2017 with 8,223 sales, while the average selling price increased 28.1% to $532,032. - The condo market remained resilient compared to low-rise segments, with condos accounting for a greater share of transactions. Market conditions were tight, resulting in ongoing strong price growth. - Surveys suggest condos will continue gaining popularity for home buyers, as many households, especially first-time buyers in Toronto, turn to more affordable ownership options like condos.


