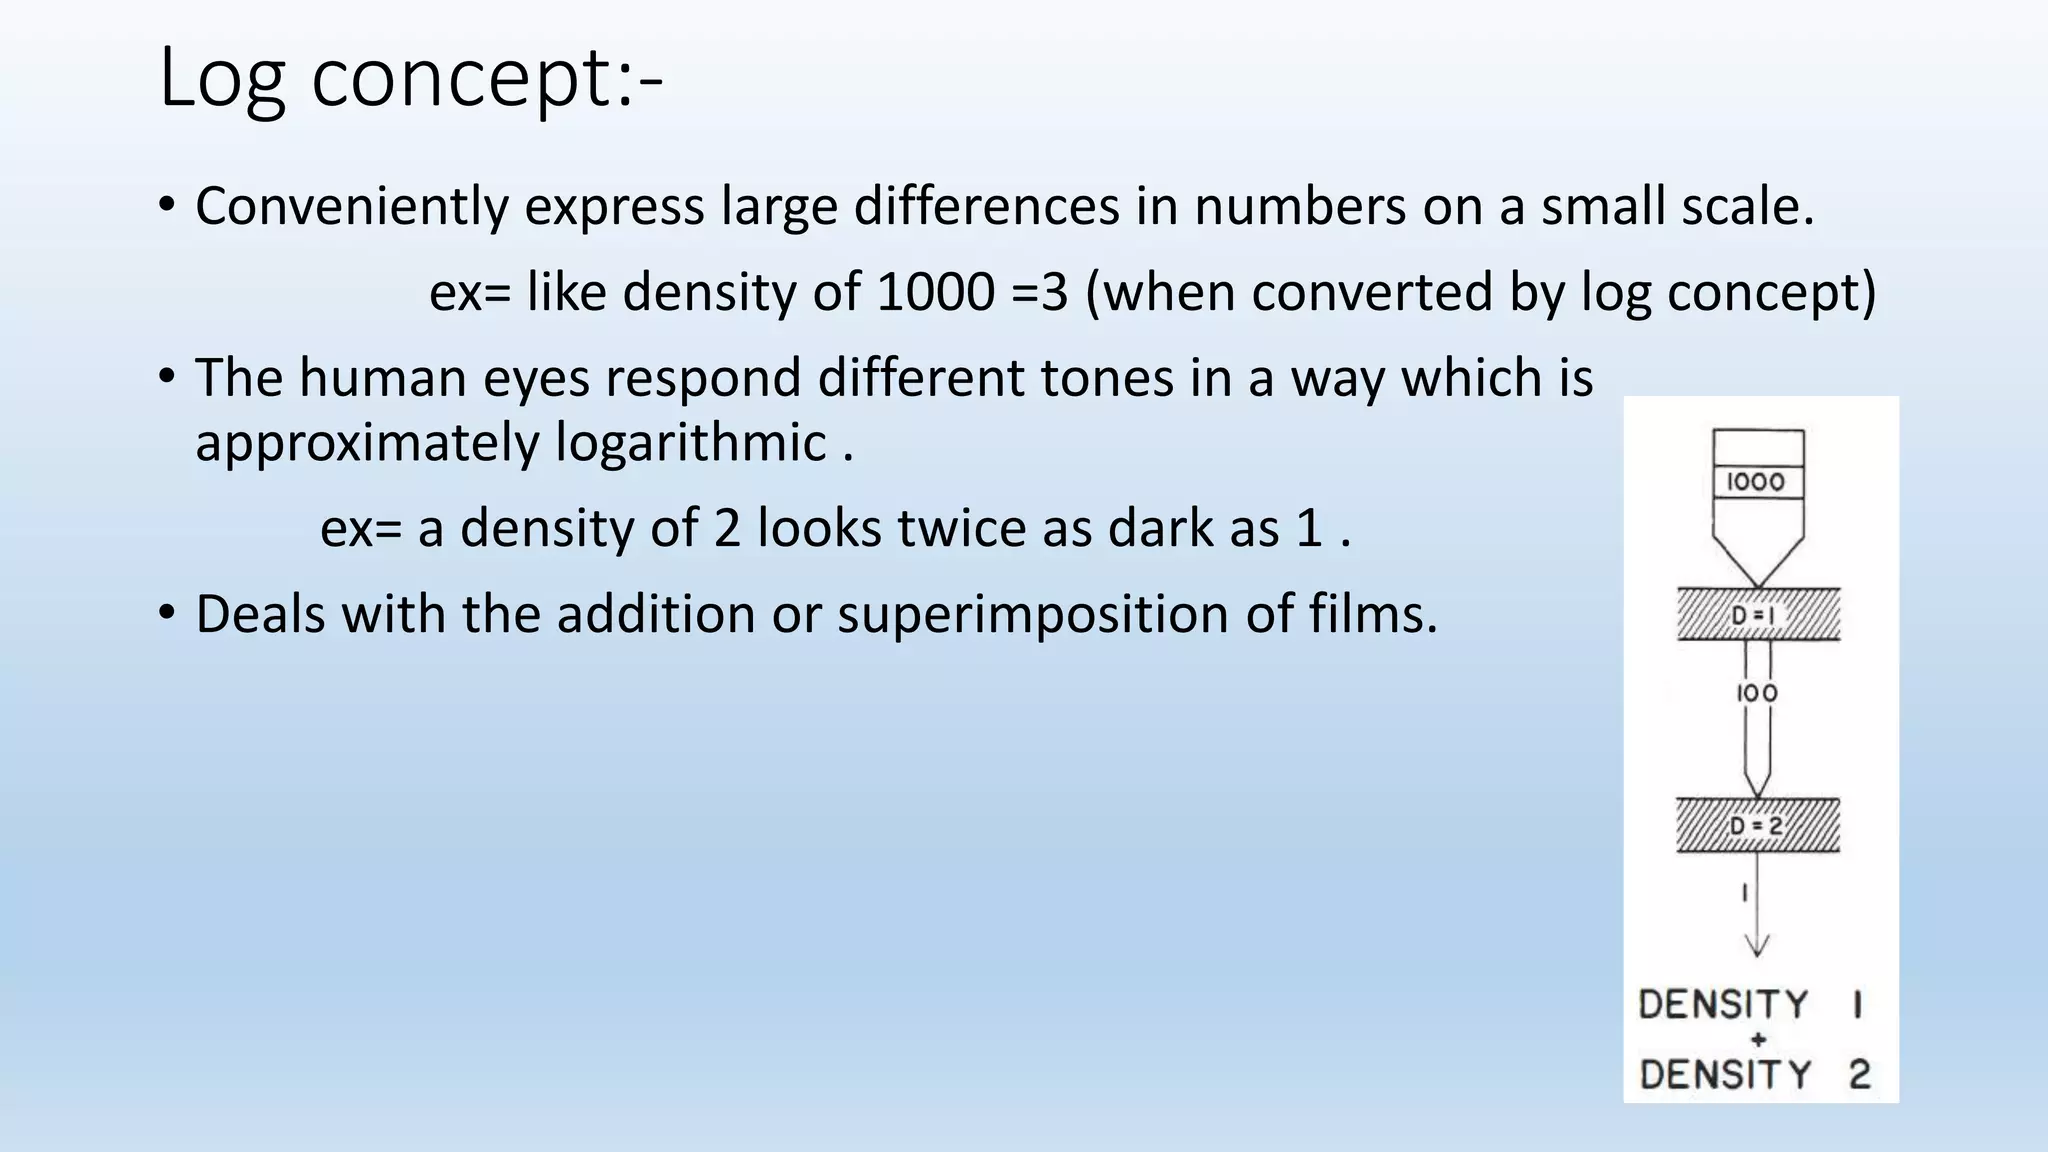
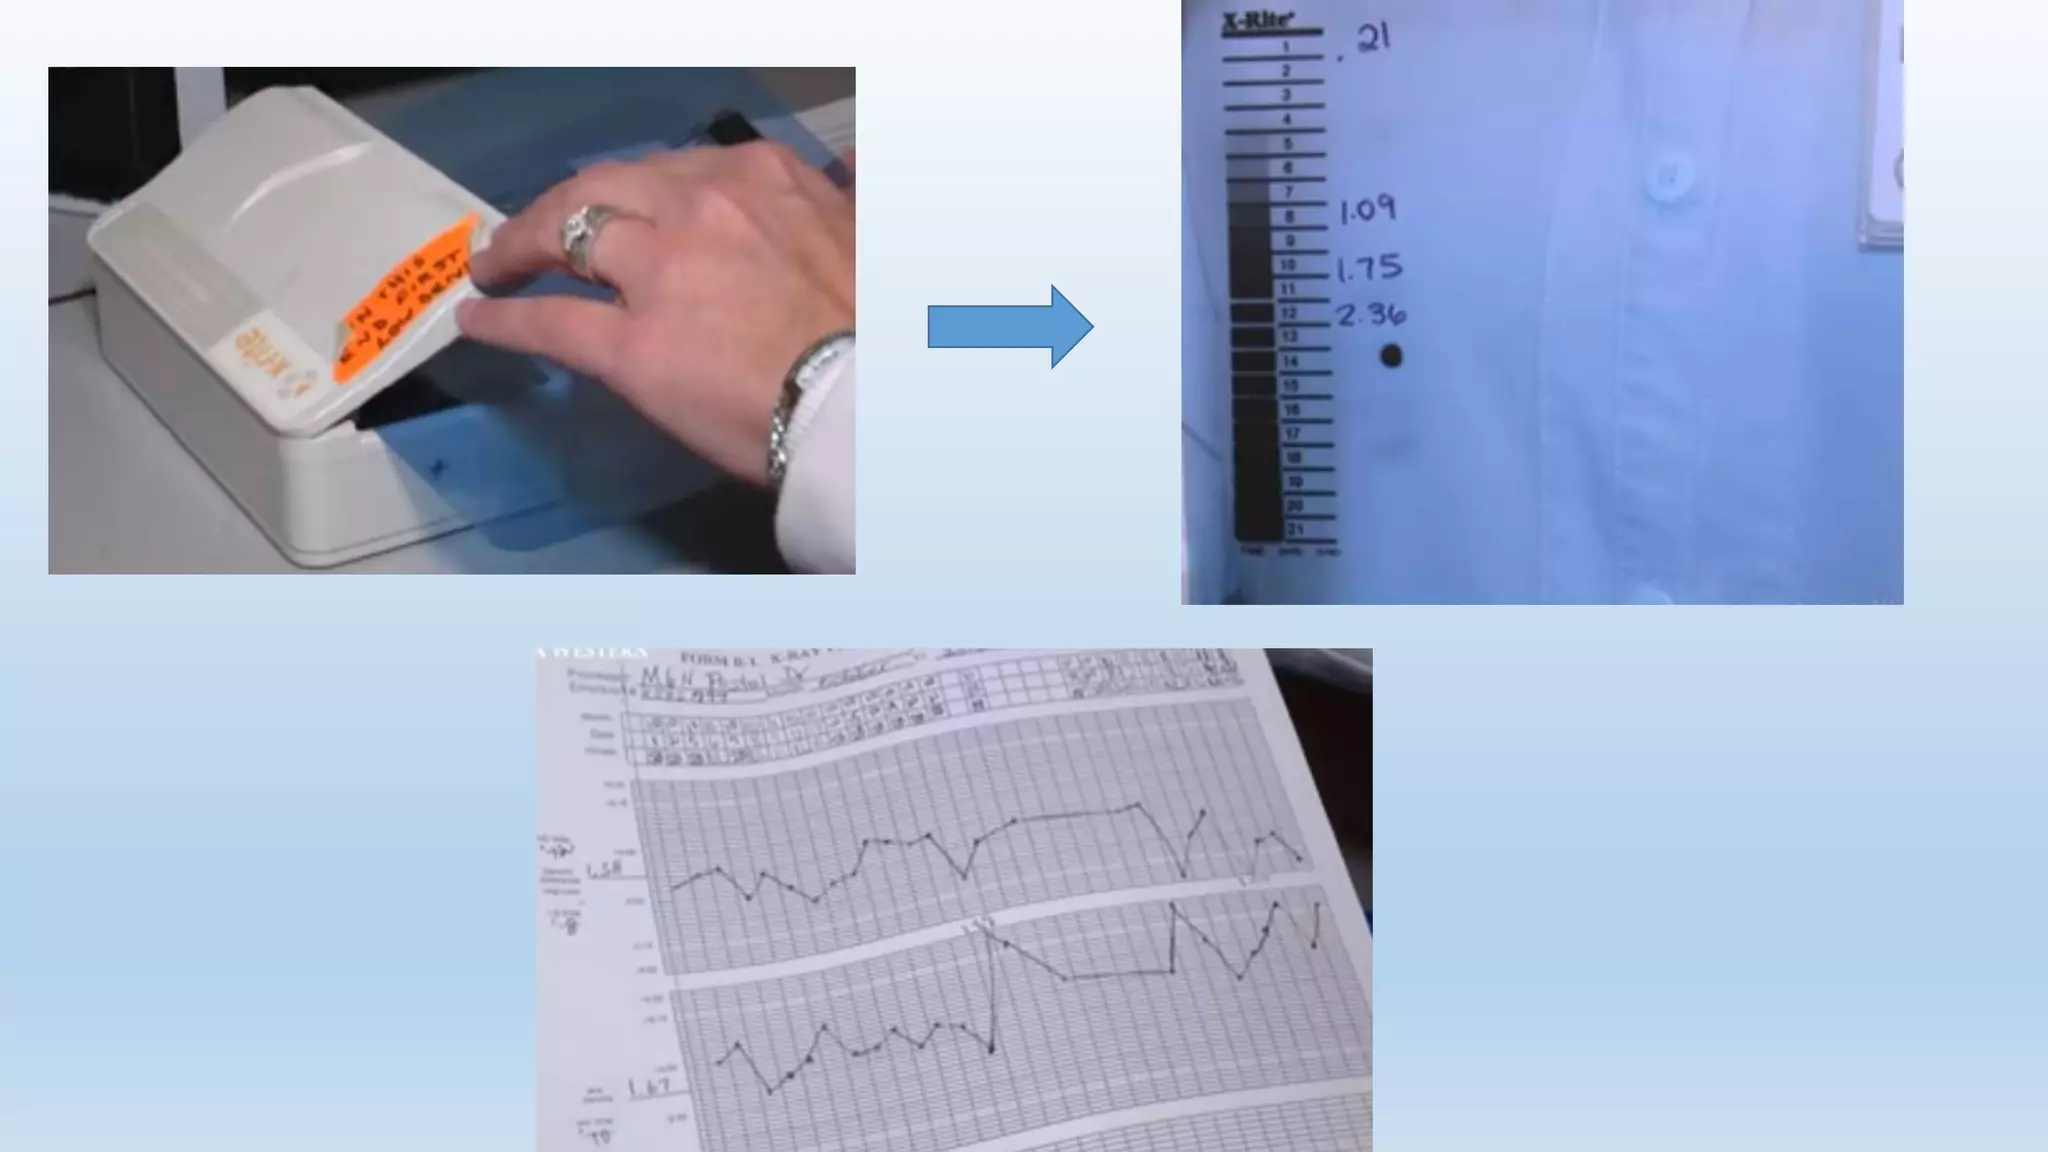
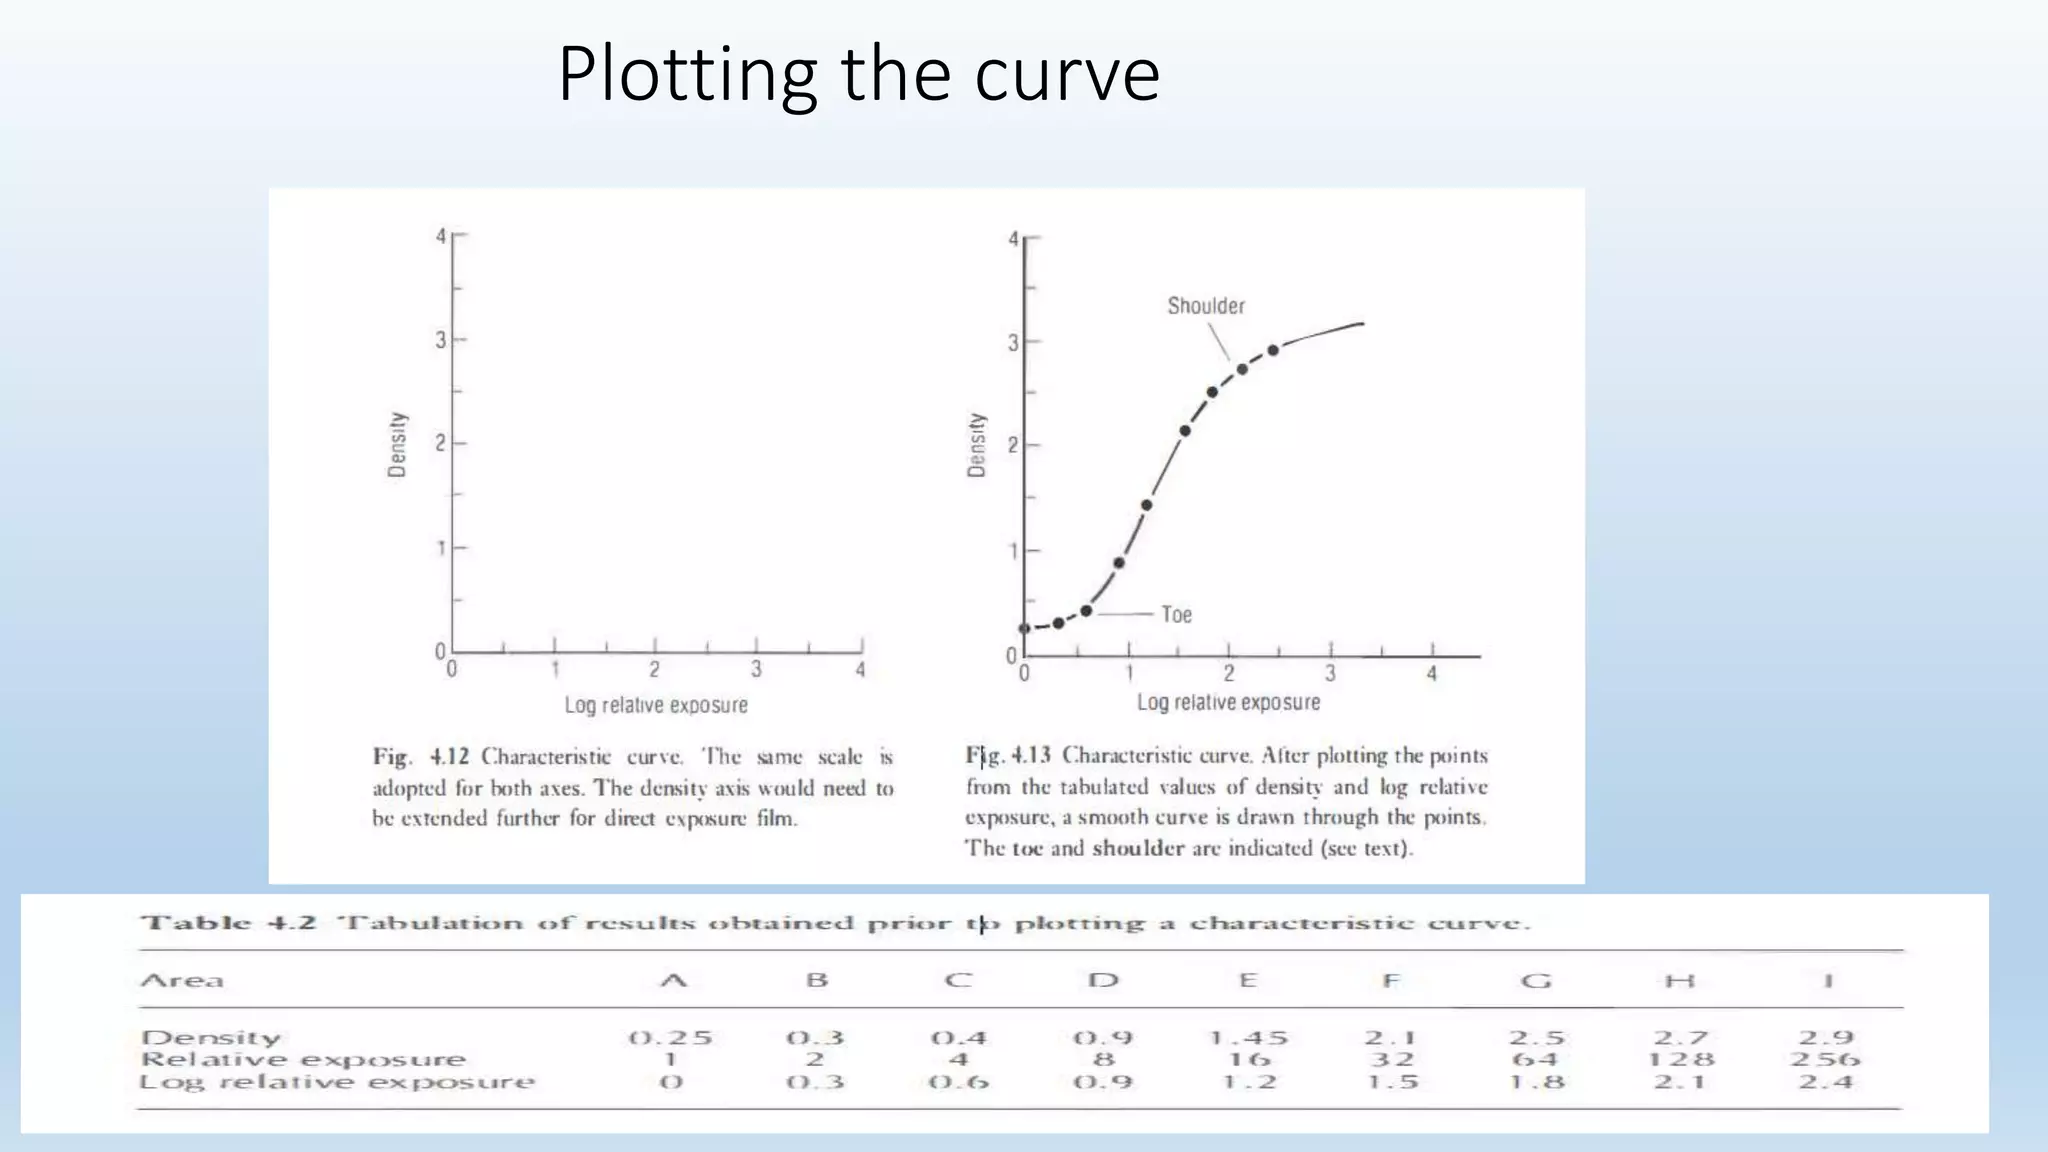
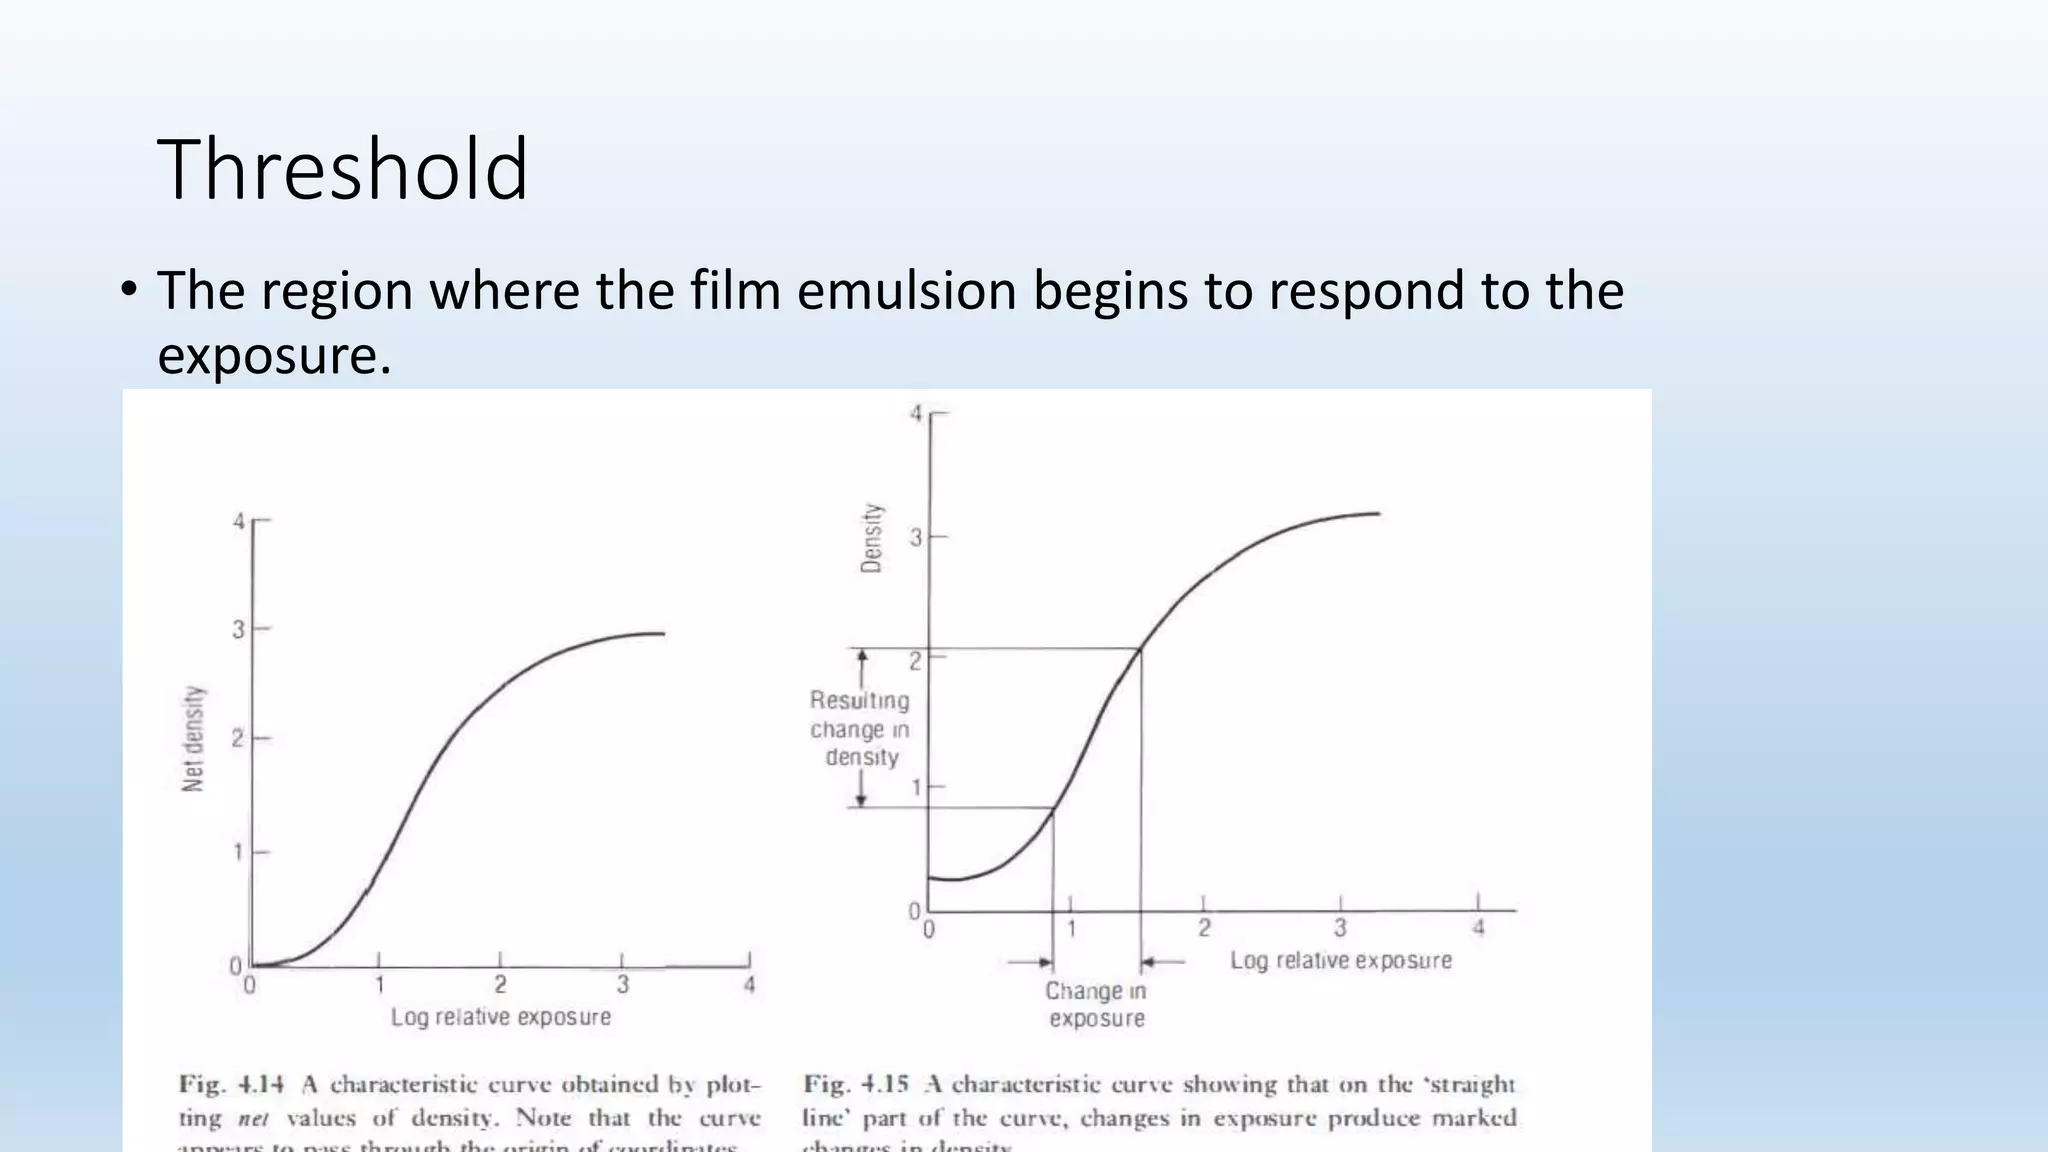
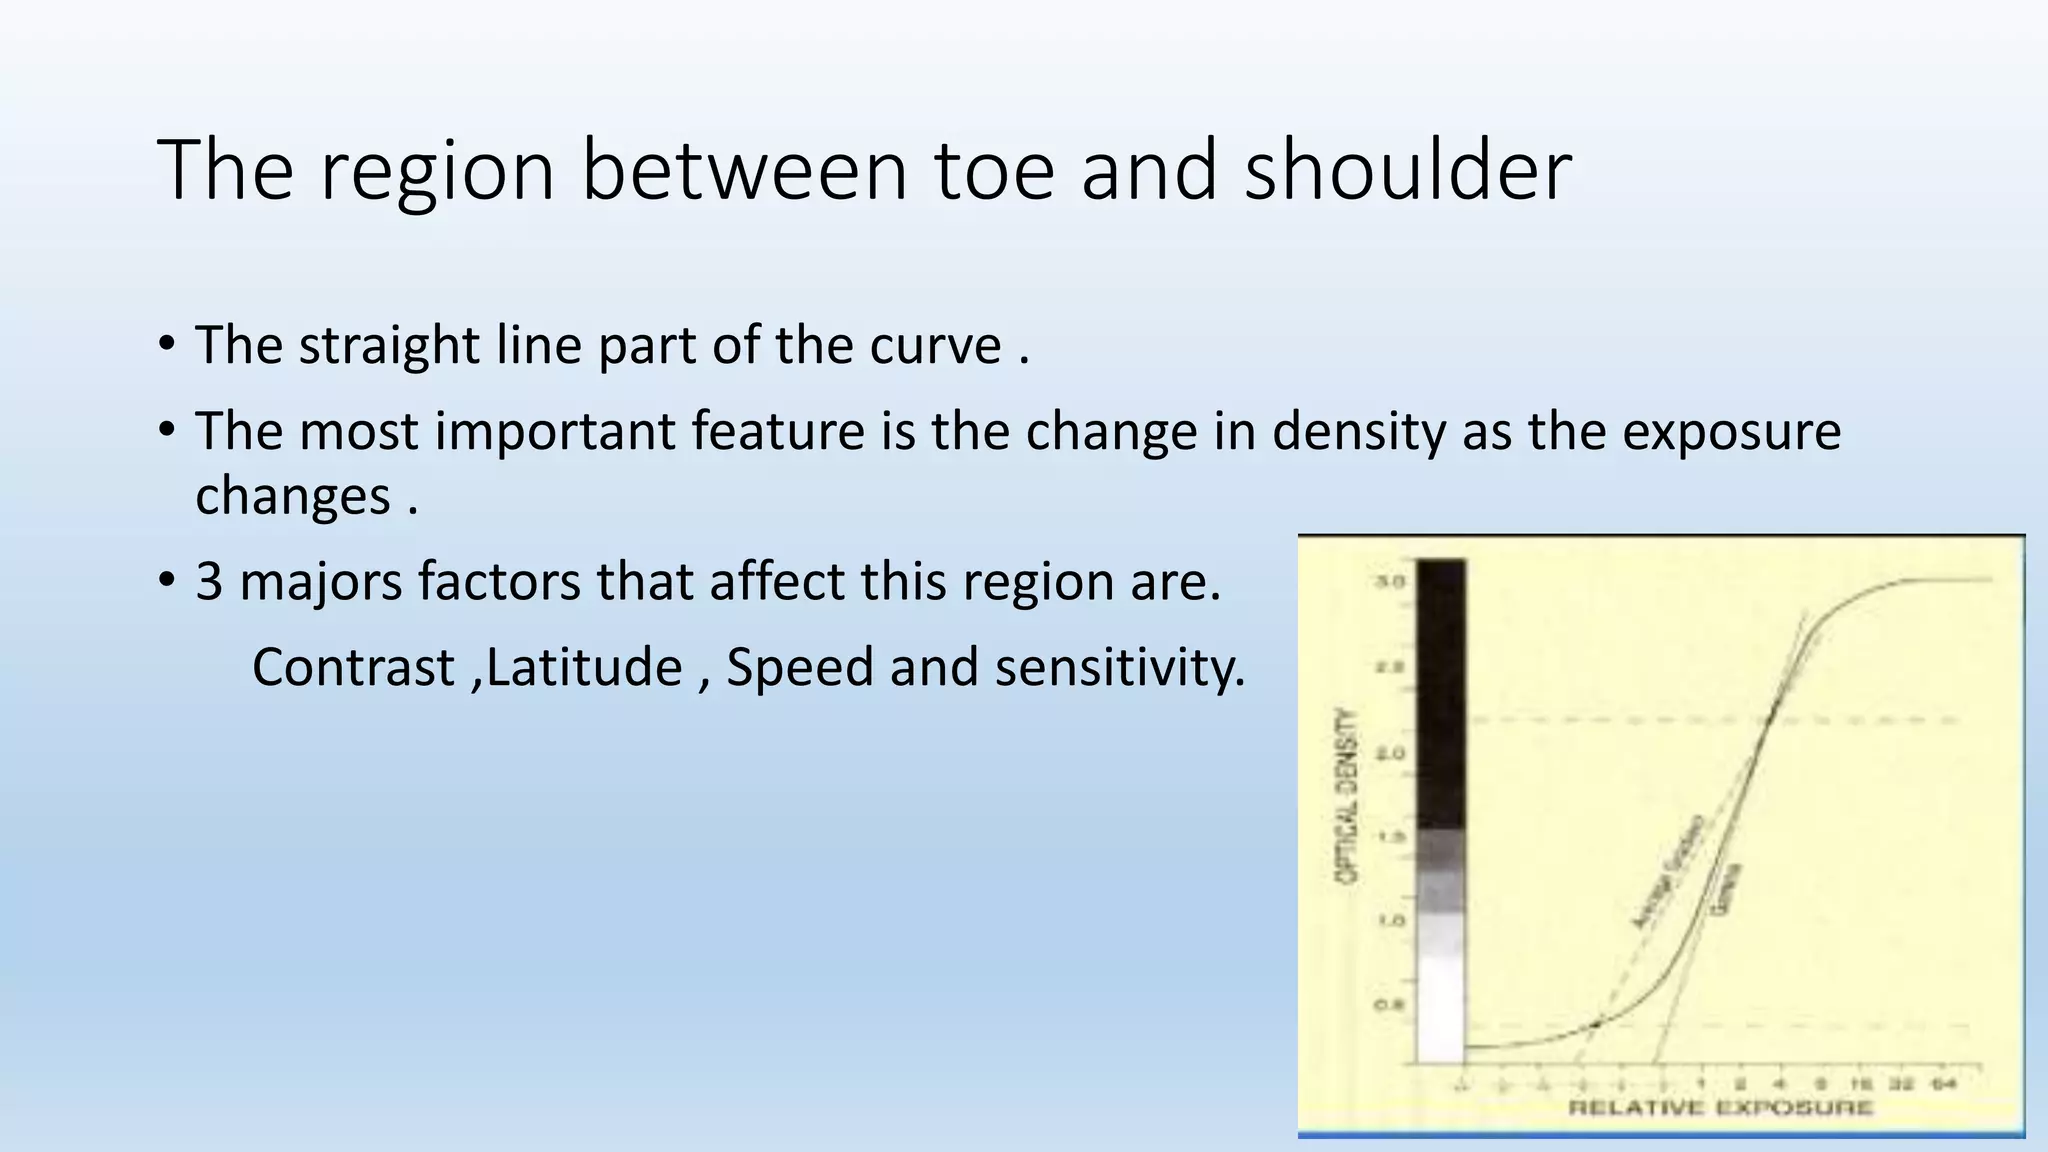
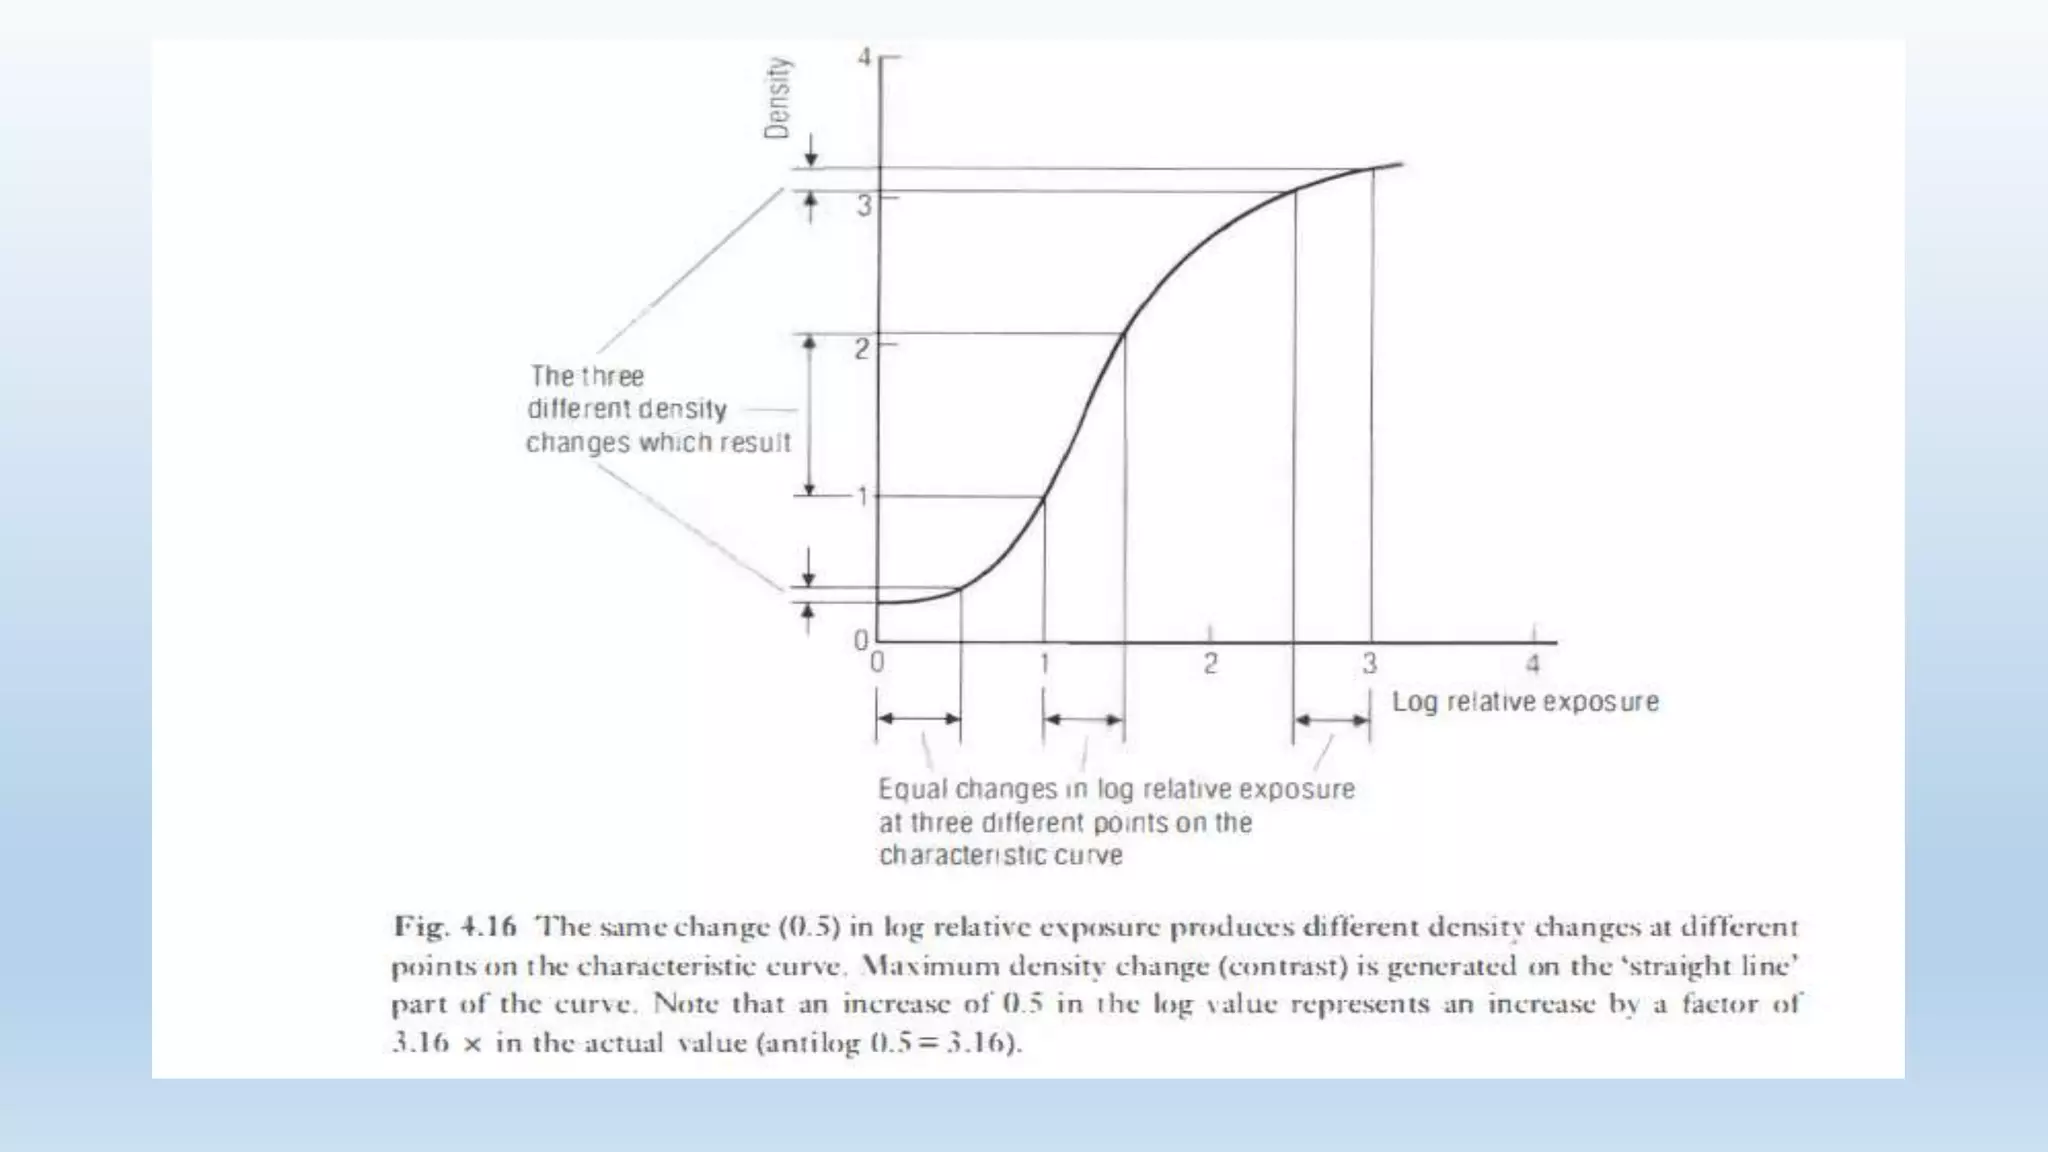
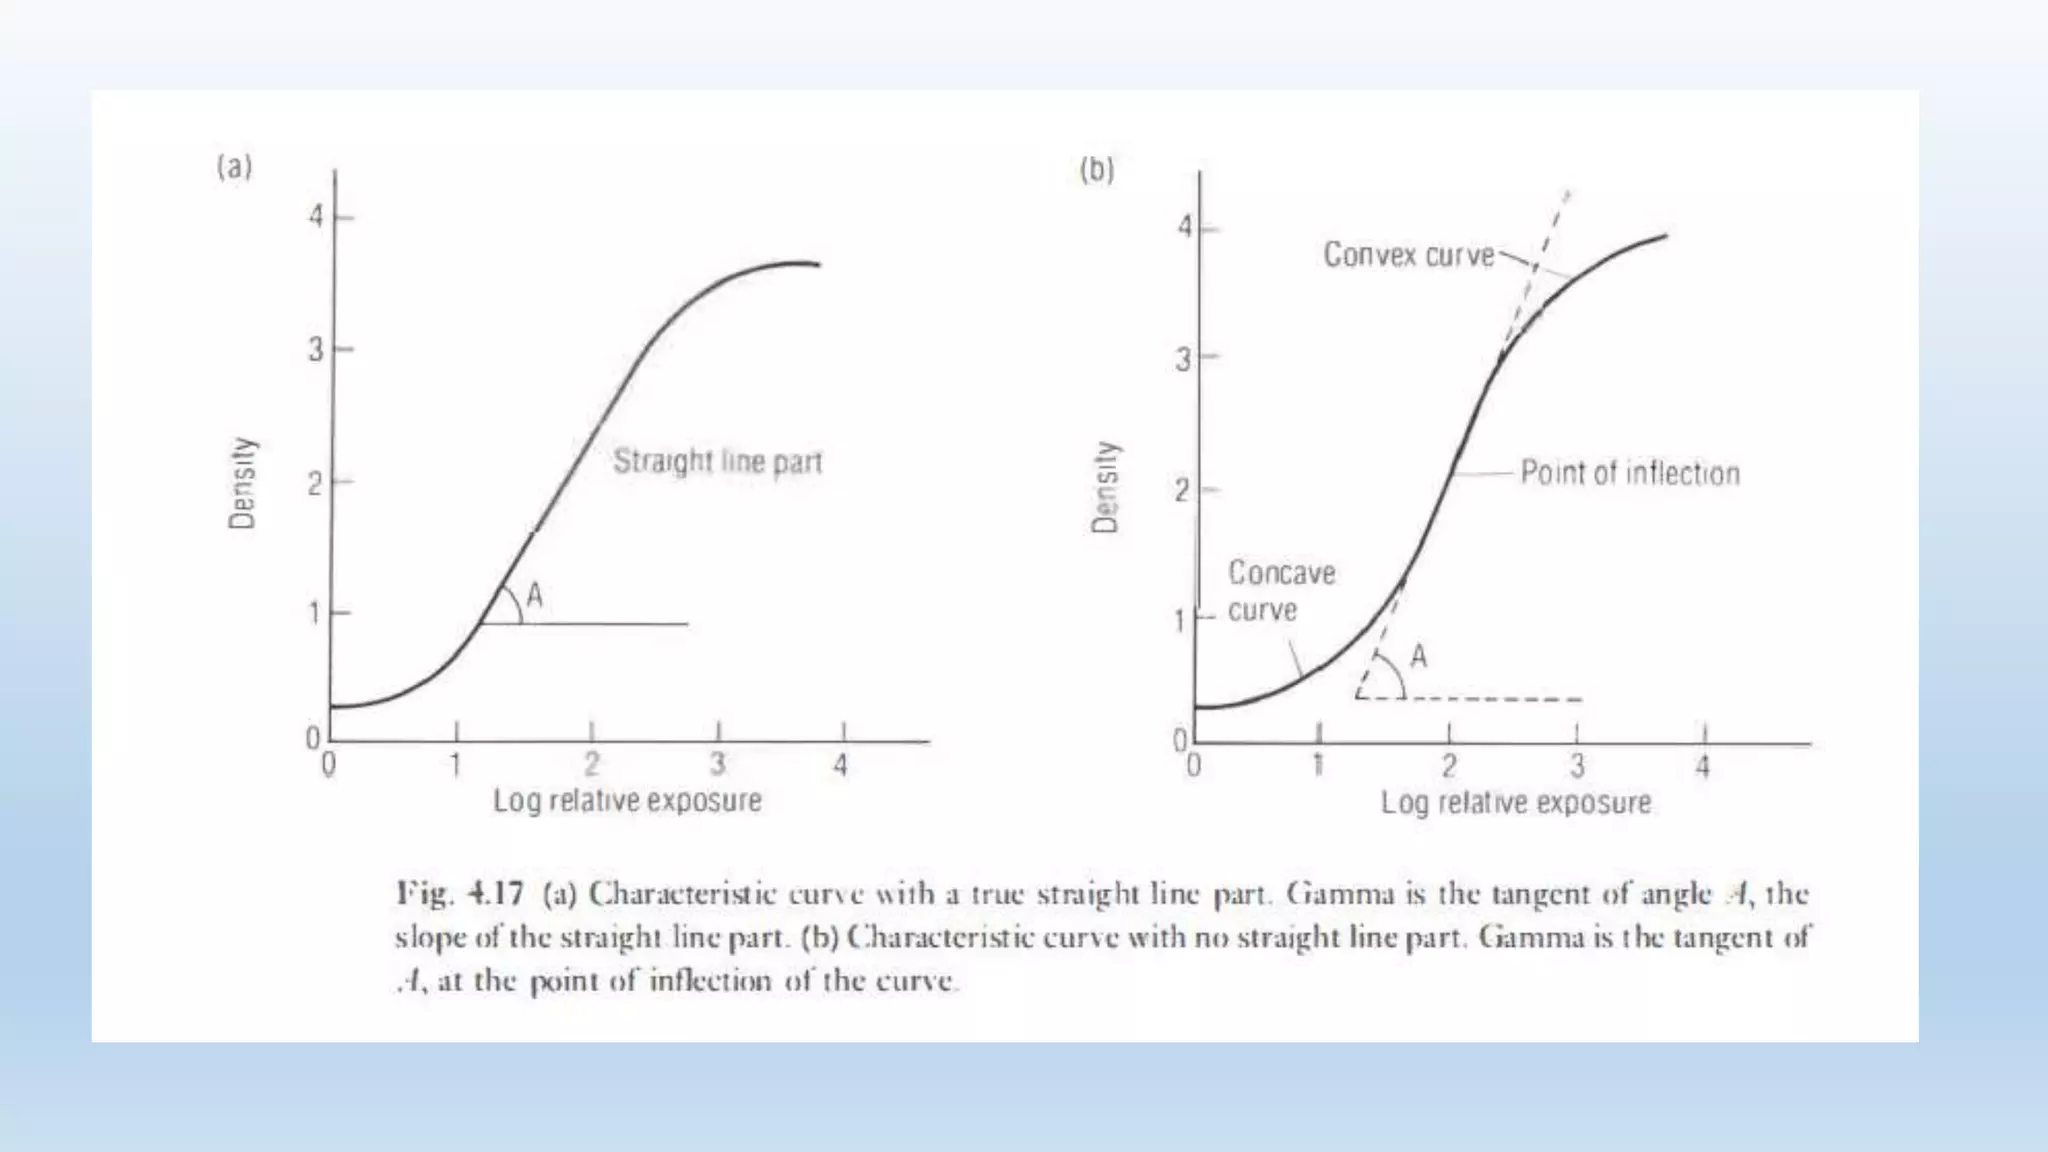
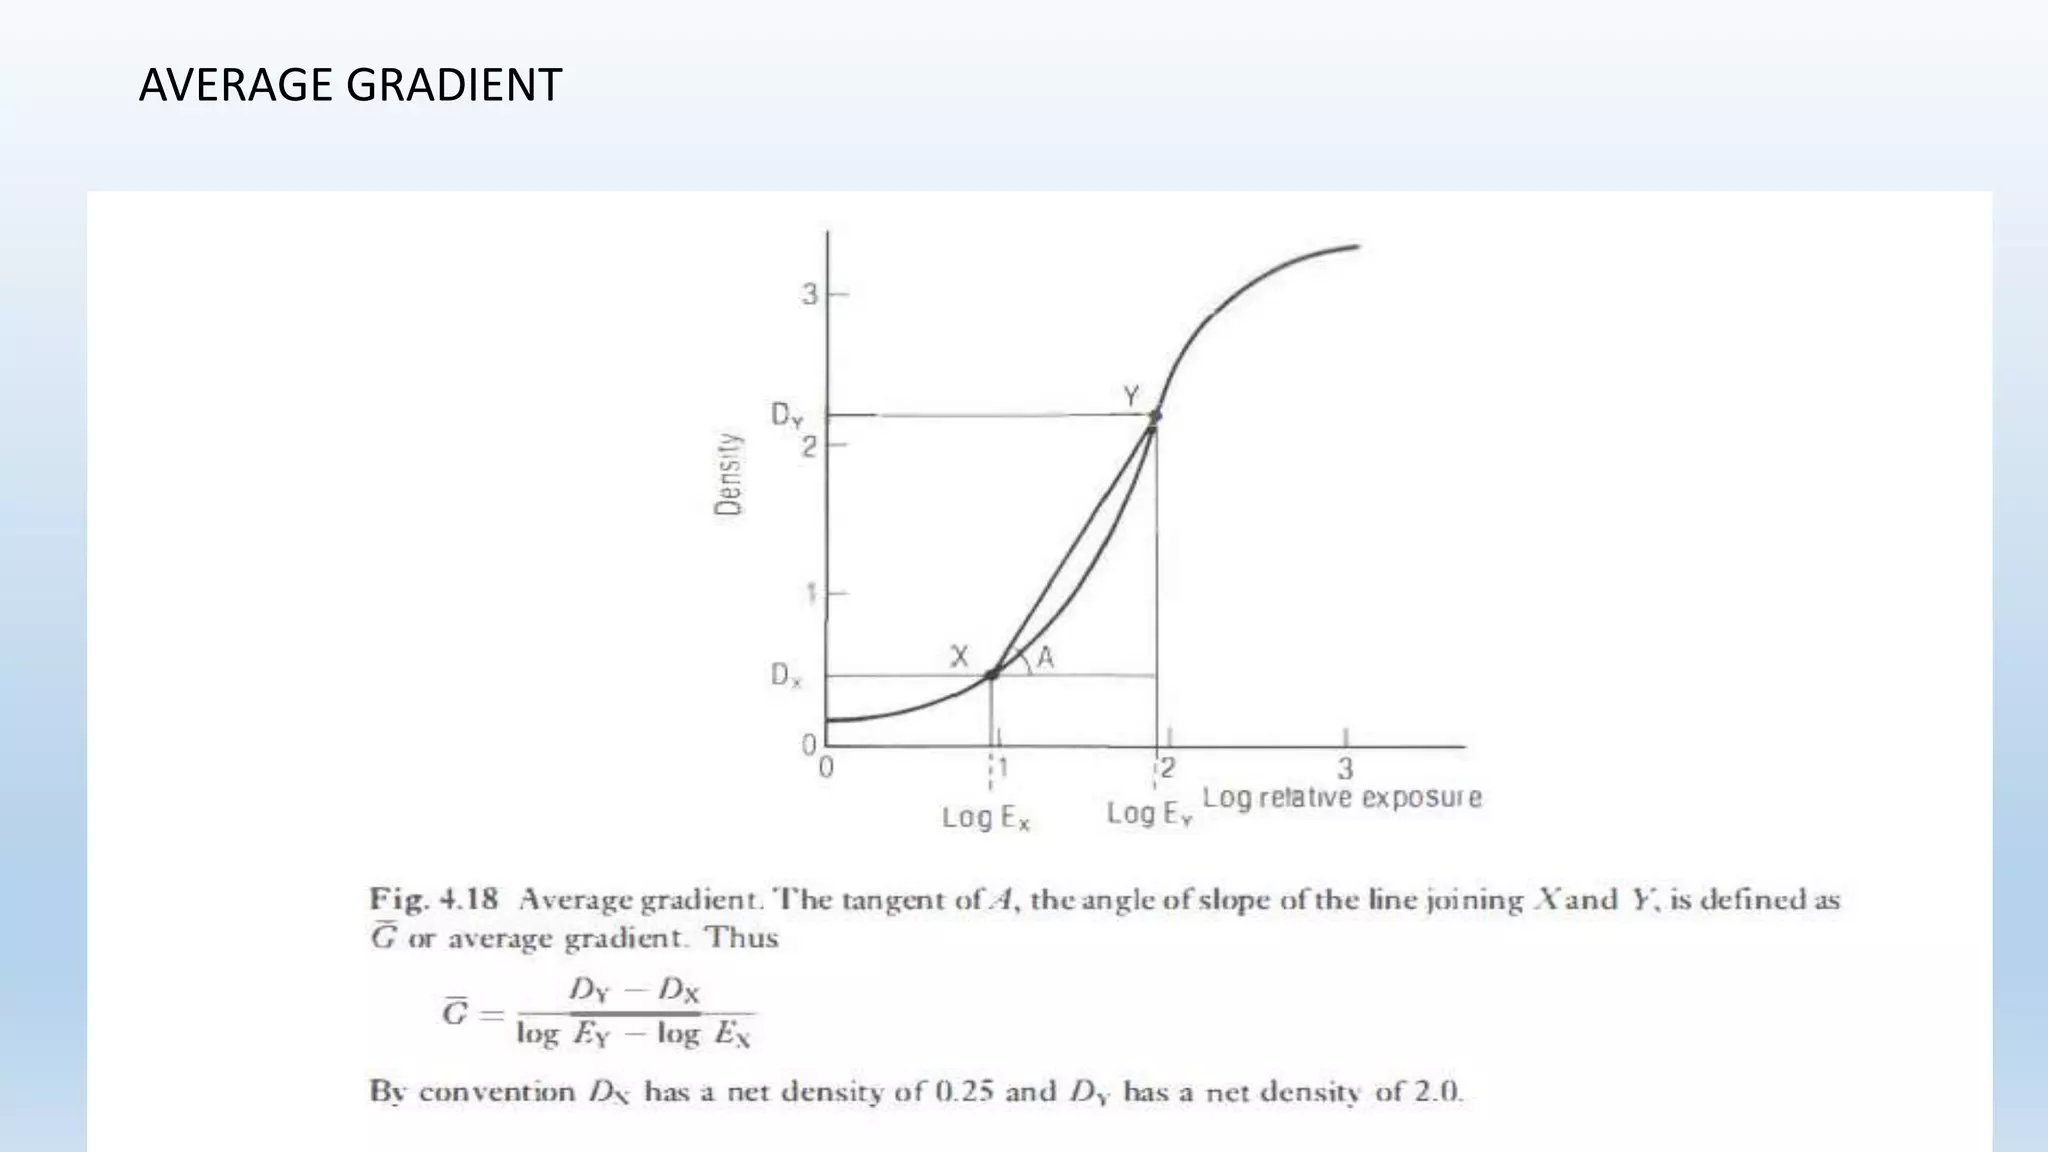
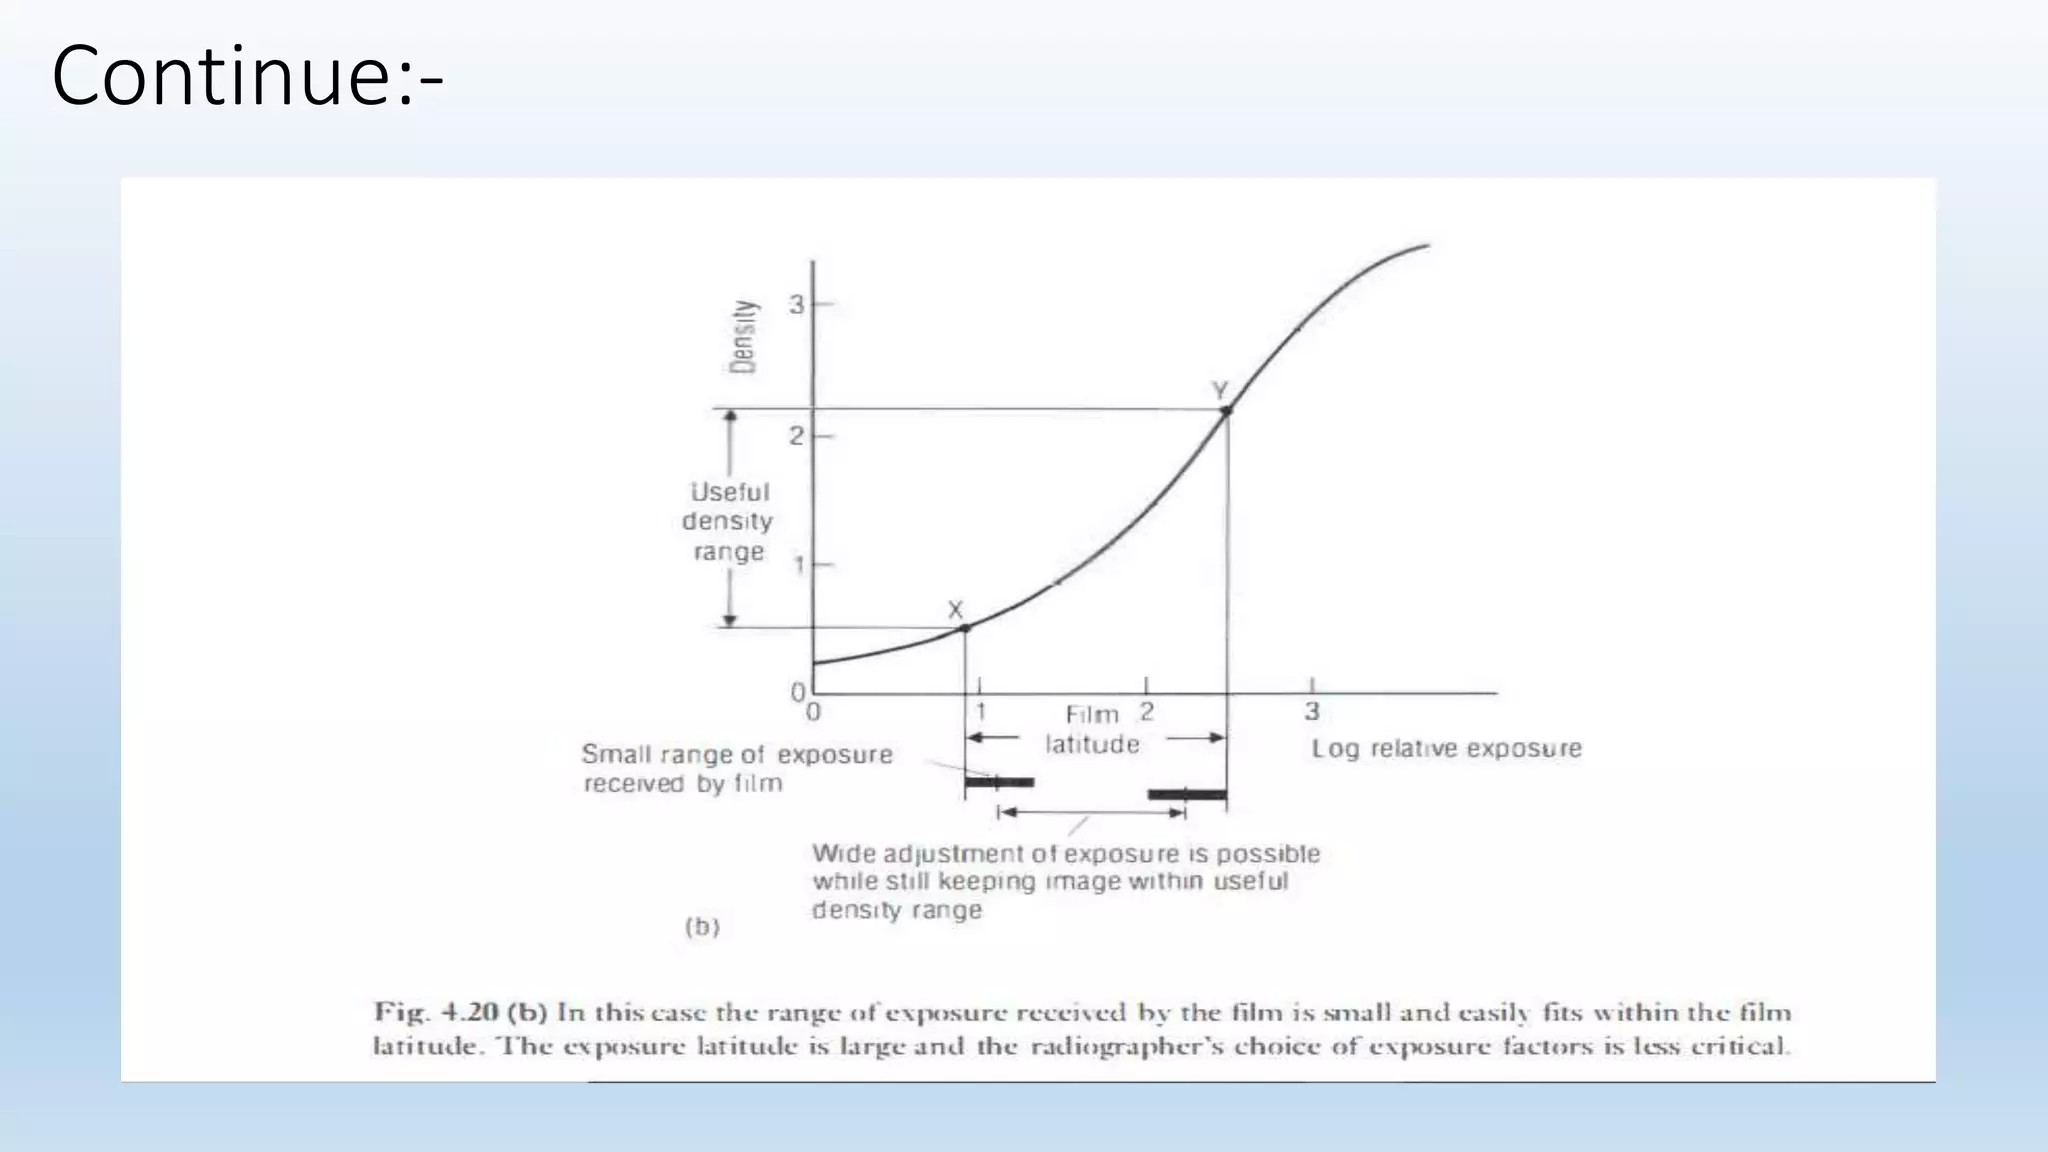
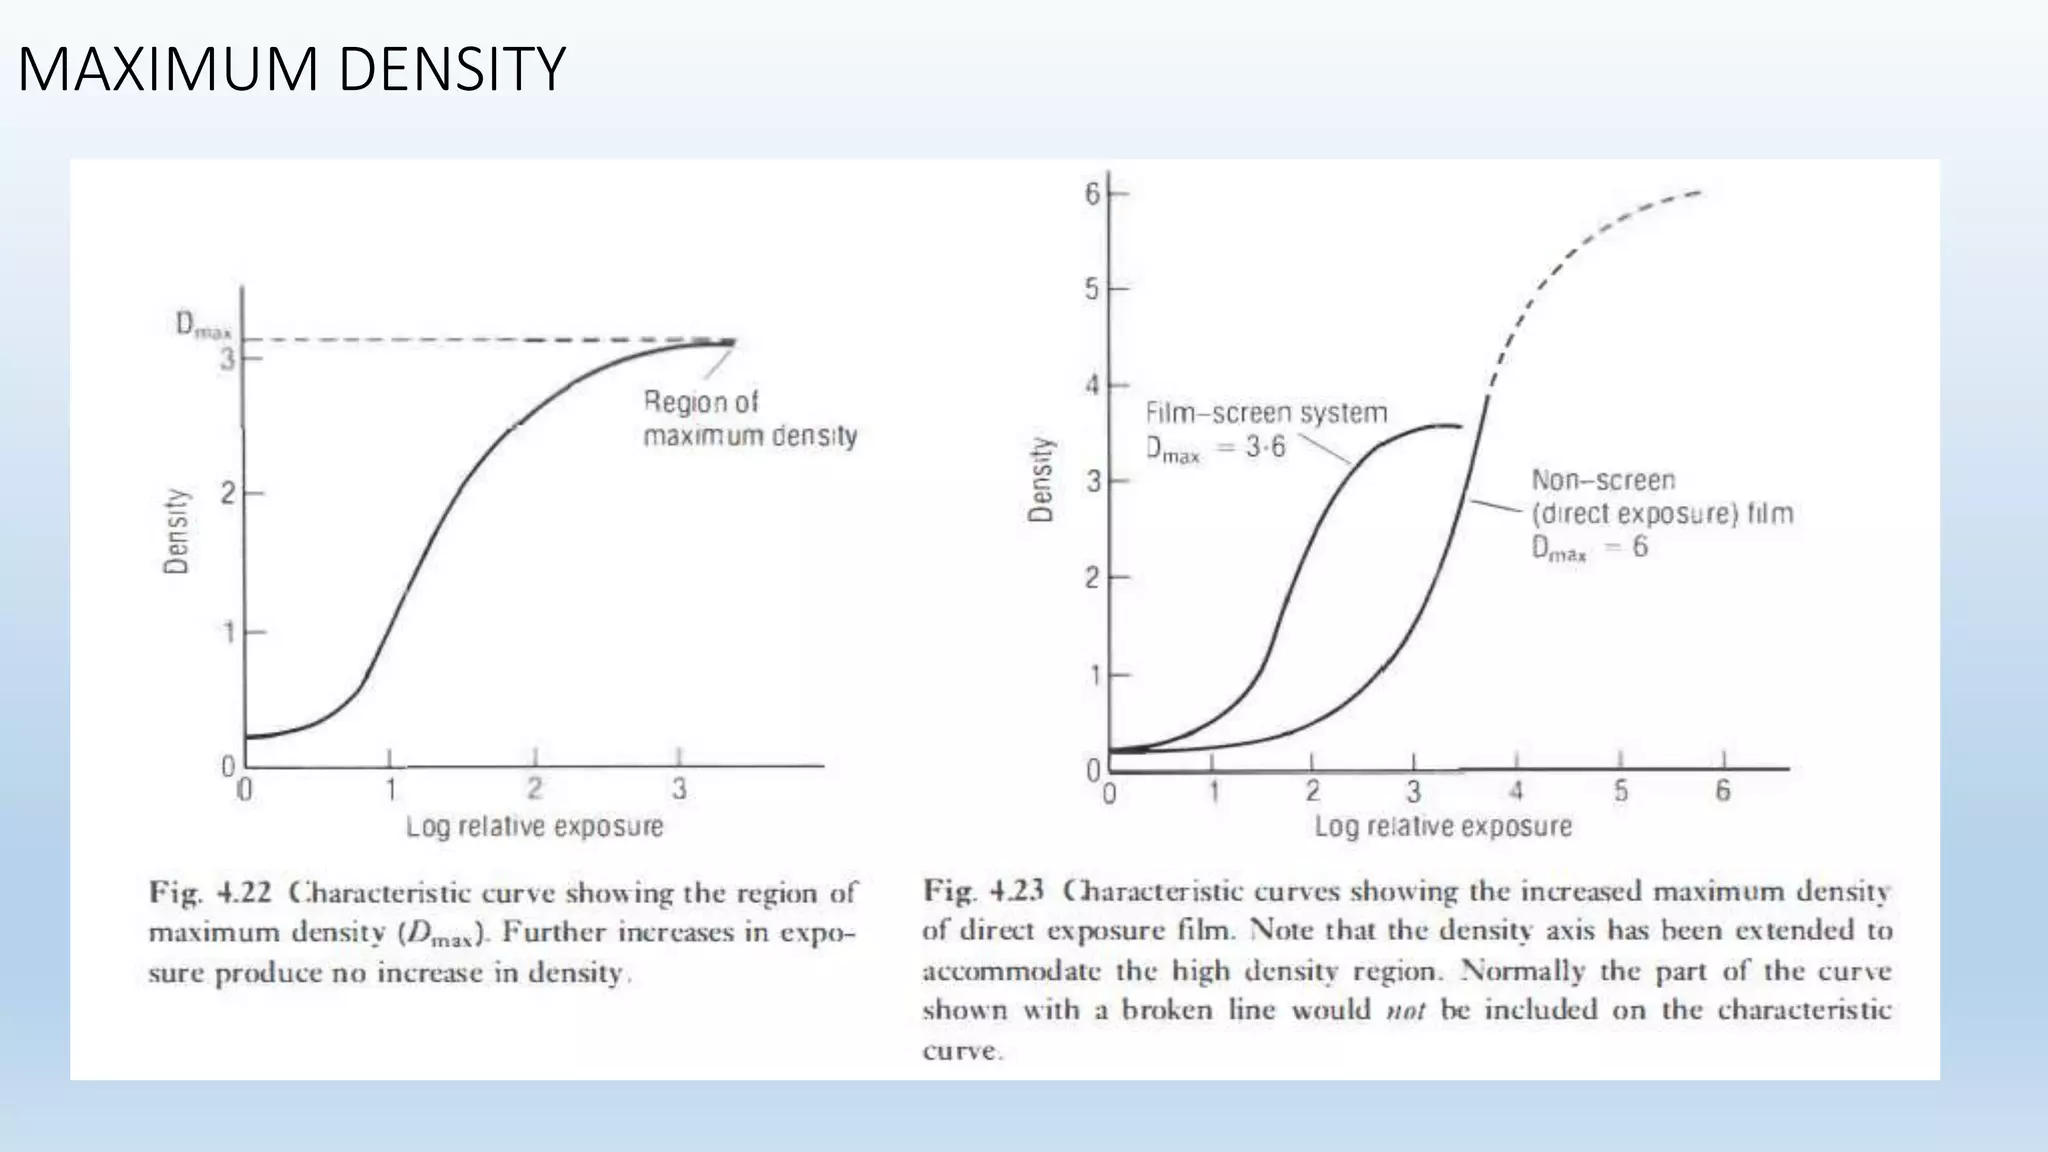
2. INDEX
1. SENSITOMERTY AND HISTORY
2. DENSITY (TRANSPARECY AND OPACITY) ,OPTICAL DENSITY
3. XRAY EXPOSURE, RELATIVE EXPOSURE, LOG RELATVE EXPOSURE
4. THE CHARACTERSTIC CURVE
5. HOW THE CURVE IS PRODUCED?
6. PLOTTING THE CURVE
7. TOE OF THE CURVE(BASE DENSITY,FOG,THRESHOLD)
8. REGION BETWEEN TOE AND SHOULDER (CONTRAST, LATITUDE, SPEED)
9. SHOULDER OF THE CURVE
10. APPLICATION OF SENSITOMETRY
3. SENSITOMETRY
• The scientific study of the response to exposure of the photo
sensitive material.
• FERDINANAD HURTER and VERO CHARLES DRIFFIELD .(1890)
• A characteristic curve shows the representation of the sensitometry.
• Photo sensitive material (xray films) are used to record the invisible
xray images.
• The performance of the image recording system is tested that how
well an emulsion is responding to the exposure we are giving.
4. Photographic Density
When a film is exposed and processed a blackening effect is produced,
Which is referred to as the density of the film.
• TRANSPARENCY
• OPACITY
• OPTICAL DENSITY
5. TRANSPARENCY
• The number of transmitted light passing through a film.
TRANSPARENCY = intensity of transmitted light
intensity of incident light
6. OPACITY
• It is the ability to stop light.
OPACITY = intensity of incident light
intensity of transmitted light
NOTE:- The action of radiation is to blacken rather then lighten the film.
Higher density means a blacker film.
7. OPTICAL DENSITY
• Difference in optical density is called contrast, where optical density is the
no of shades of grey in an Image .(degree of blackening)
• Expressed as the ratio of incident light to transmitted light.
• O.D varies from 0.20 -3.5
• Density increases with increase in exposure .
8. Log concept:-
• Conveniently express large differences in numbers on a small scale.
ex= like density of 1000 =3 (when converted by log concept)
• The human eyes respond different tones in a way which is
approximately logarithmic .
ex= a density of 2 looks twice as dark as 1 .
• Deals with the addition or superimposition of films.
9. X-RAY EXPOSURE
• In conventional , x ray interacts with the recording system.
• A film screen system has its intensifying screen exposed to xray.
• A non screen system has its film directly exposed to x ray.
so sensitometer is used to measure the rate of exposure and effect on
emulsion.
2 types of exposure are used for the illustration of the
characteristic curve
1. RELATIVE EXPOSURE
2. LOG RELATIVE EXPOSURE
10. RELATIVE EXPOSURE
• In this lt is considered that if an exposure time of 0.01s is used to
expose an area A and 0.02s is used for area B , than the area B is
considered to receive twice the xray exposure to area A.
• The relative exposure is 2 at B compared with 1 at A .
• Different exposure of varying kvp and mas are made.
• The smallest area of exposure is used as Baseline
11. LOG RELATIVE EXPOSURE
• The range of exposure reaching different areas of the film screen
system is very great .
• To make it easy we use log concept.
12. THE CHARACTERISTIC CURVE
• A graph which illustrates the way in which a film or film screen system
responds to different levels of exposure.
(describing sensitometric behavior of a photographic recording
system)
• The curve is a plot of Optical density against log relative exposure .
• Also known as H and D curve after the 2 pioneers in sensitometry .
FERDINANAD HURTER AND VERO CHARLES DRIFFIELD
13. How the curve is produced?
• Expose and process a film.
• Measuring the densities produced.
• Plotting the curve .
14.
15. Exposing and processing
• The film is irradiated with a series of exposure and the progress is
recorded in steps .
• WEDGE FACTOR:- the relationship between one exposure and the
next is known as the WEDGE FACTOR.
• The smallest exposure made shall have no measurable effect.
• The heaviest exposure made shall activate all the silver halides.
• Exposure values are achieved in 2 ways .
1. Time – scale sensitometry.
2. intensity-scale sensitometry .
16. Time – scale sensitometry
• Each area on the film is exposed to same intensity but duration of
exposure is varied.
tube kv, focal spot setting, FFD and mA
INTENSITY- scale sensitometry
Using variation along intensity scale.
17. X-RAY EXPOSURE
• To plot the curve we need intensity variation and this is achieved by a
steeped wedge made up of Al.
• The different attenuation caused by the wedge provides the required
range of intensities for the graph.
• Visible light exposure =sensitometer
18. DENSITOMTER
• The optical density of each exposed area on the film is measured by a
densitometer.
• Density is read out from a digital display using pointer and calibrated
scale.
20. The characteristic curve
• The graph has 2 sharp curves
The toe and The shoulder
• The region of the toe is determined by
Base density , Fog , Threshold
• The region between the toe and the shoulder is determined by
contrast, gradient, film latitude, exposure latitude, speed and
sensitivity
• The region to the right og the shoulder is determined by
Maximum density, Reversal
21. The Toe region
• It is the underexposed area.
• Shows values from 0-0.6 .
• There is hardly any change in the density to produce any
photographic effect.
• The density of the toe is based on 3 things
Base density , Fog and threshold
22. Base density
• The density produced by exposure when it transmits the polyster base.
FOG
• The density produced by development process which has no intentional
exposure.
Causes:-
Ageing of the film
Poor conditions for storage
chemical fog
Net Density = Gross density – Gross fog
24. The region between toe and shoulder
• The straight line part of the curve .
• The most important feature is the change in density as the exposure
changes .
• 3 majors factors that affect this region are.
Contrast ,Latitude , Speed and sensitivity.
25. Contrast
• Contrast generates difference in image density .
• The greatest density difference is between toe and shoulder region.
• The slope or gradient of the curve is used as a measure of contrast.
• G= tan A where tan A is the trigonometric tangent of A
• Gamma = the tangent of the angle of slope of the straight line part of
the curve .
• Maximum gamma = The point of inflection in the curve from being
concave to convex.
26.
27.
28. Average Gradient
• The area of the slope represented by X and Y is the area most important for
diagnostic purpose.
• X has a net density of 0.25.
• Y has a net density of 2.
G=Dy-Dx (2-0.25=1.75)
This is the useful density value as most of the radiographs fall under this value.
Factors affecting Average Gradient :-
Film emulsion
single or double coated film
Film processing
intensifying screen
30. latitude
• The expression of the tolerance of the system to extreme conditions
of exposure .
• shows the ability to record successfully a wide range of exposure.
• It of 2 types
Film latitude
Exposure latitude
32. EXPOSURE LATITUDE
The tolerance of a film to errors in the selection of the exposure factors
(kVp, mA, mAs).
It also provides room for error on selection of exposure factors.
Depends on film latitude and subject contrast .
2 factors that define Exposure latitude are:-
a- The median of log exposure value= This represents the difference
between maximum and minimum log exposure values and depends on the
total quantity of the xrays.
b-The range of the log exposure values:- This represents the
difference between maximum and minimum log exposure values and
depends on the quality of the xray and subject contrast.
35. SPEED AND SENSITIVITY
• Sensitivity refers to the exposure required by a film to produce a net
density of 1.
• A high sensitive or high speed system requires less exposure .
• The higher the speed of the system , the further to the left the curve
appears.
• Affected by:-
immersion time , solution temperature, chemical activity.
37. The region of the shoulder
• The upmost part of the graph .
• The region of overexposure.
• 2 factors that affect this region are:-
Maximum Density
Reversal
38. Maximum density
• When the exposure to the film is greatest and a maximum level of density
is achieved .
• Image contrast is 0.
• Depends on 2 things:-
1. Silver coating weight :- the greater the amount of silver halide the
greater the density.
Non-screen direct exposure film has higher Dmax than screen type
xray film.
2. Processing condition:- Exhaustion of the developing agent
Temperature variations .
Note- This maximum density of the film is used in mammography .
40. Reversal
• It is a strange phenomena in which the film respond in the opposite
way to normal , producing a reduction in image density as a result of
increase in exposure.
• Testing of the reversal properties:- The film is removed from the
cassette and exposed to bright light .
• A film which exhibits reversal will be almost transparent .
43. Use of characteristic curve
Information
Gross fog (Basic fog)
Threshold
contrast
Latitude (film and exposure)
Speed and sensitivity
Maximum Density
Reversal
Uses
Selection of films
Quality control
Selection of exposure factors
Comparision of screen systems
Duplication of Radiographs
44. References
• Chesney’s Radiographic imaging .
• Research papers:-
• Analysis of Sensitometry in Radiographic films using Optical Density
measurements.
• Sensitometric curve of radiographic films by xray fluorescence.