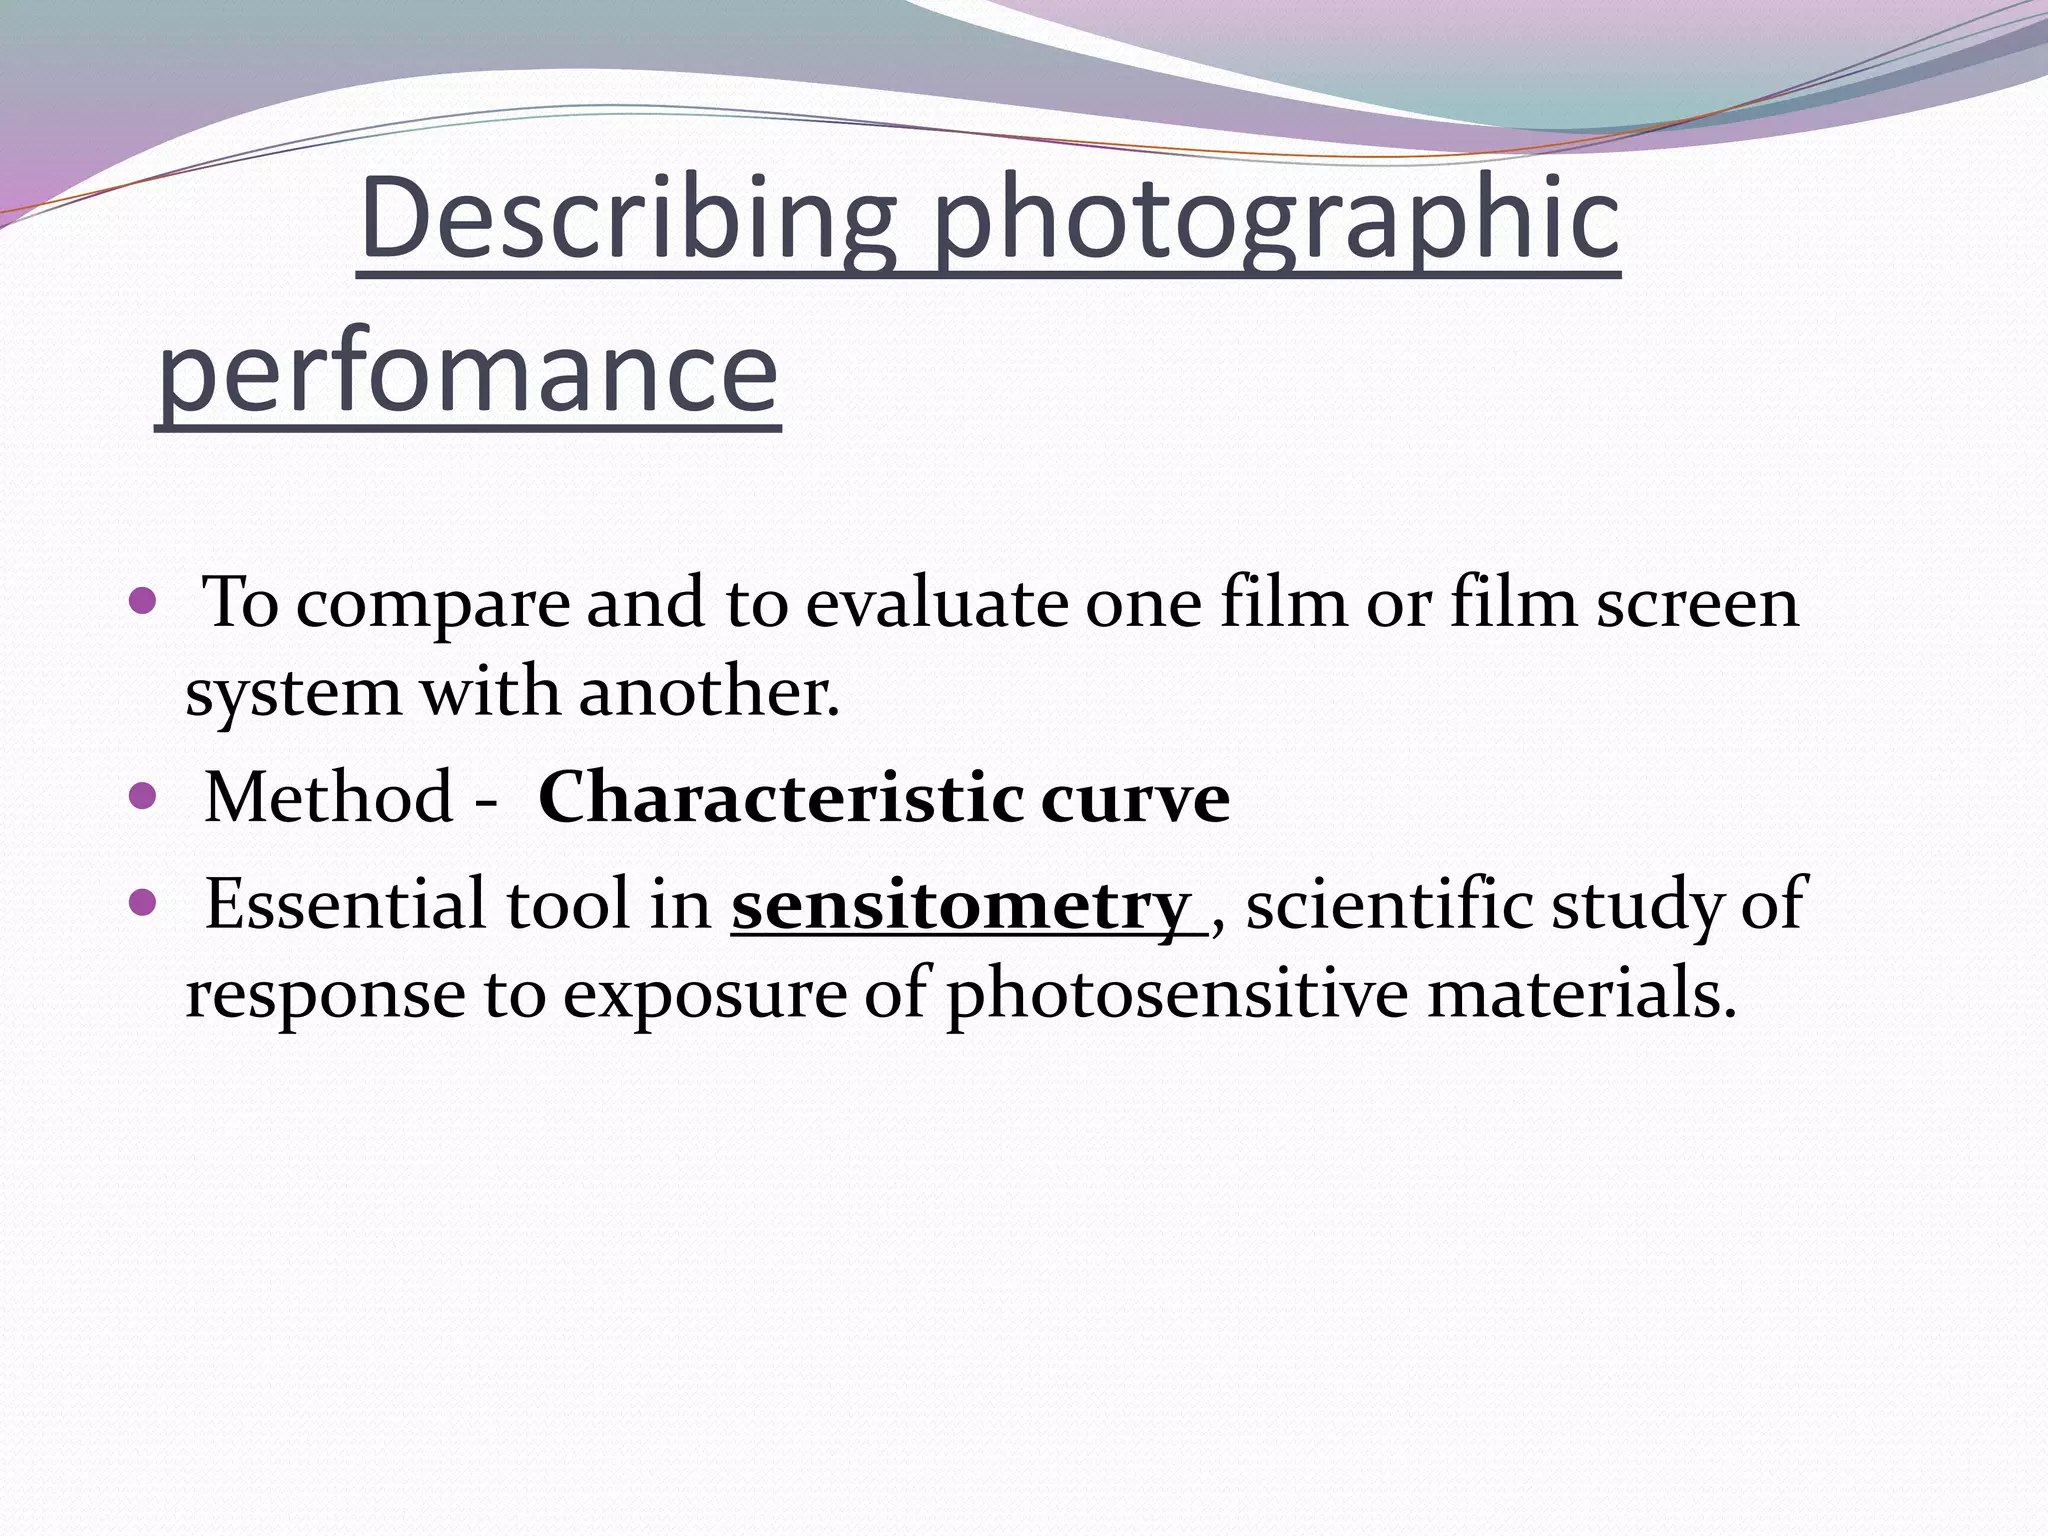
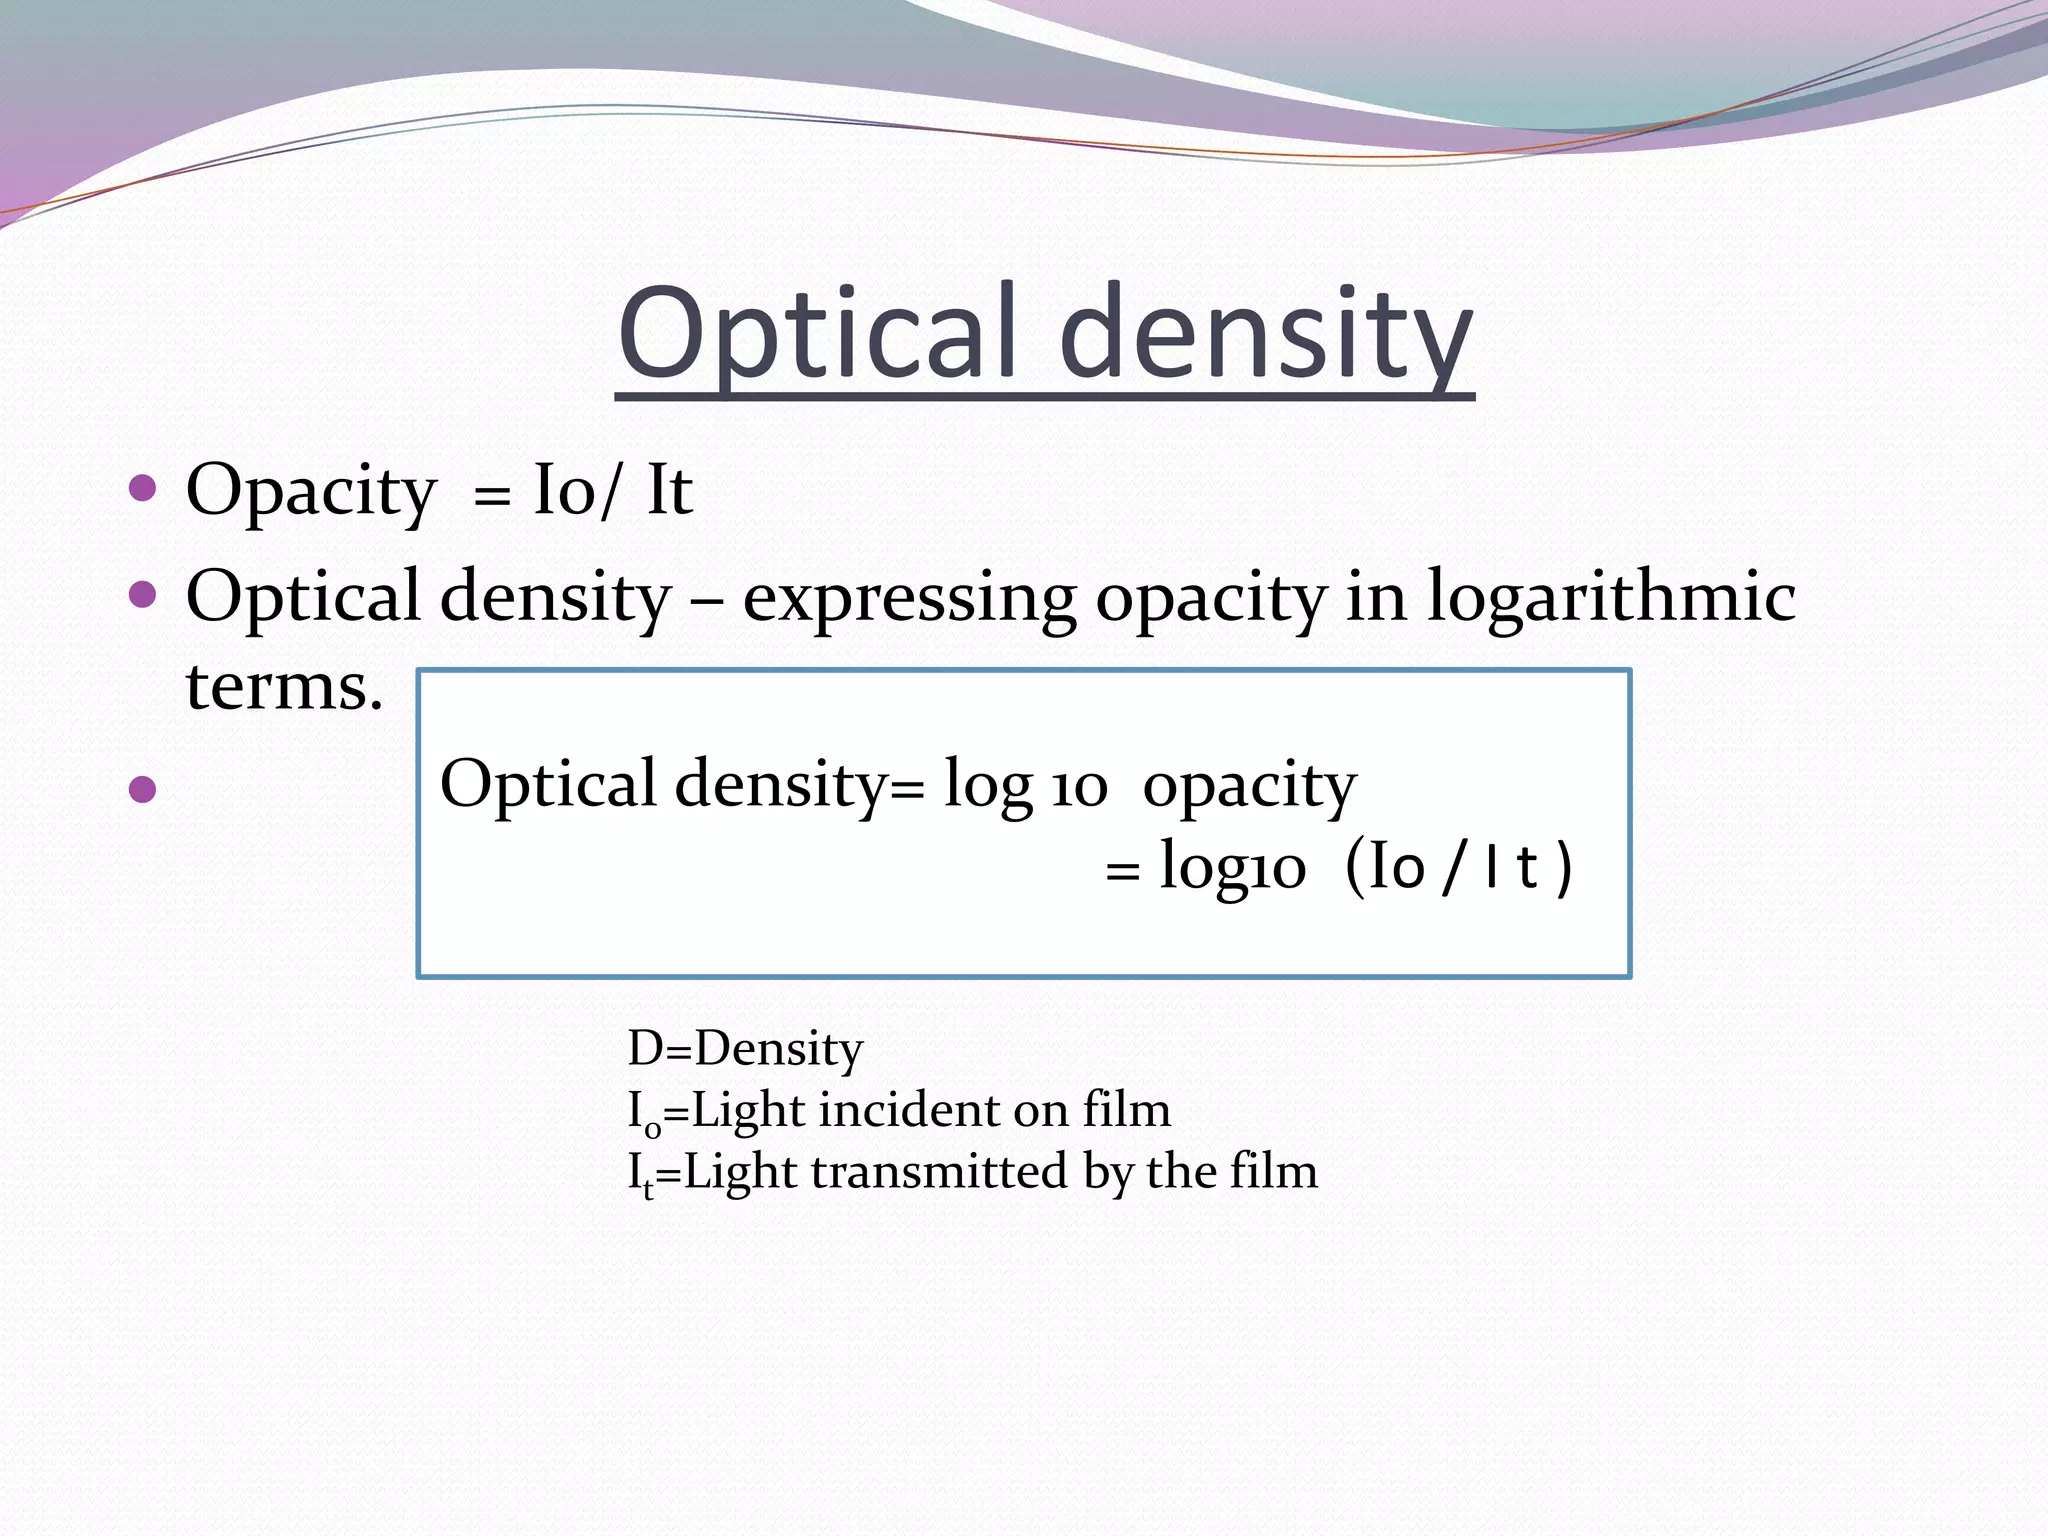
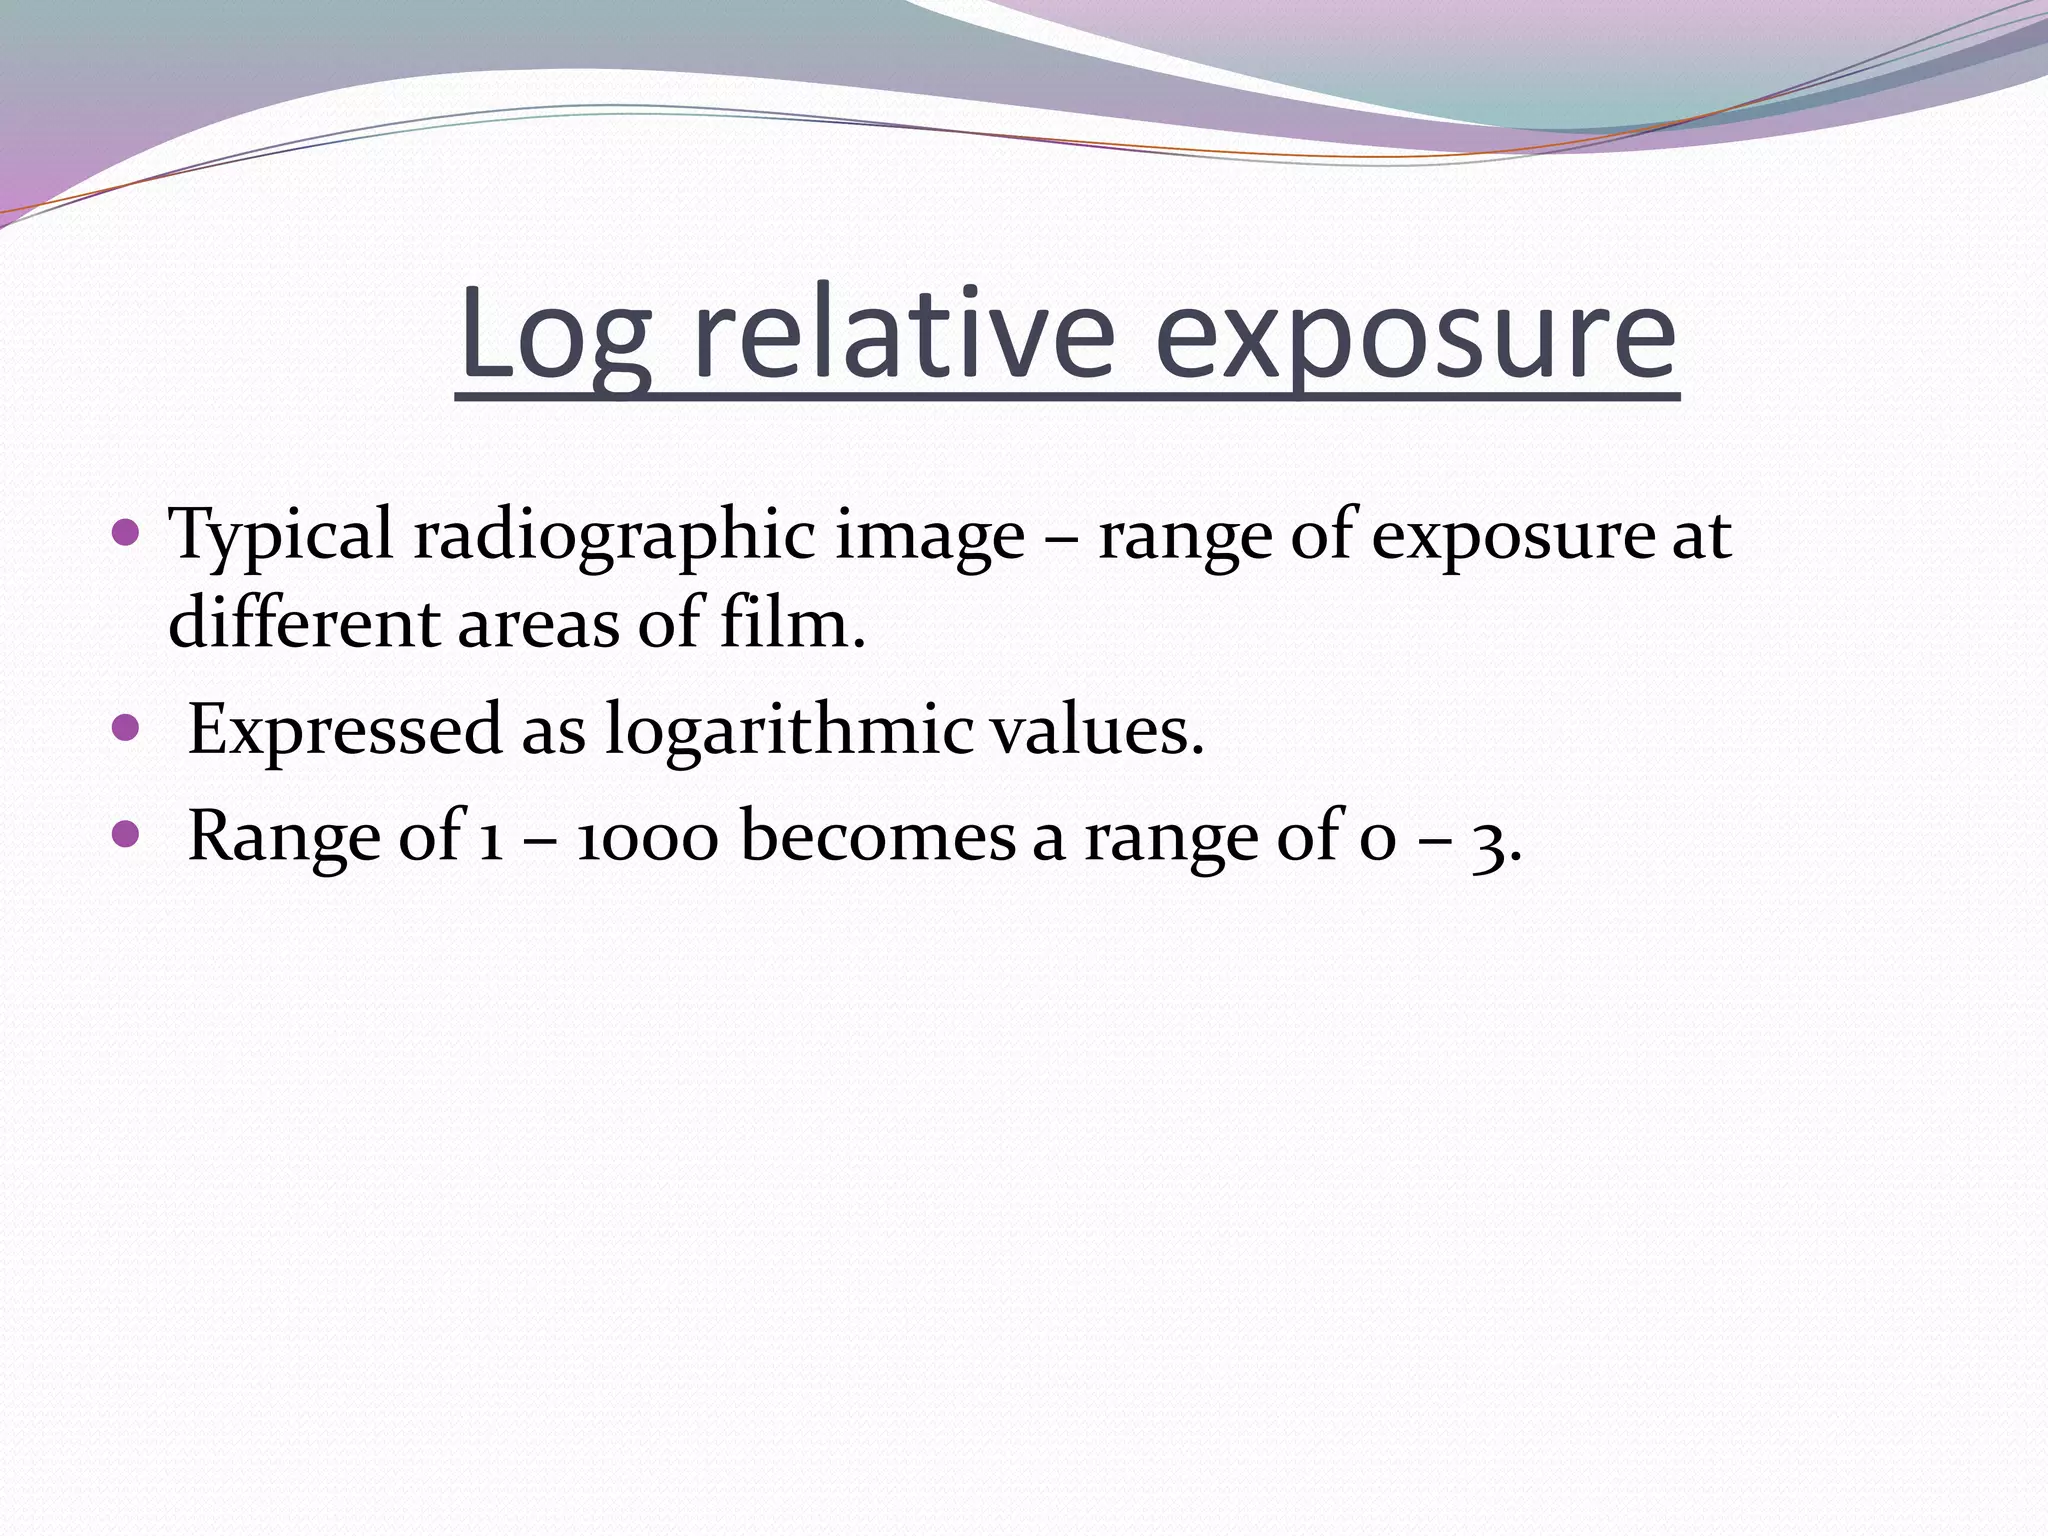
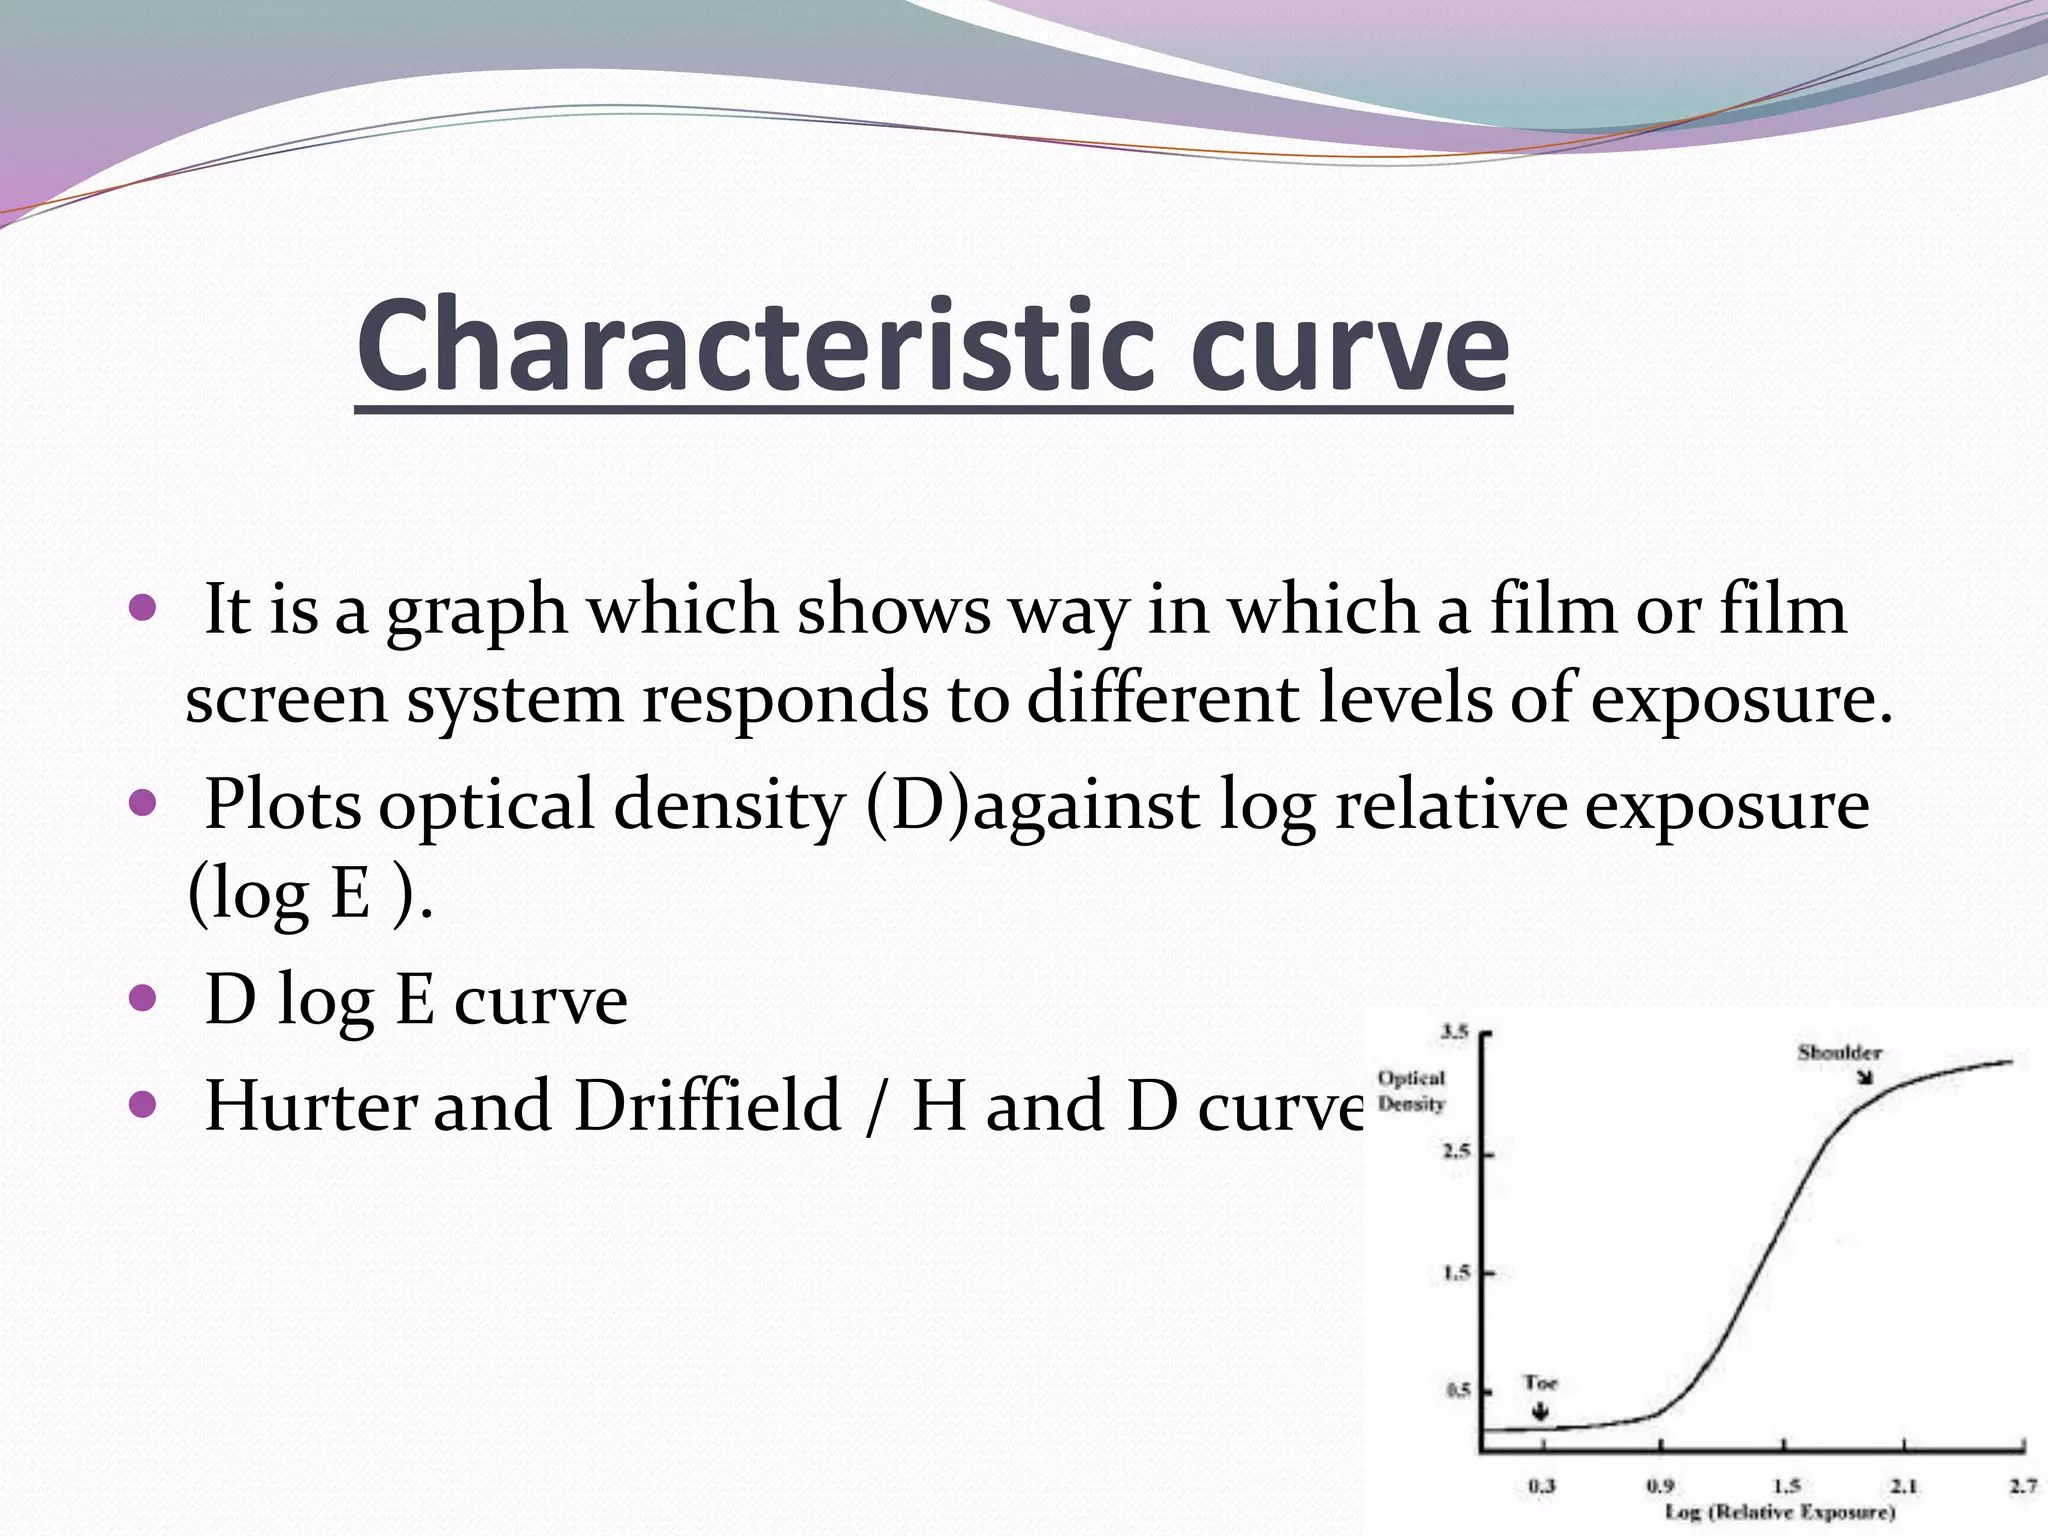
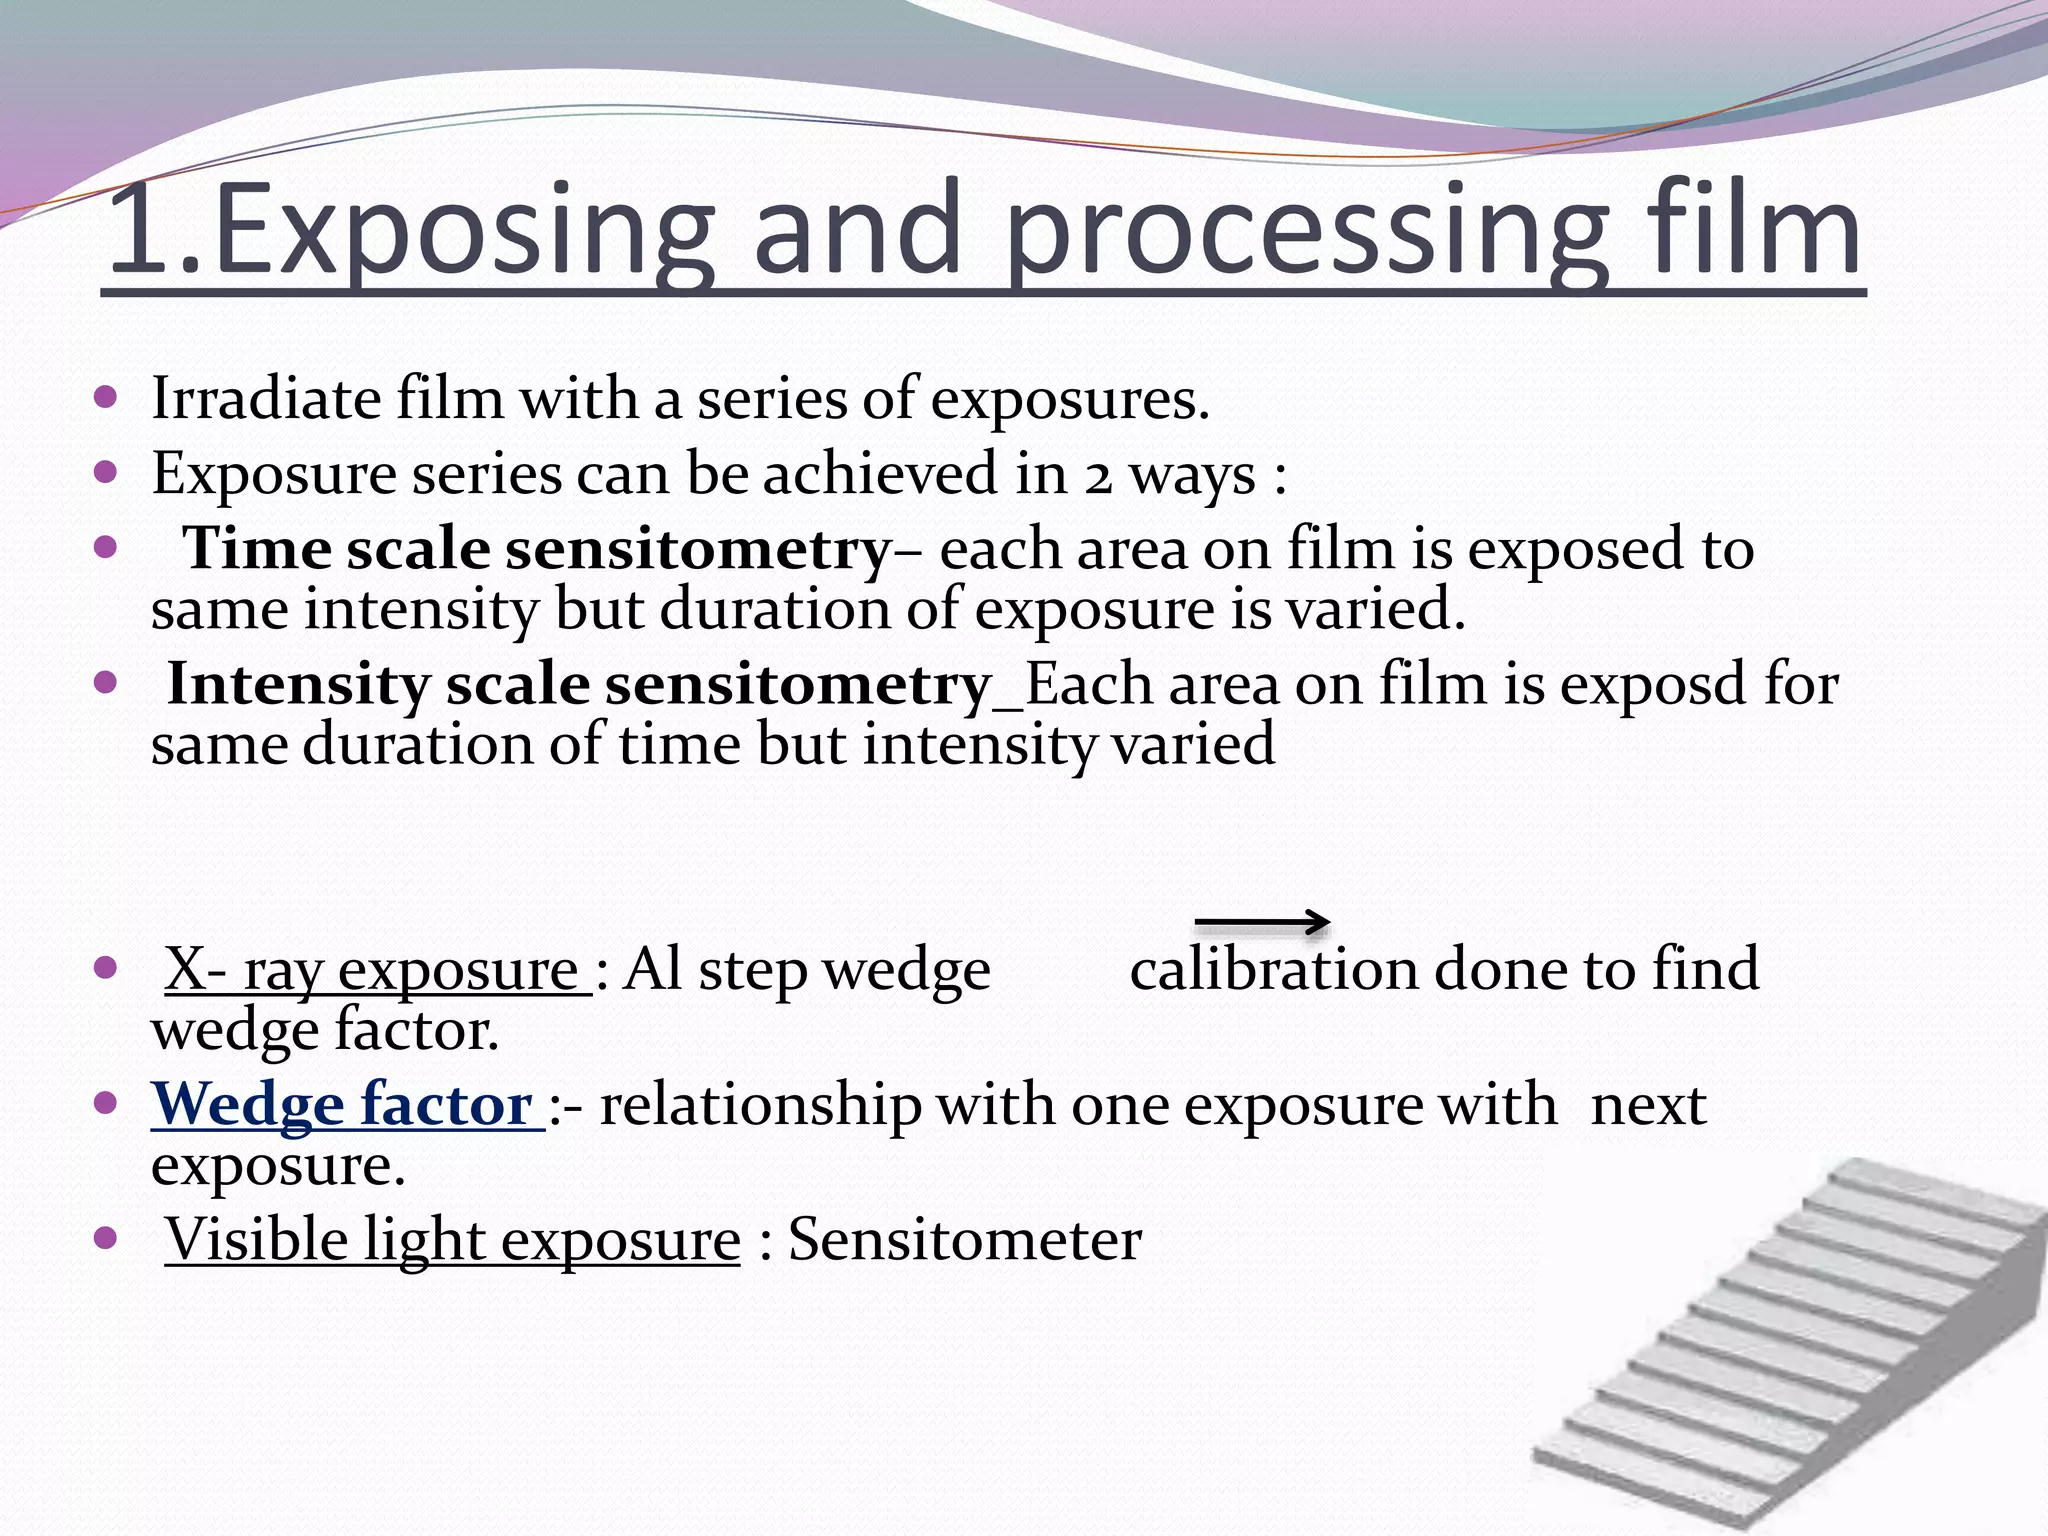
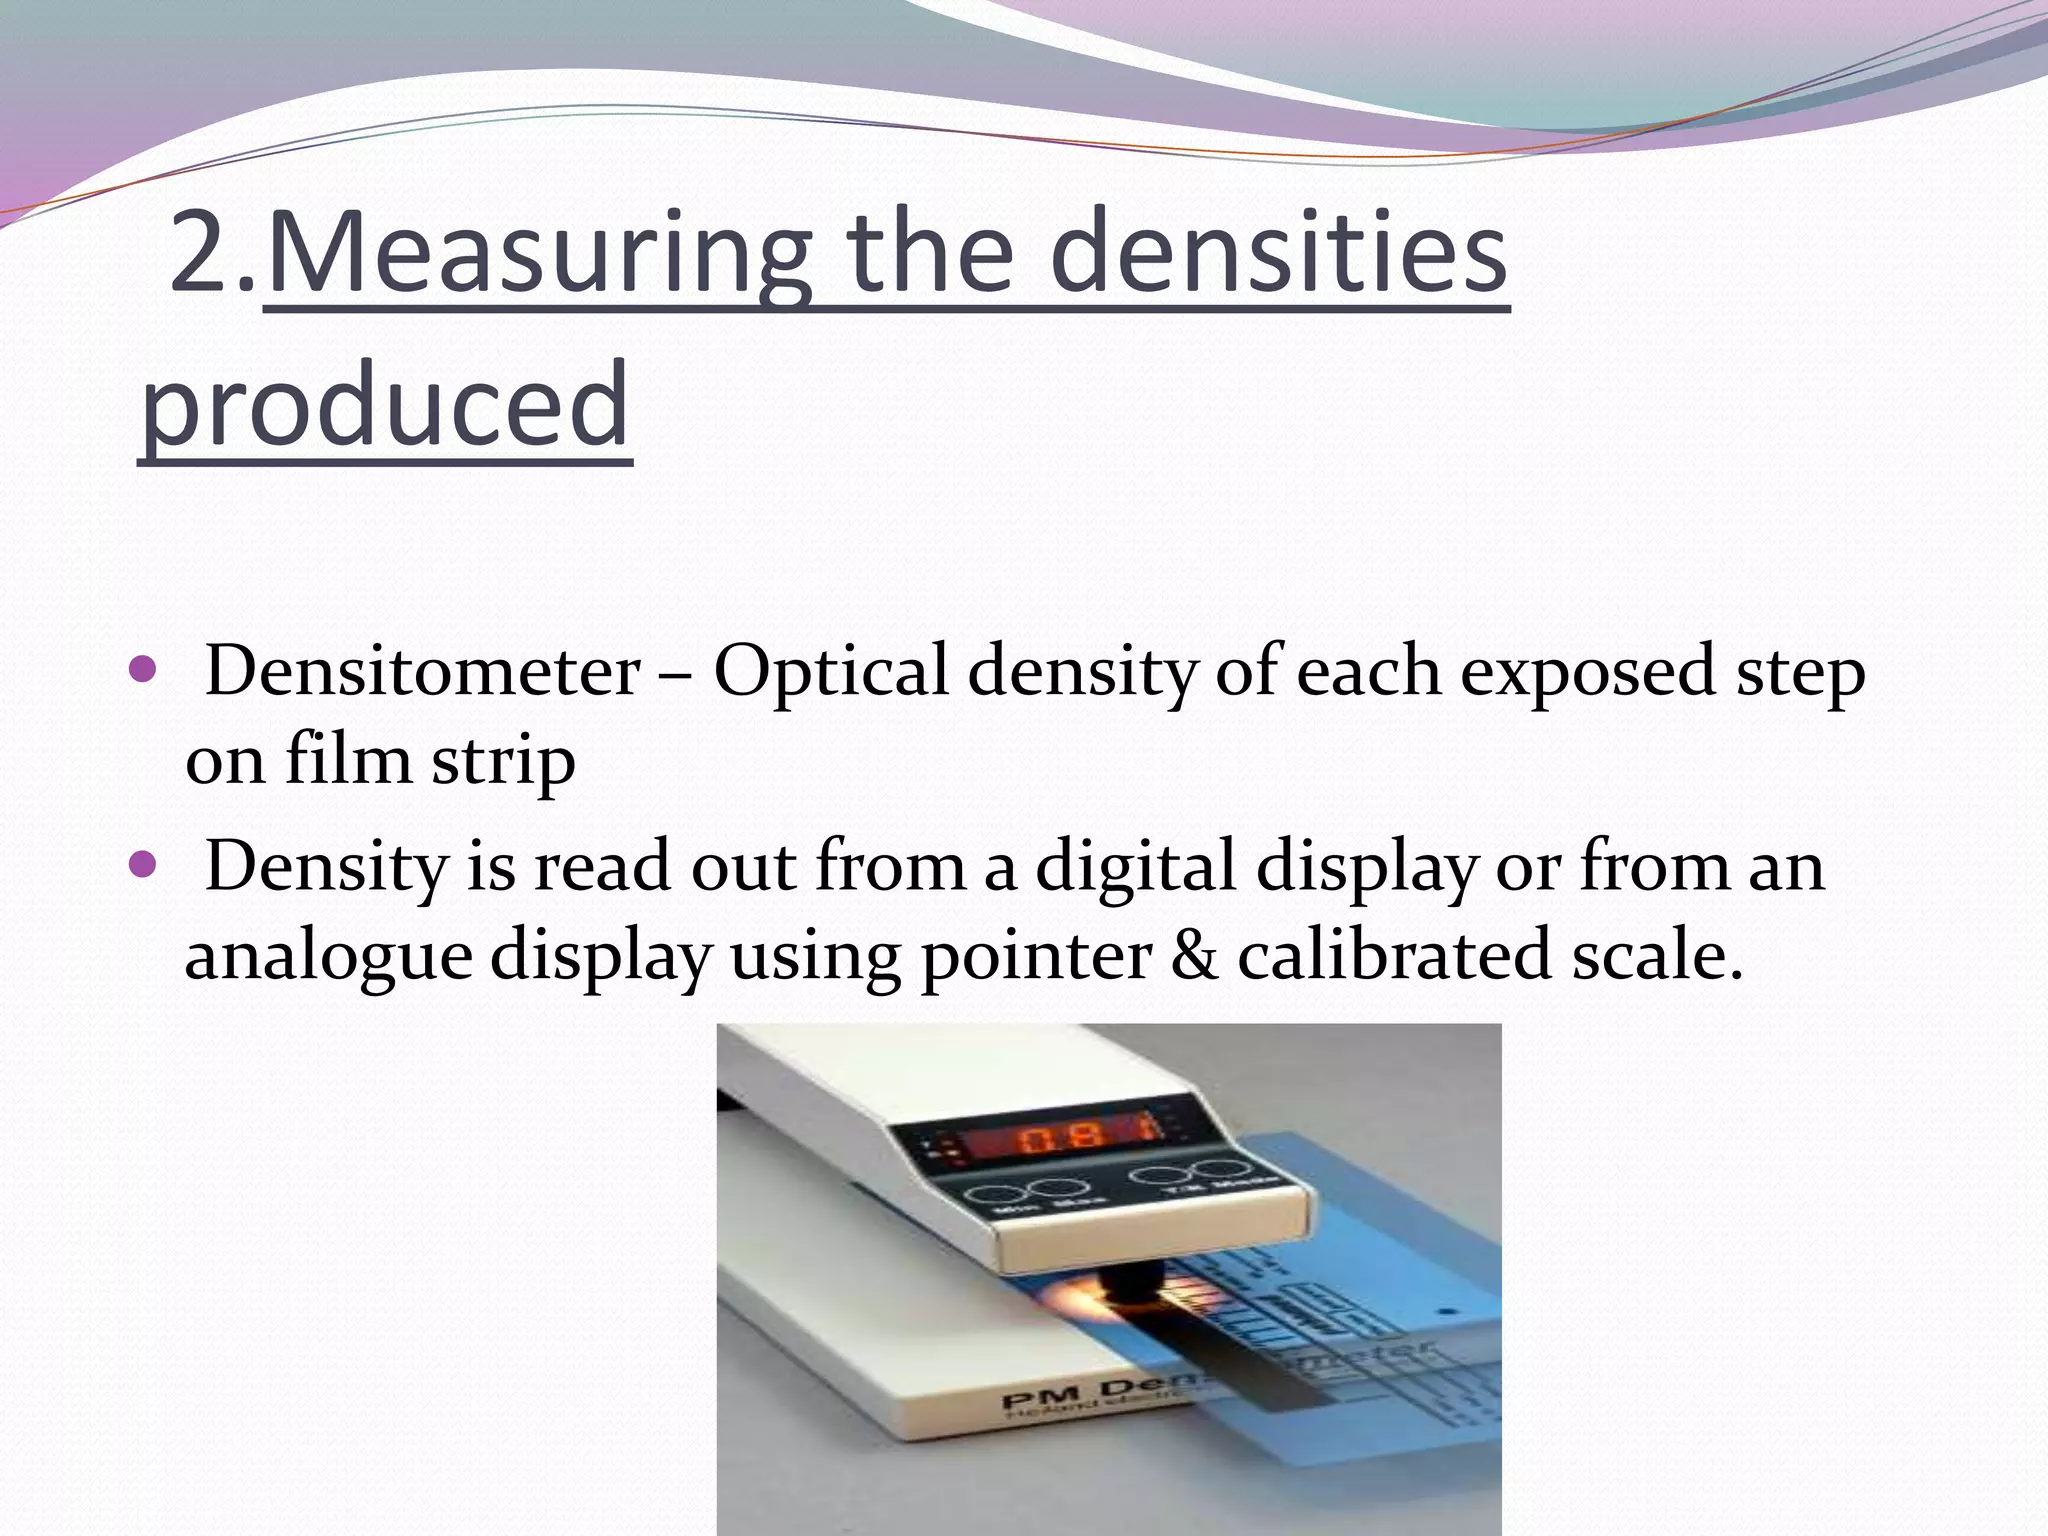
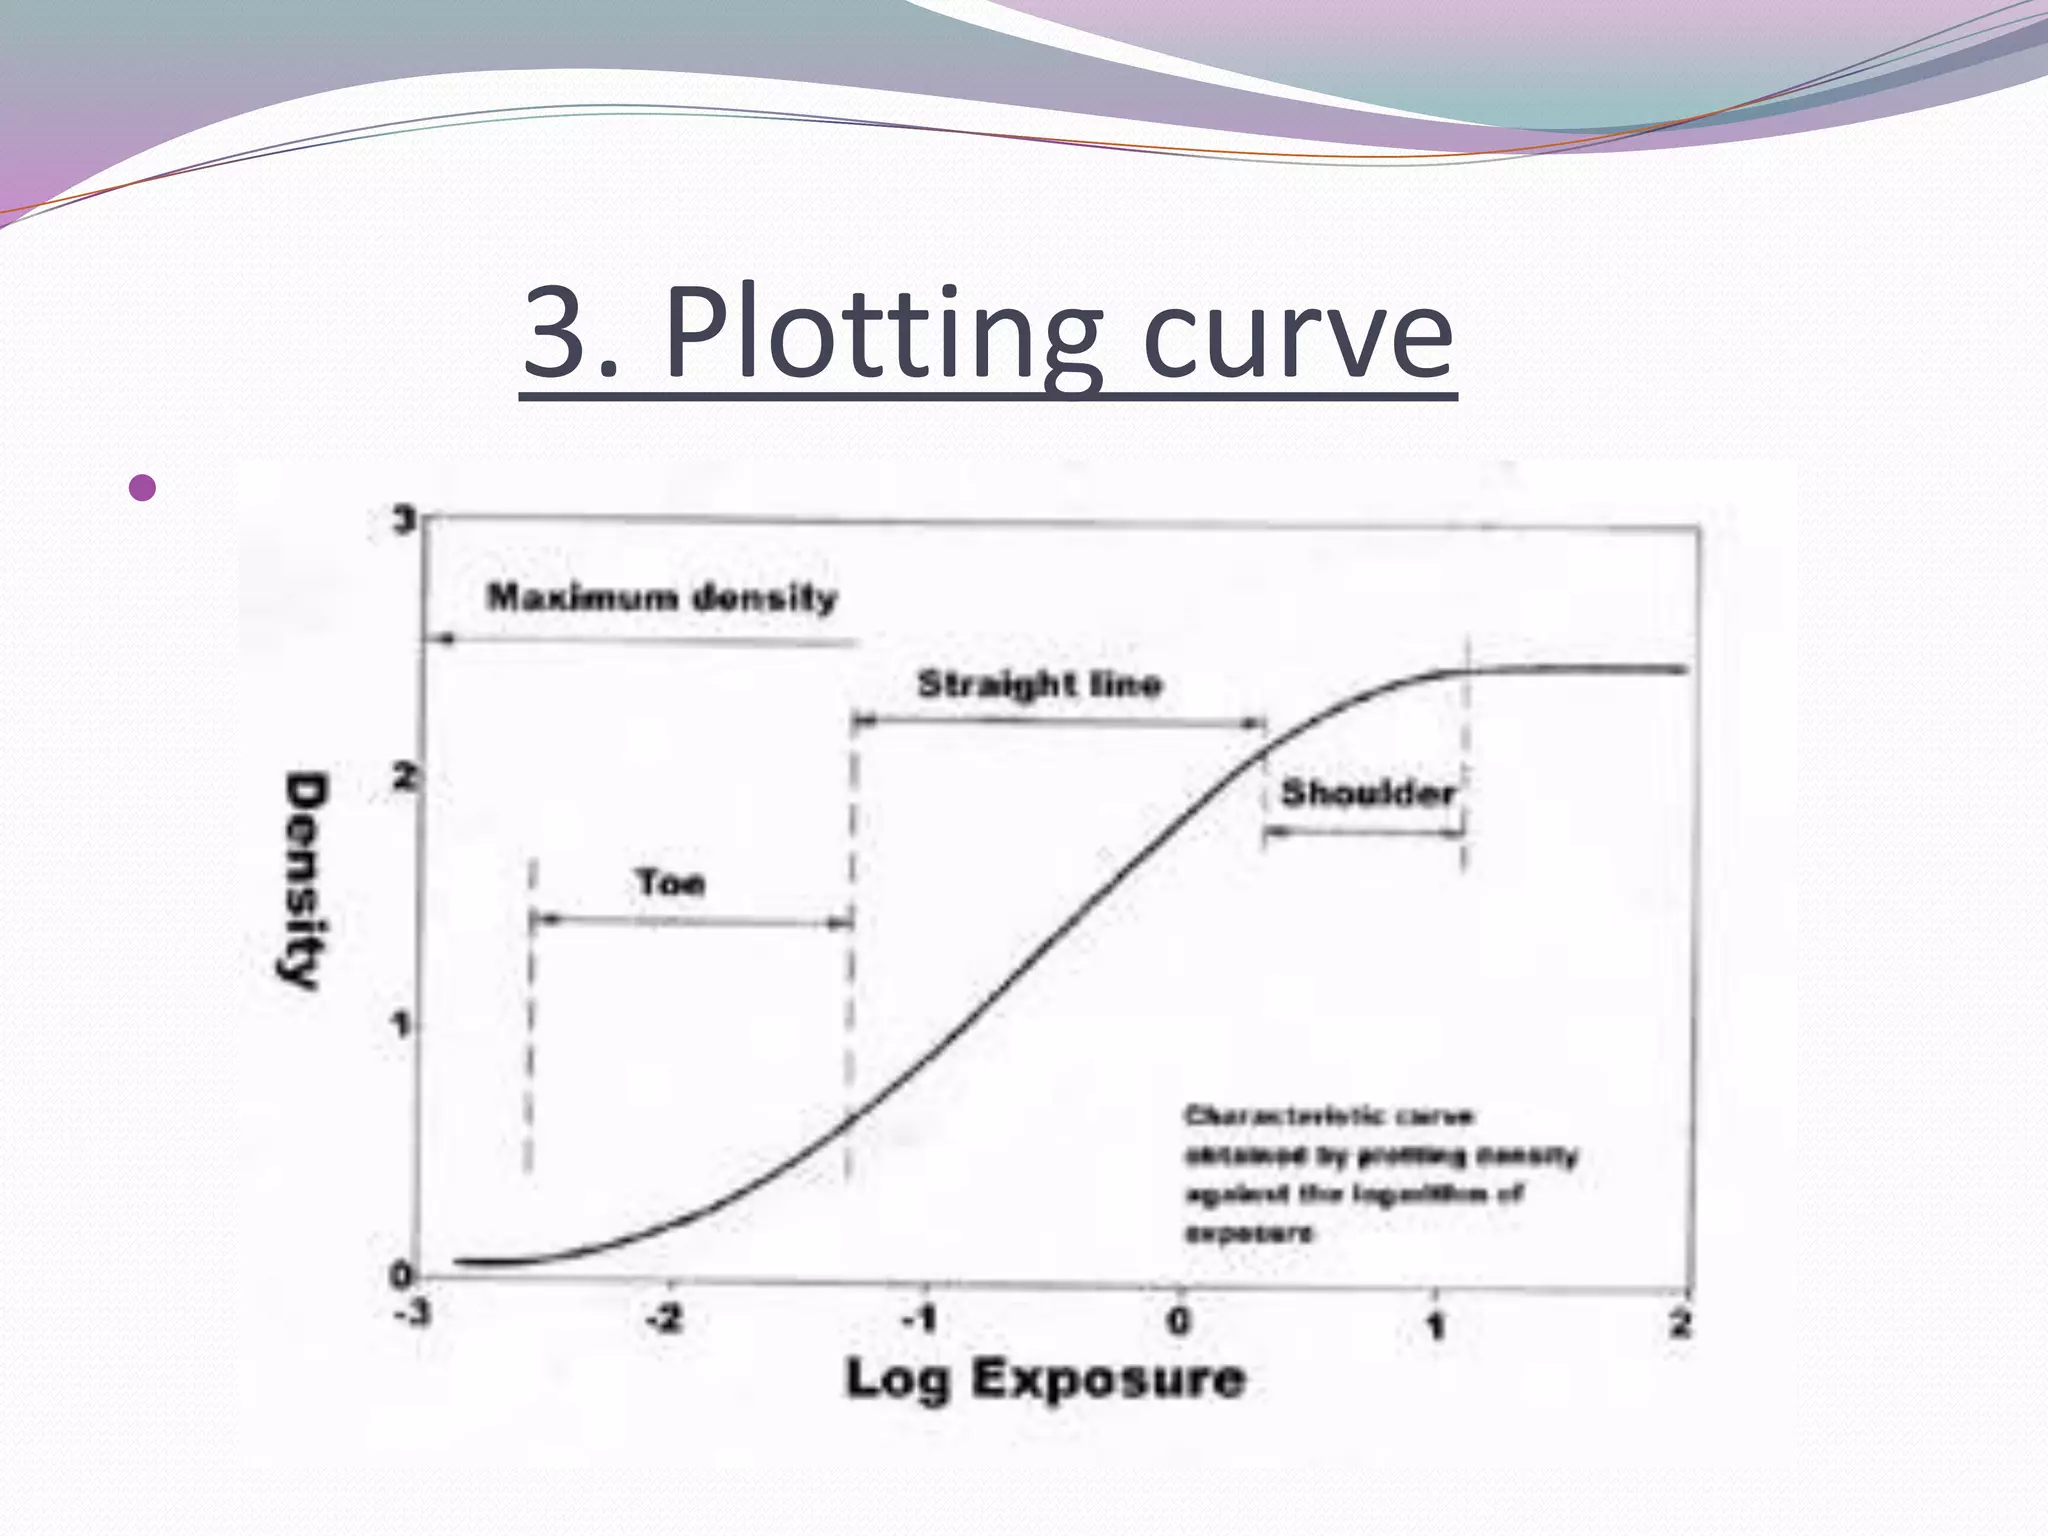
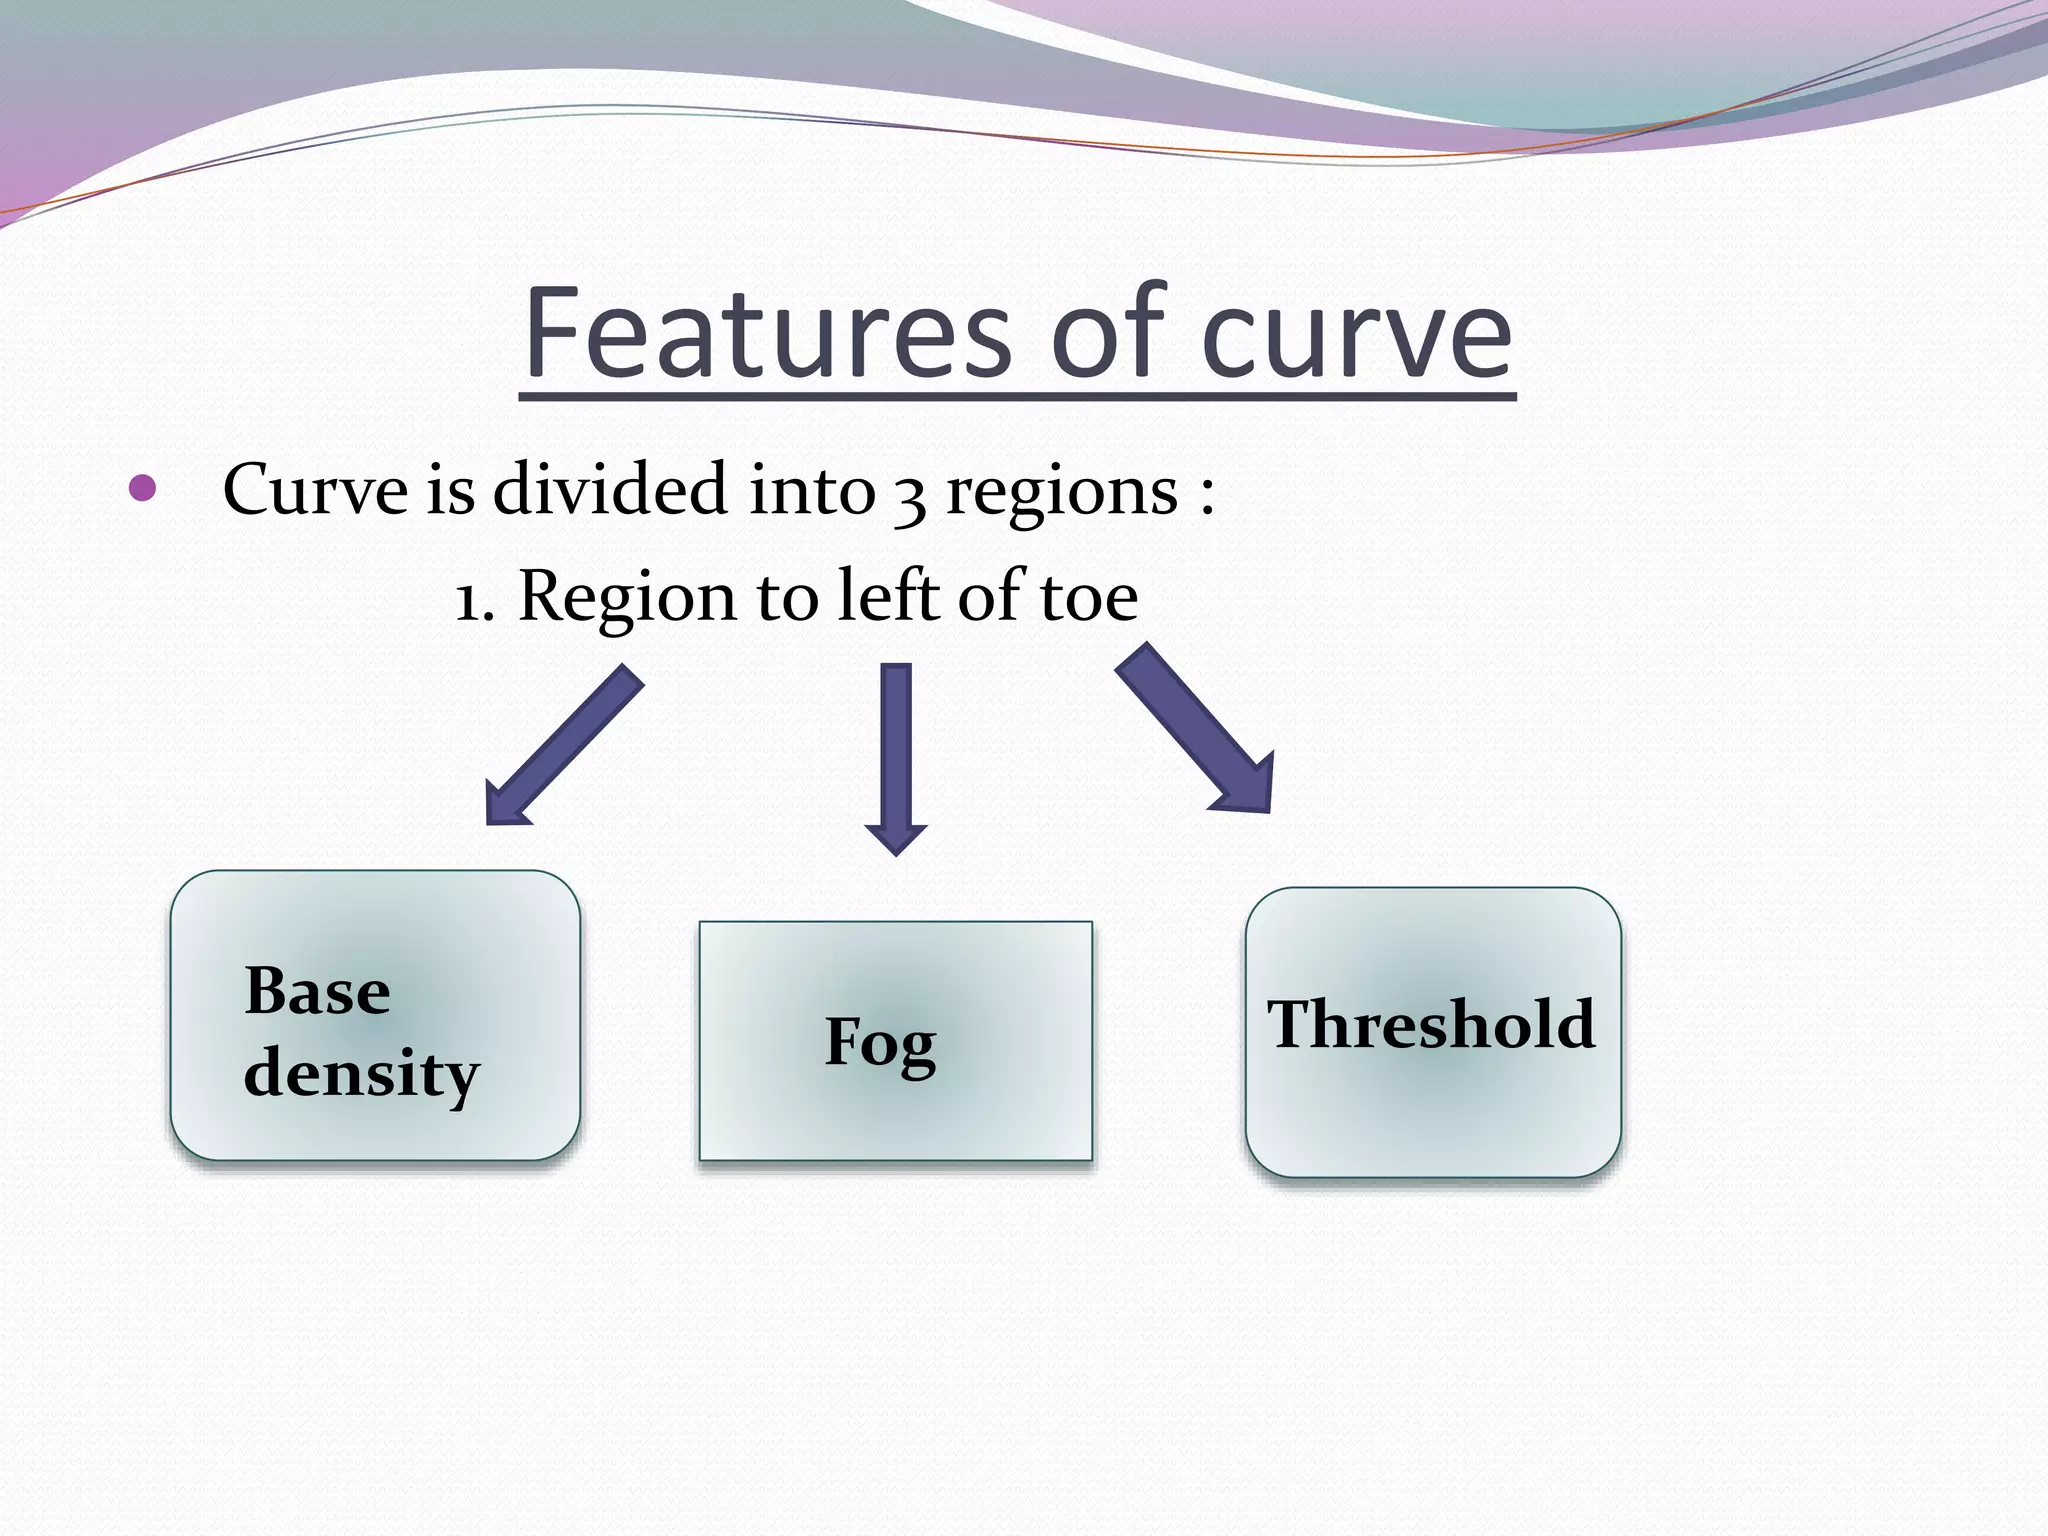
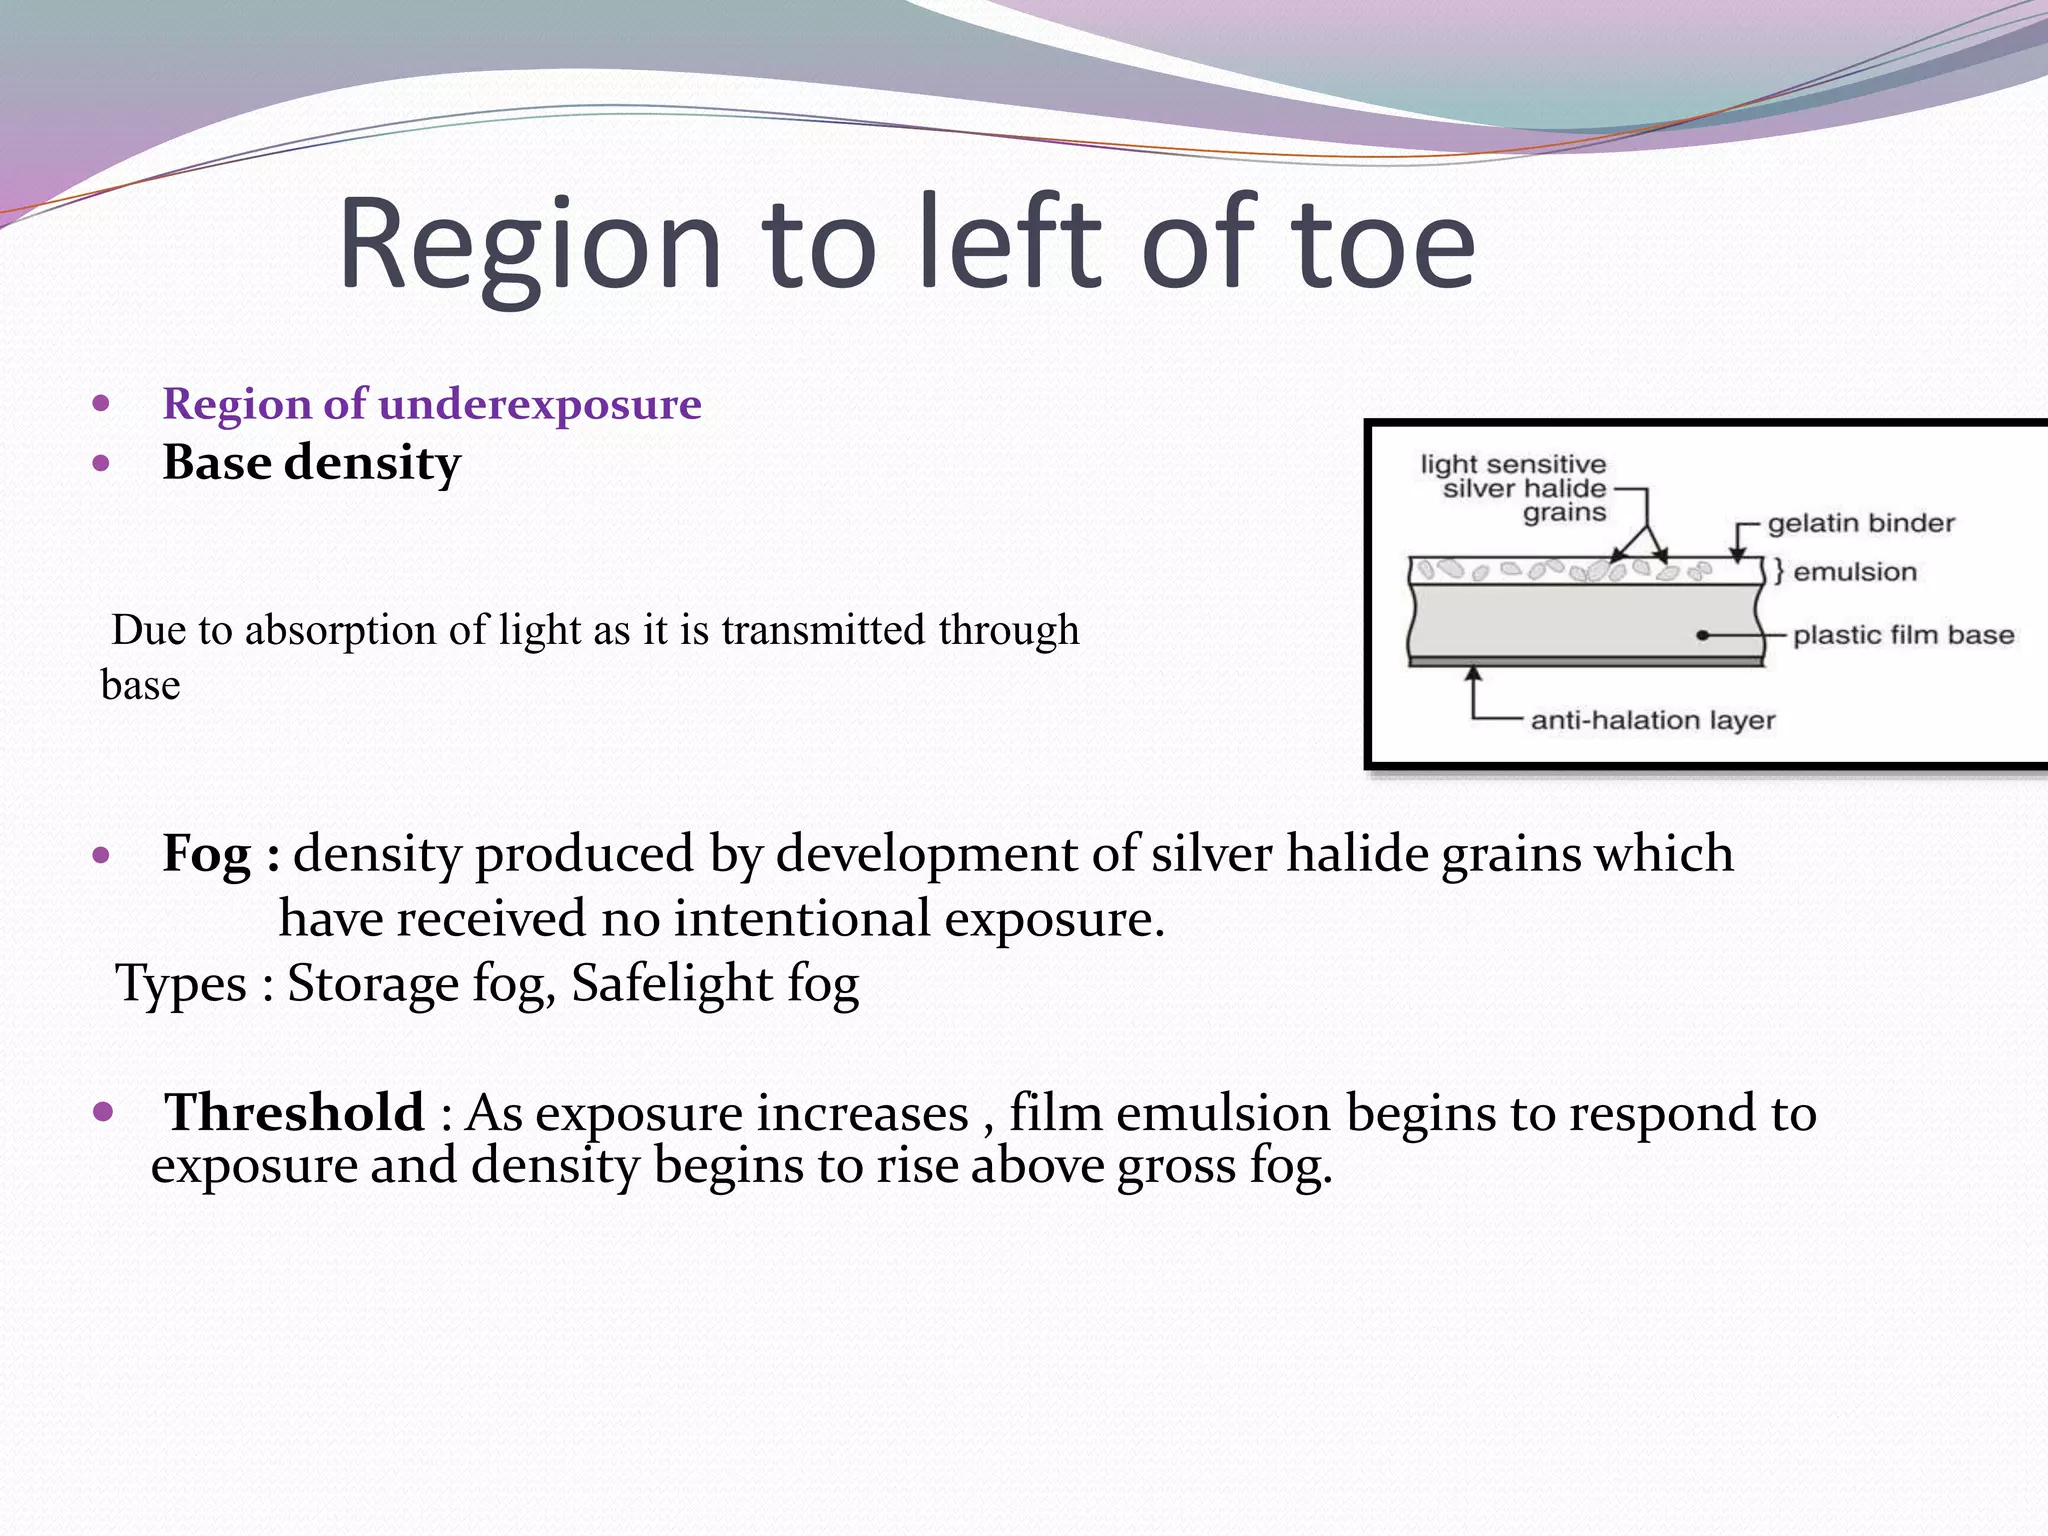
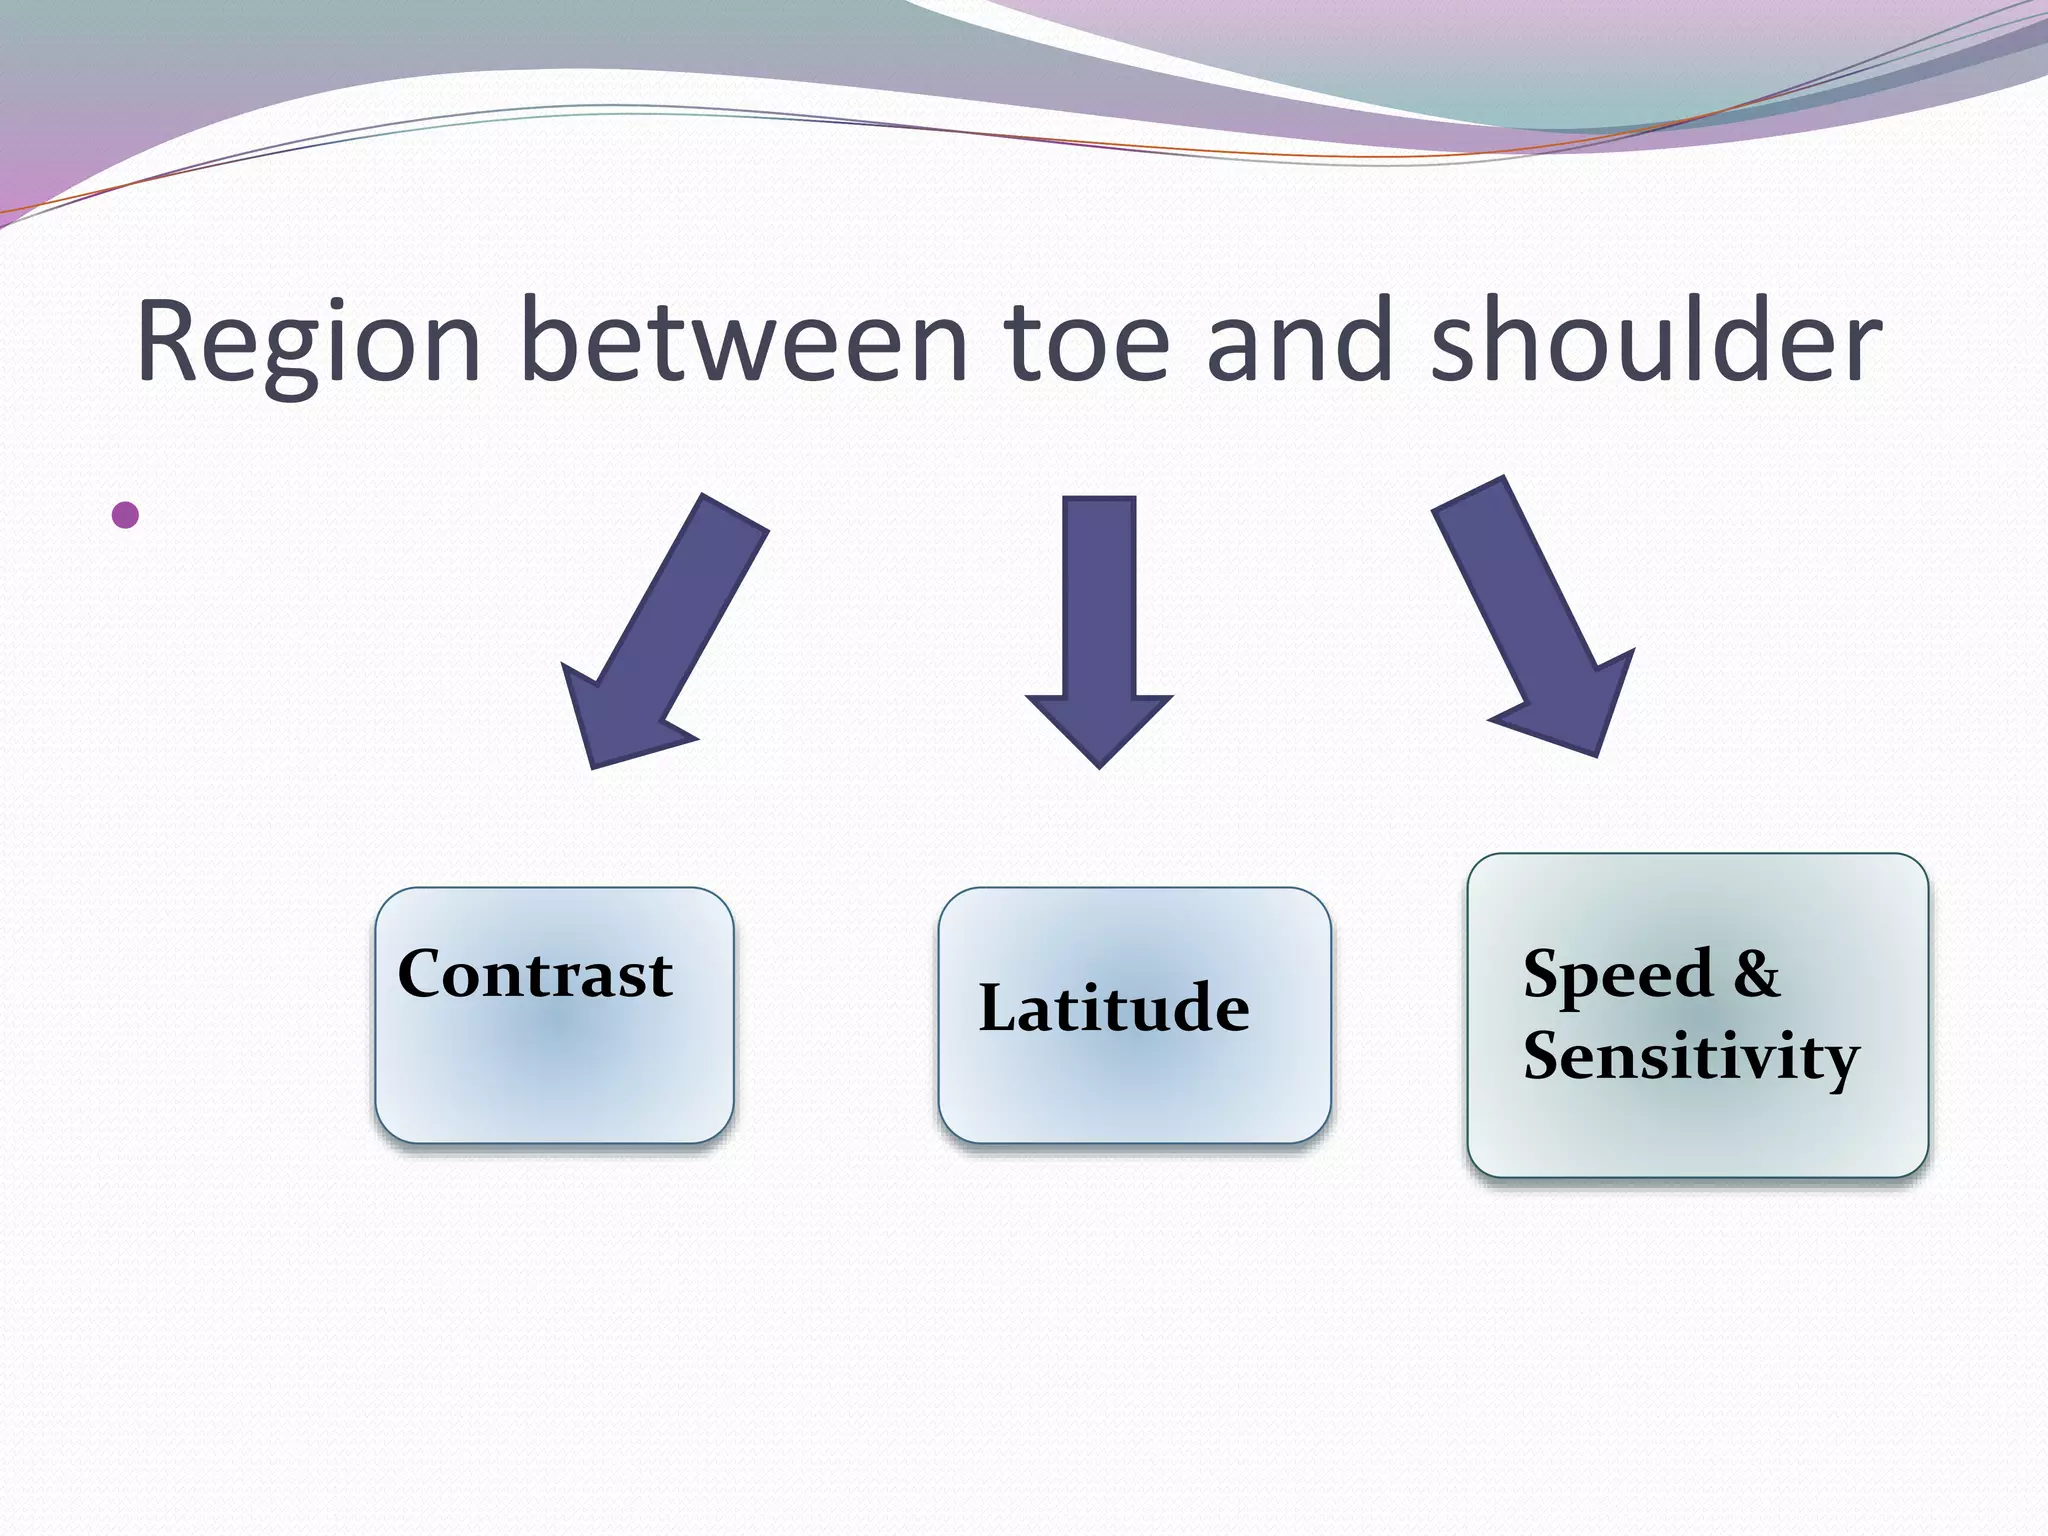
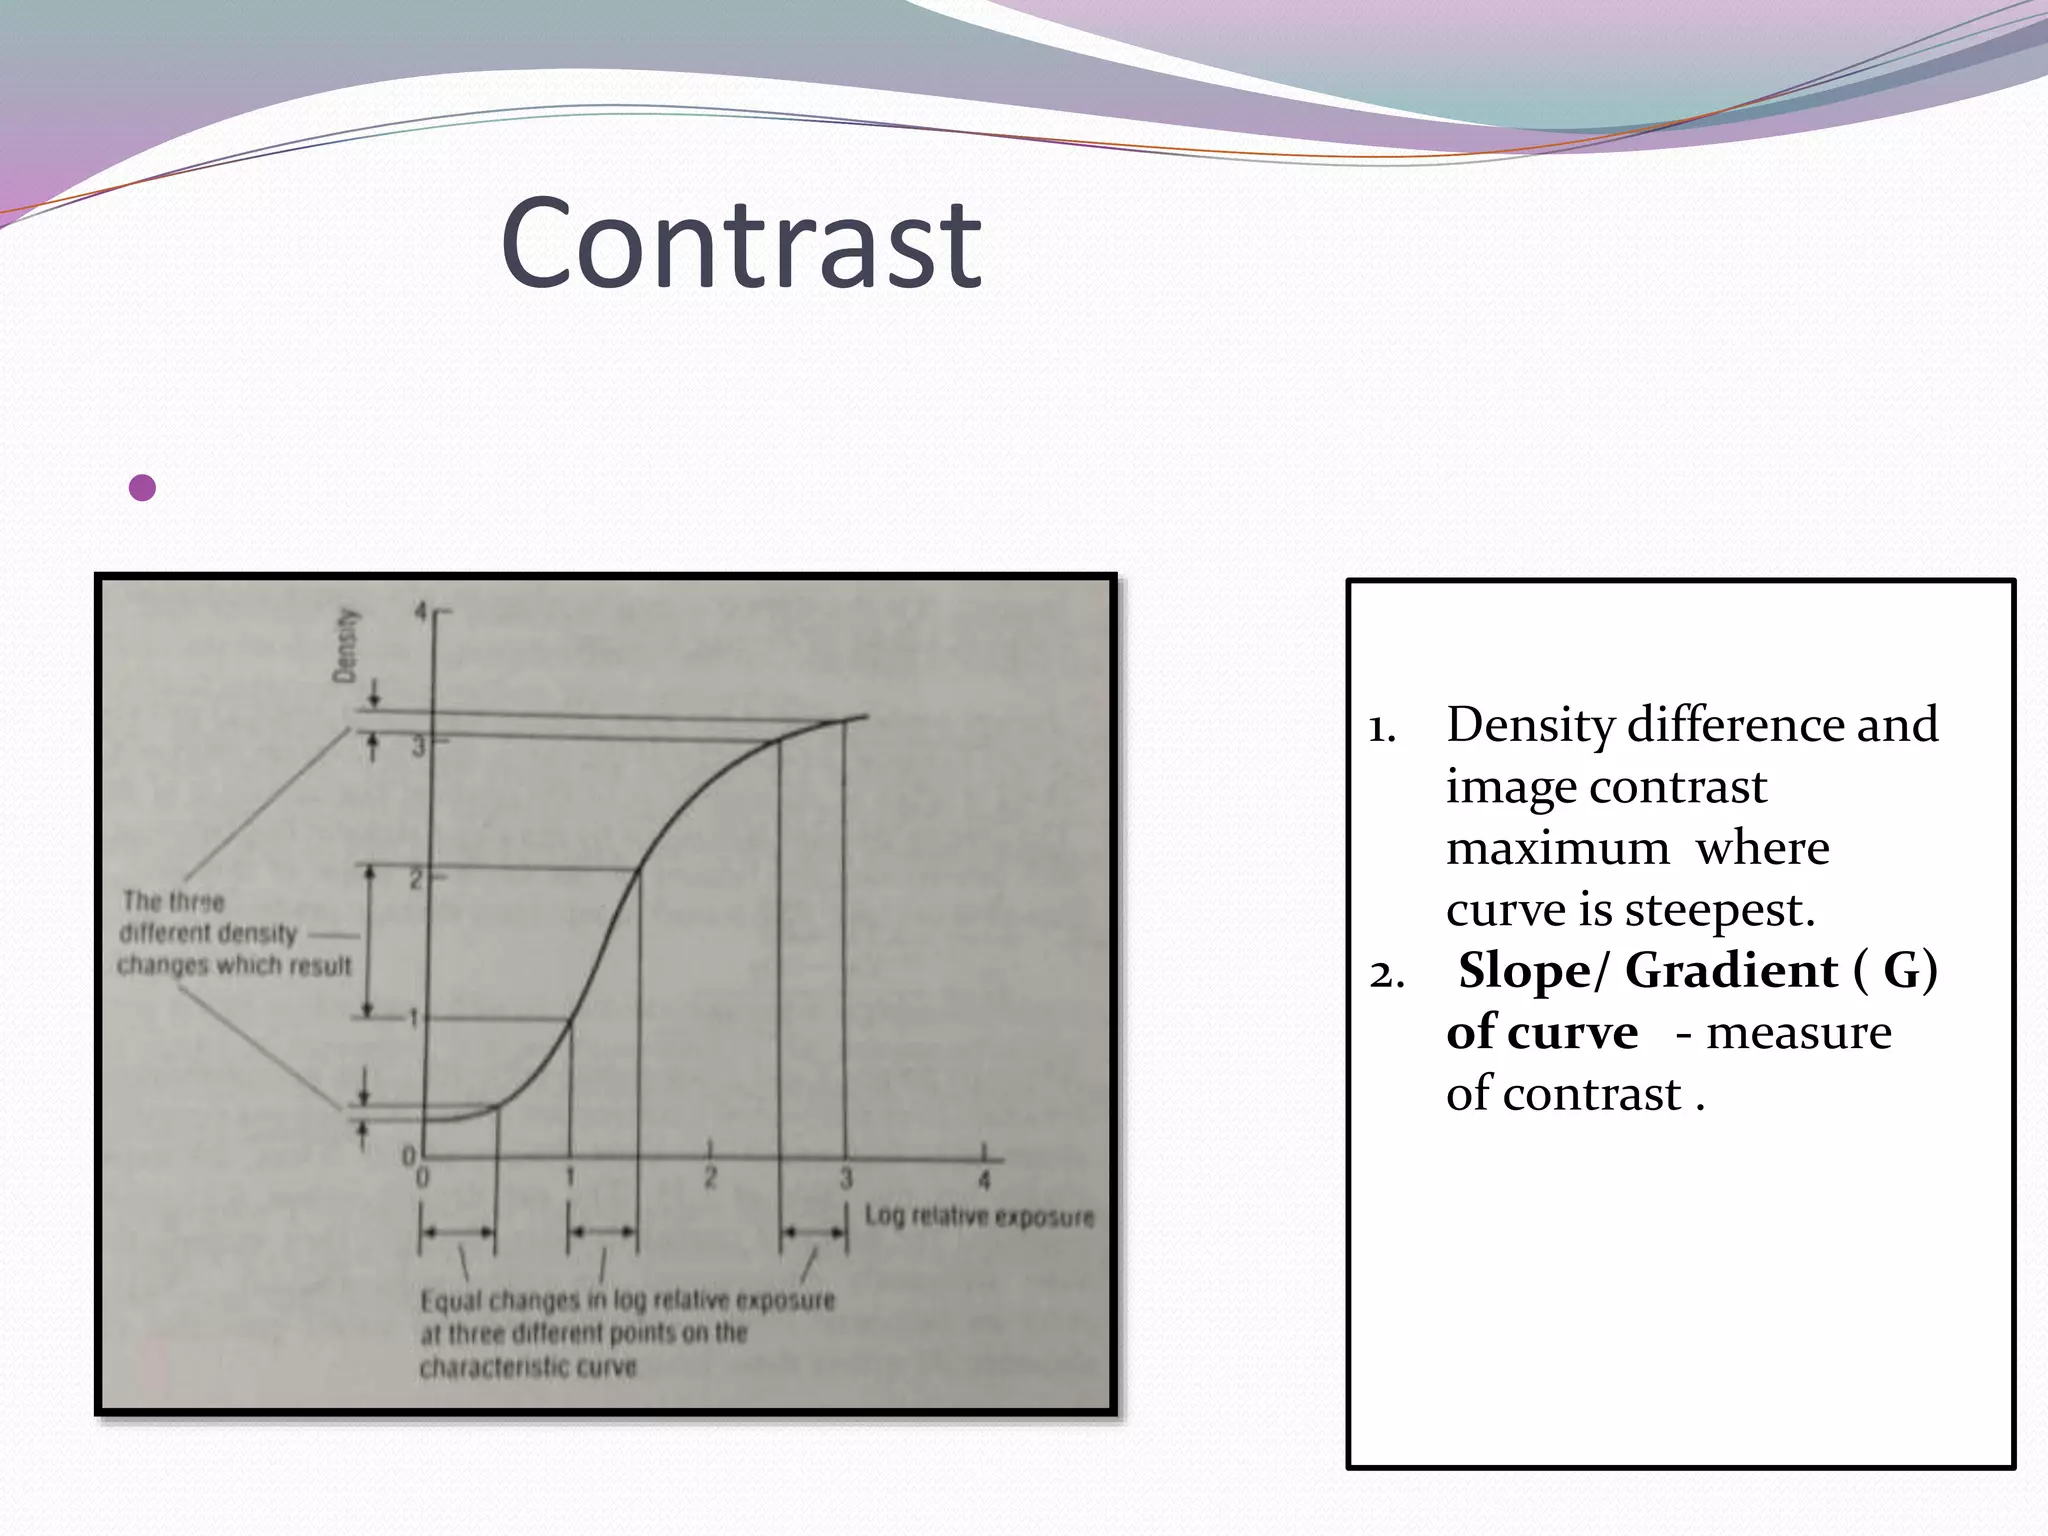
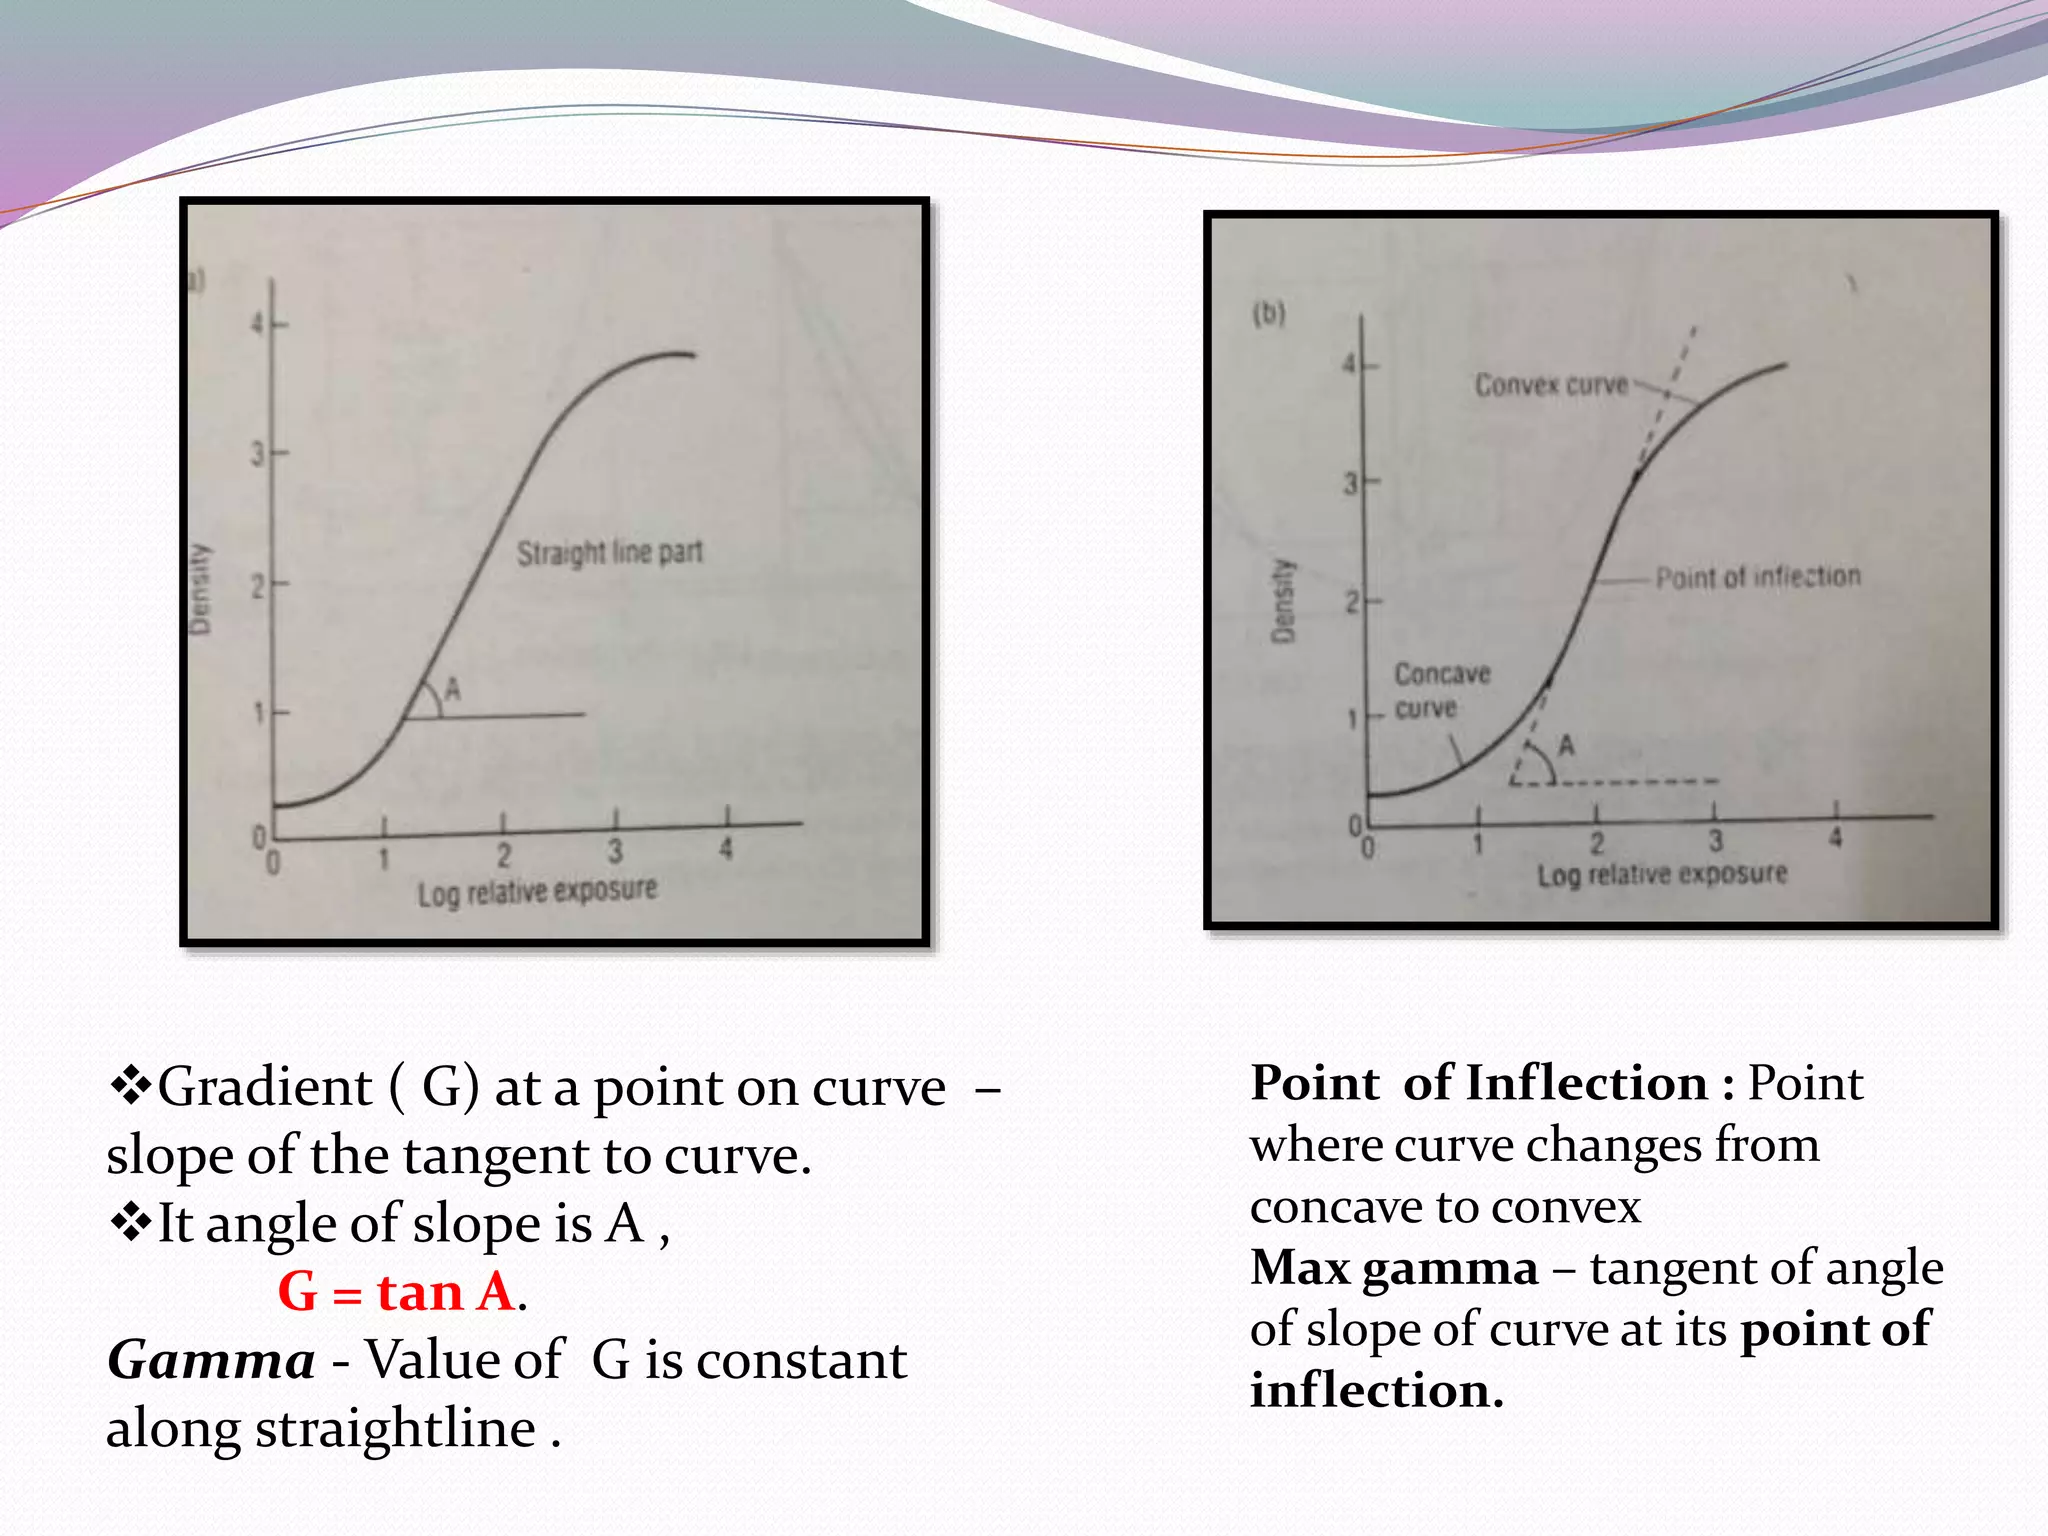
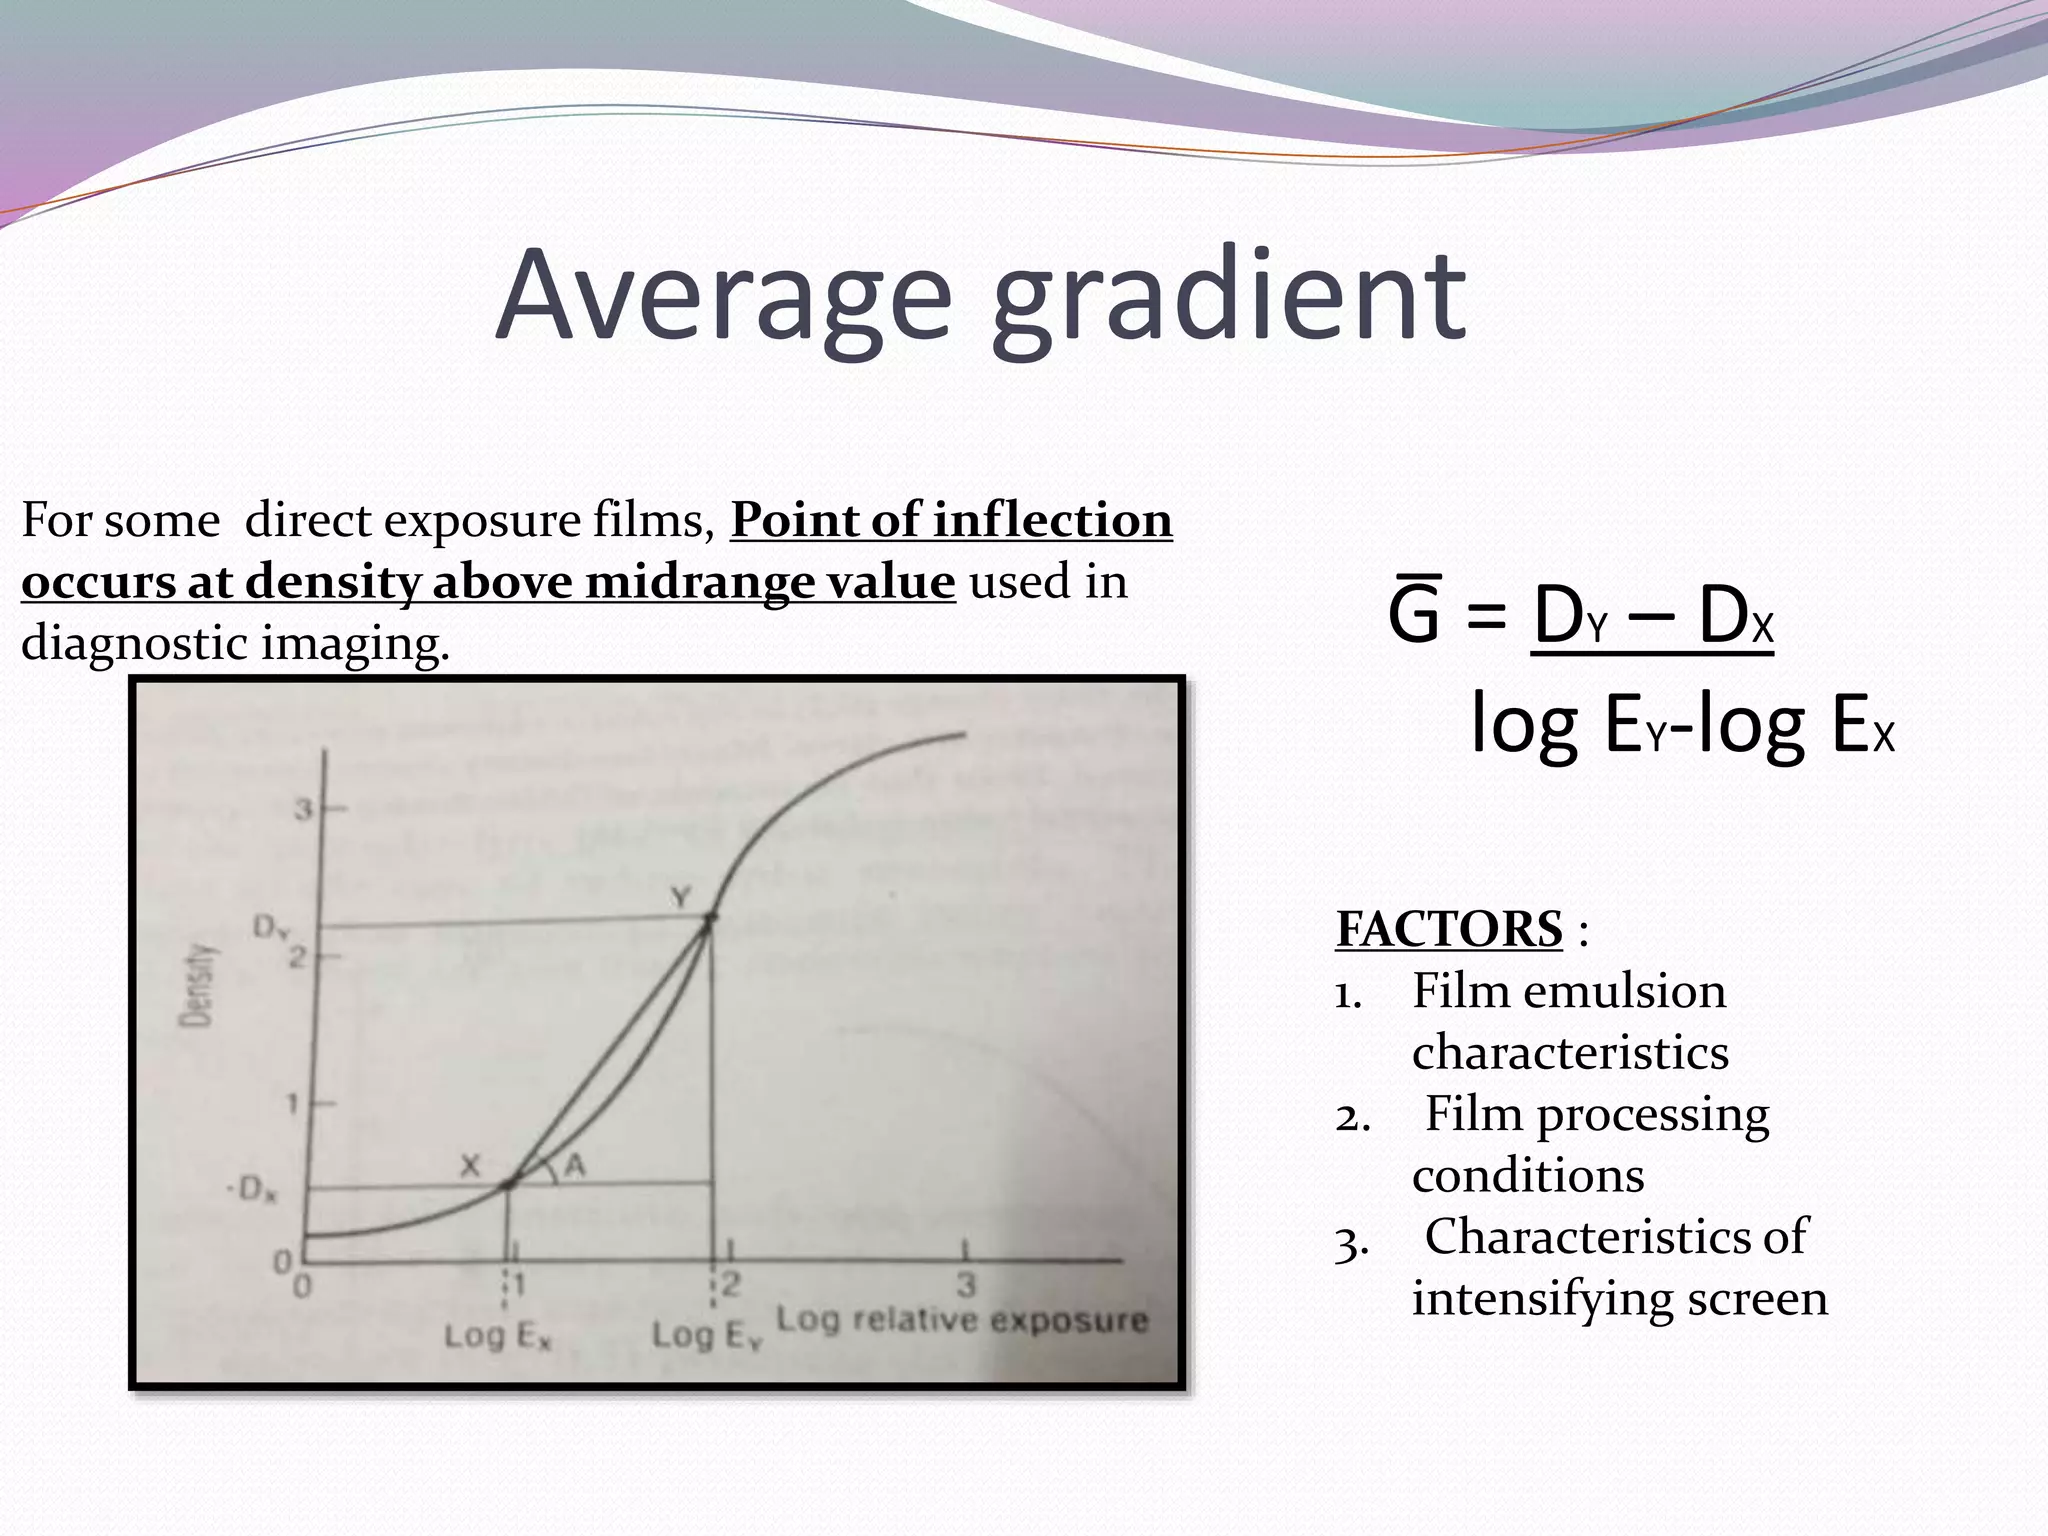
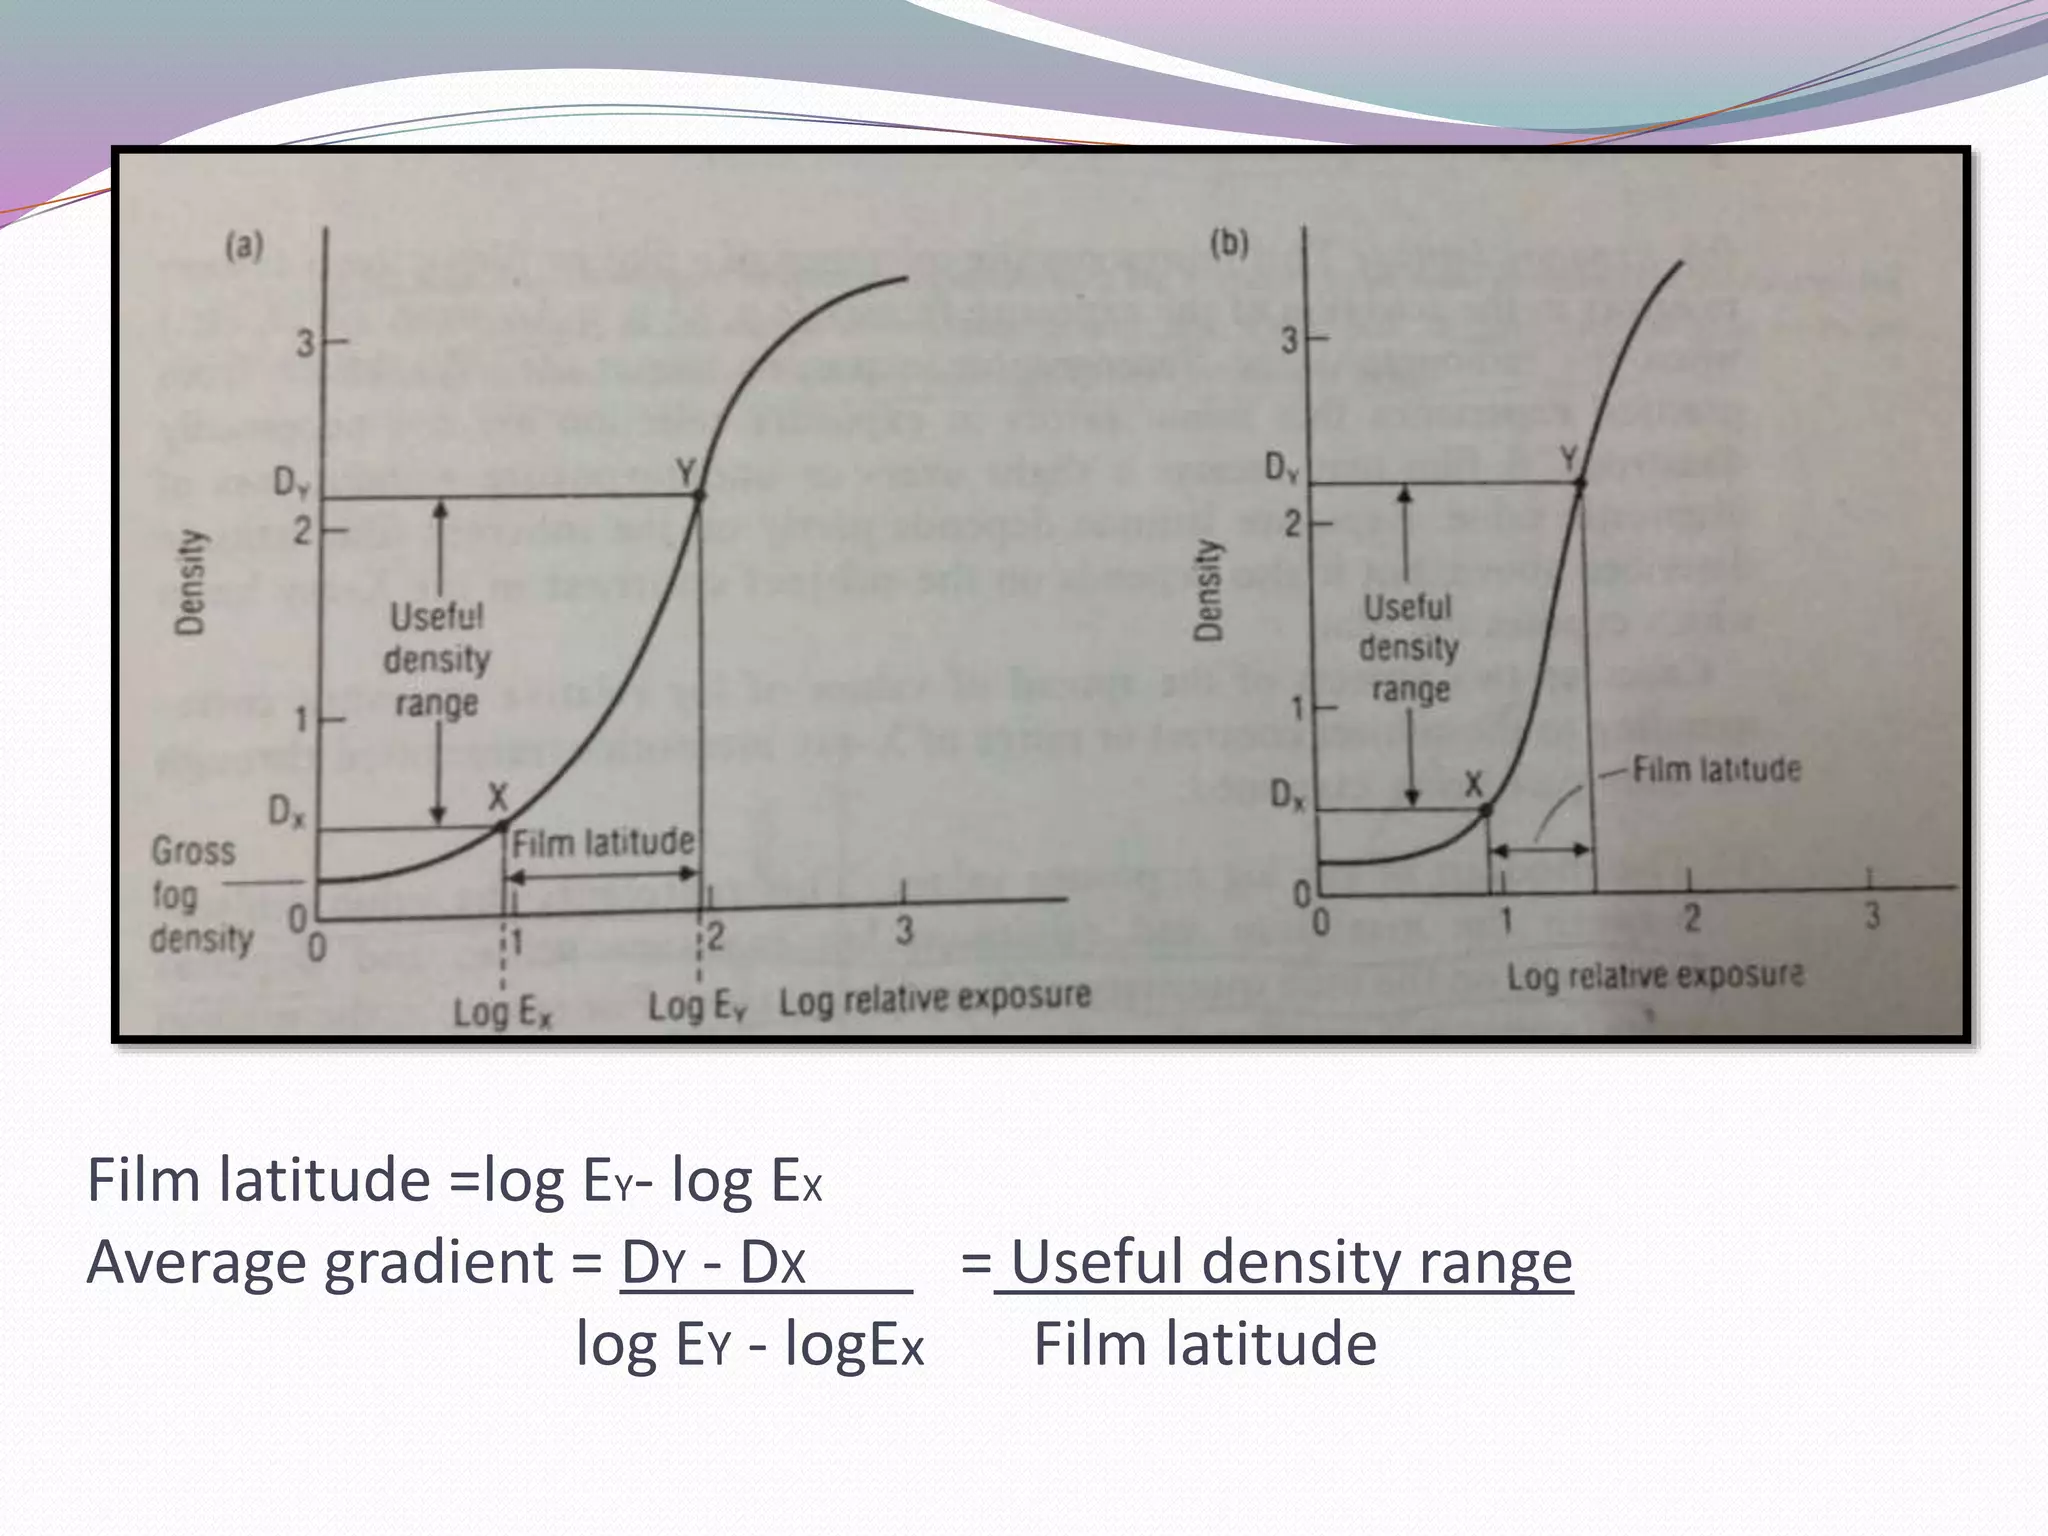
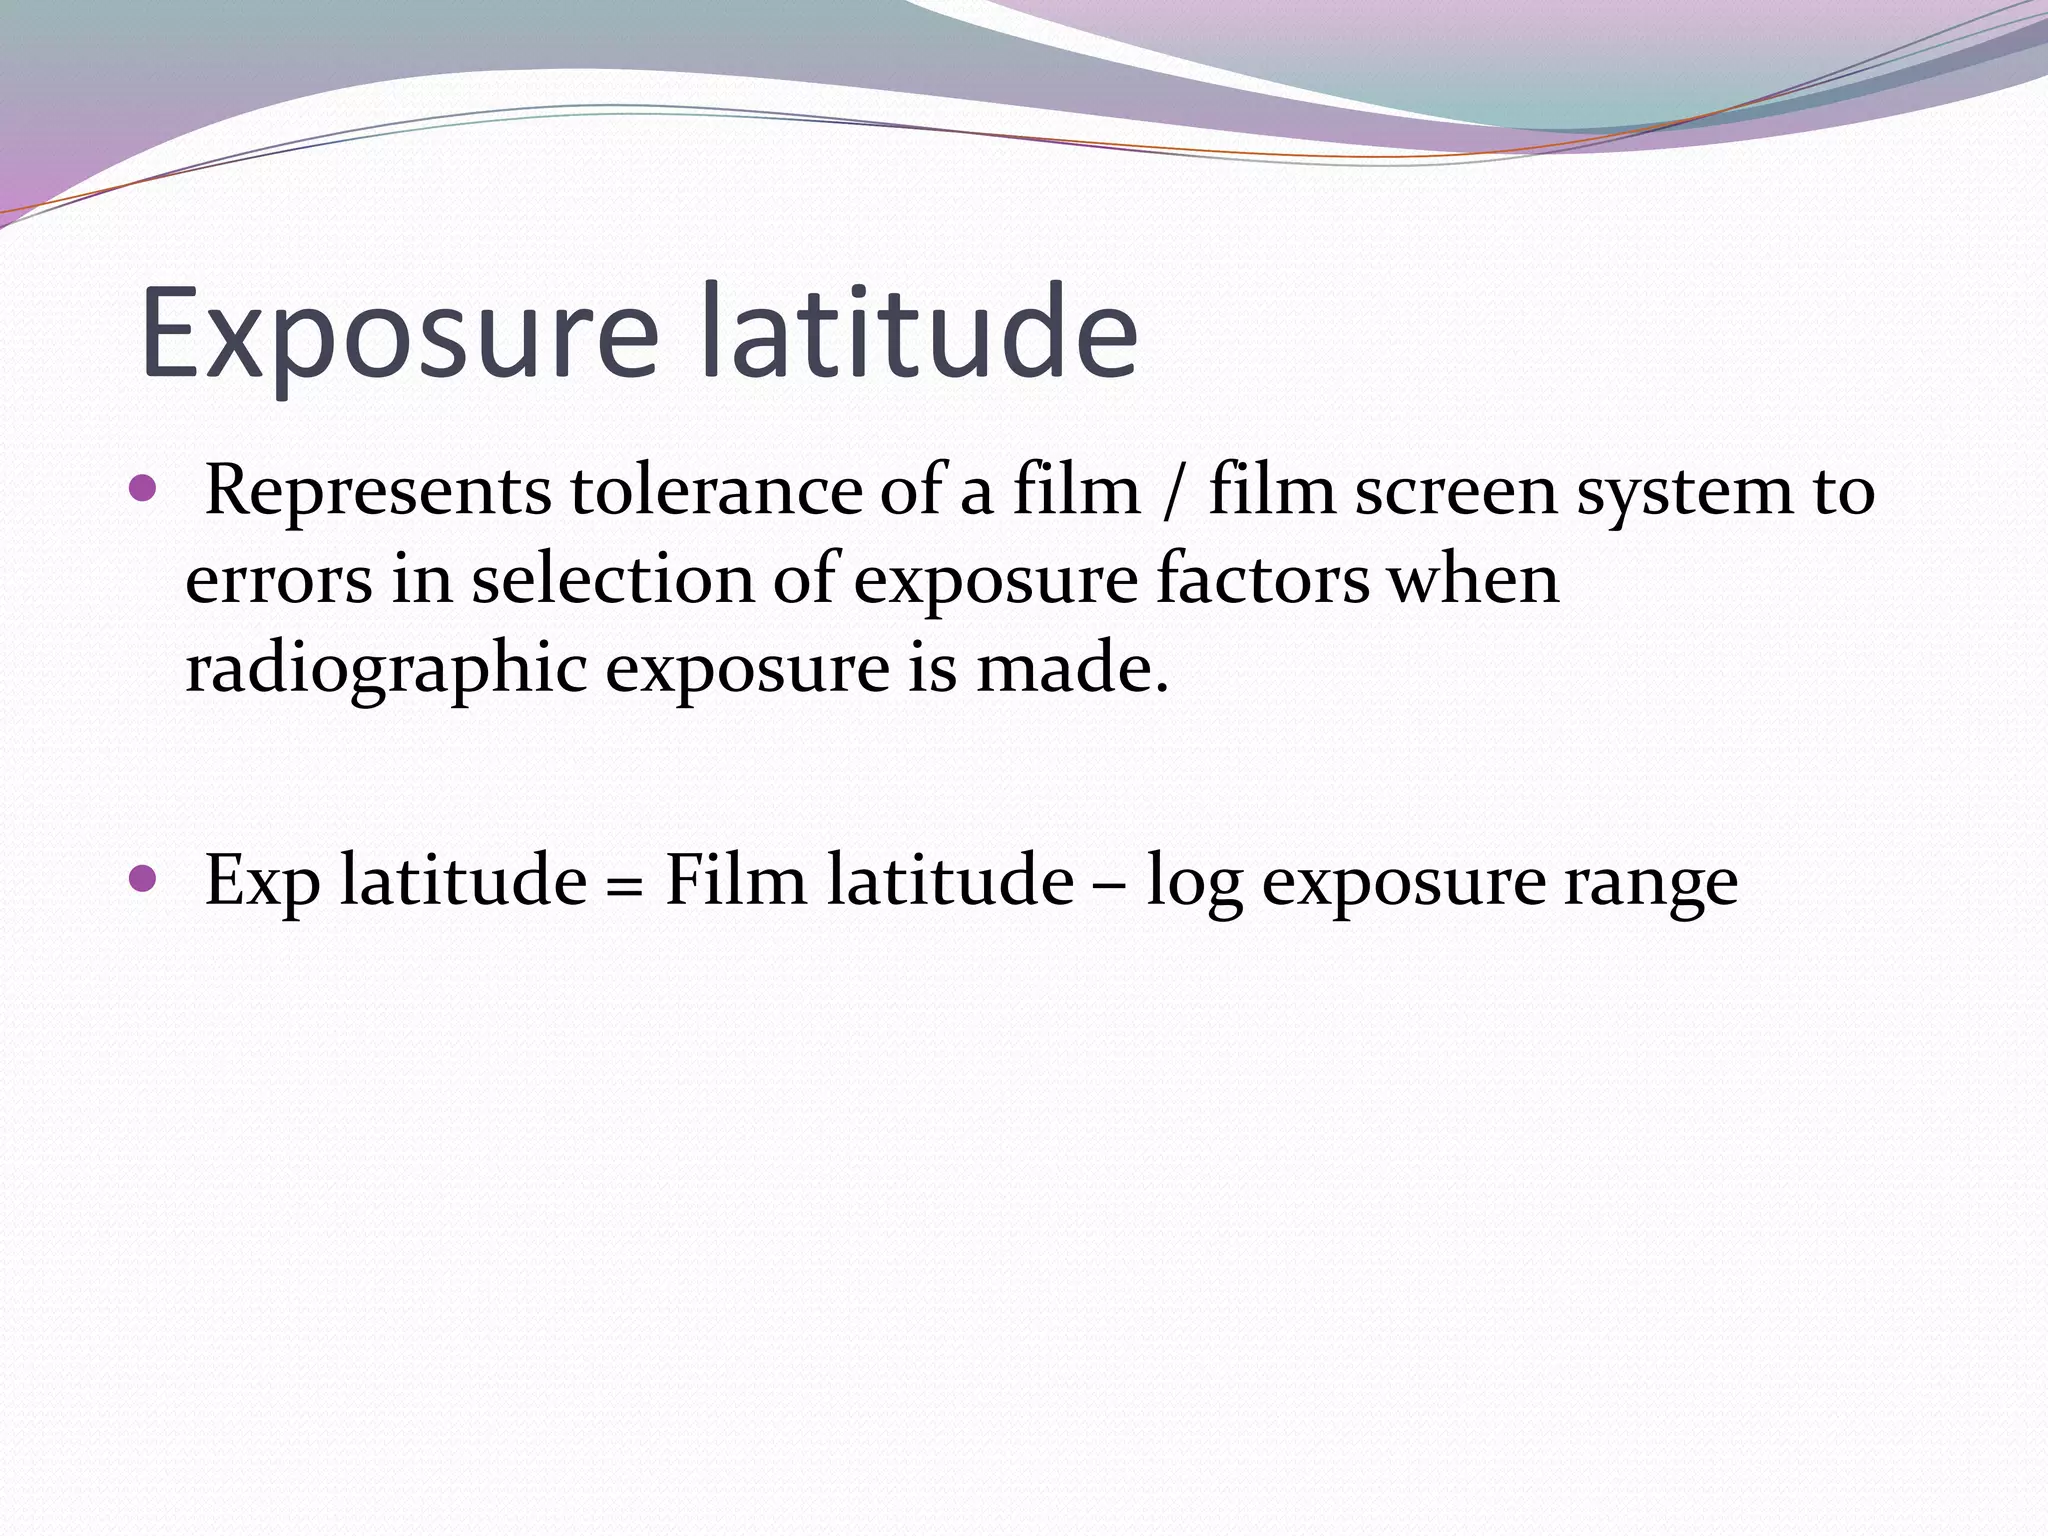
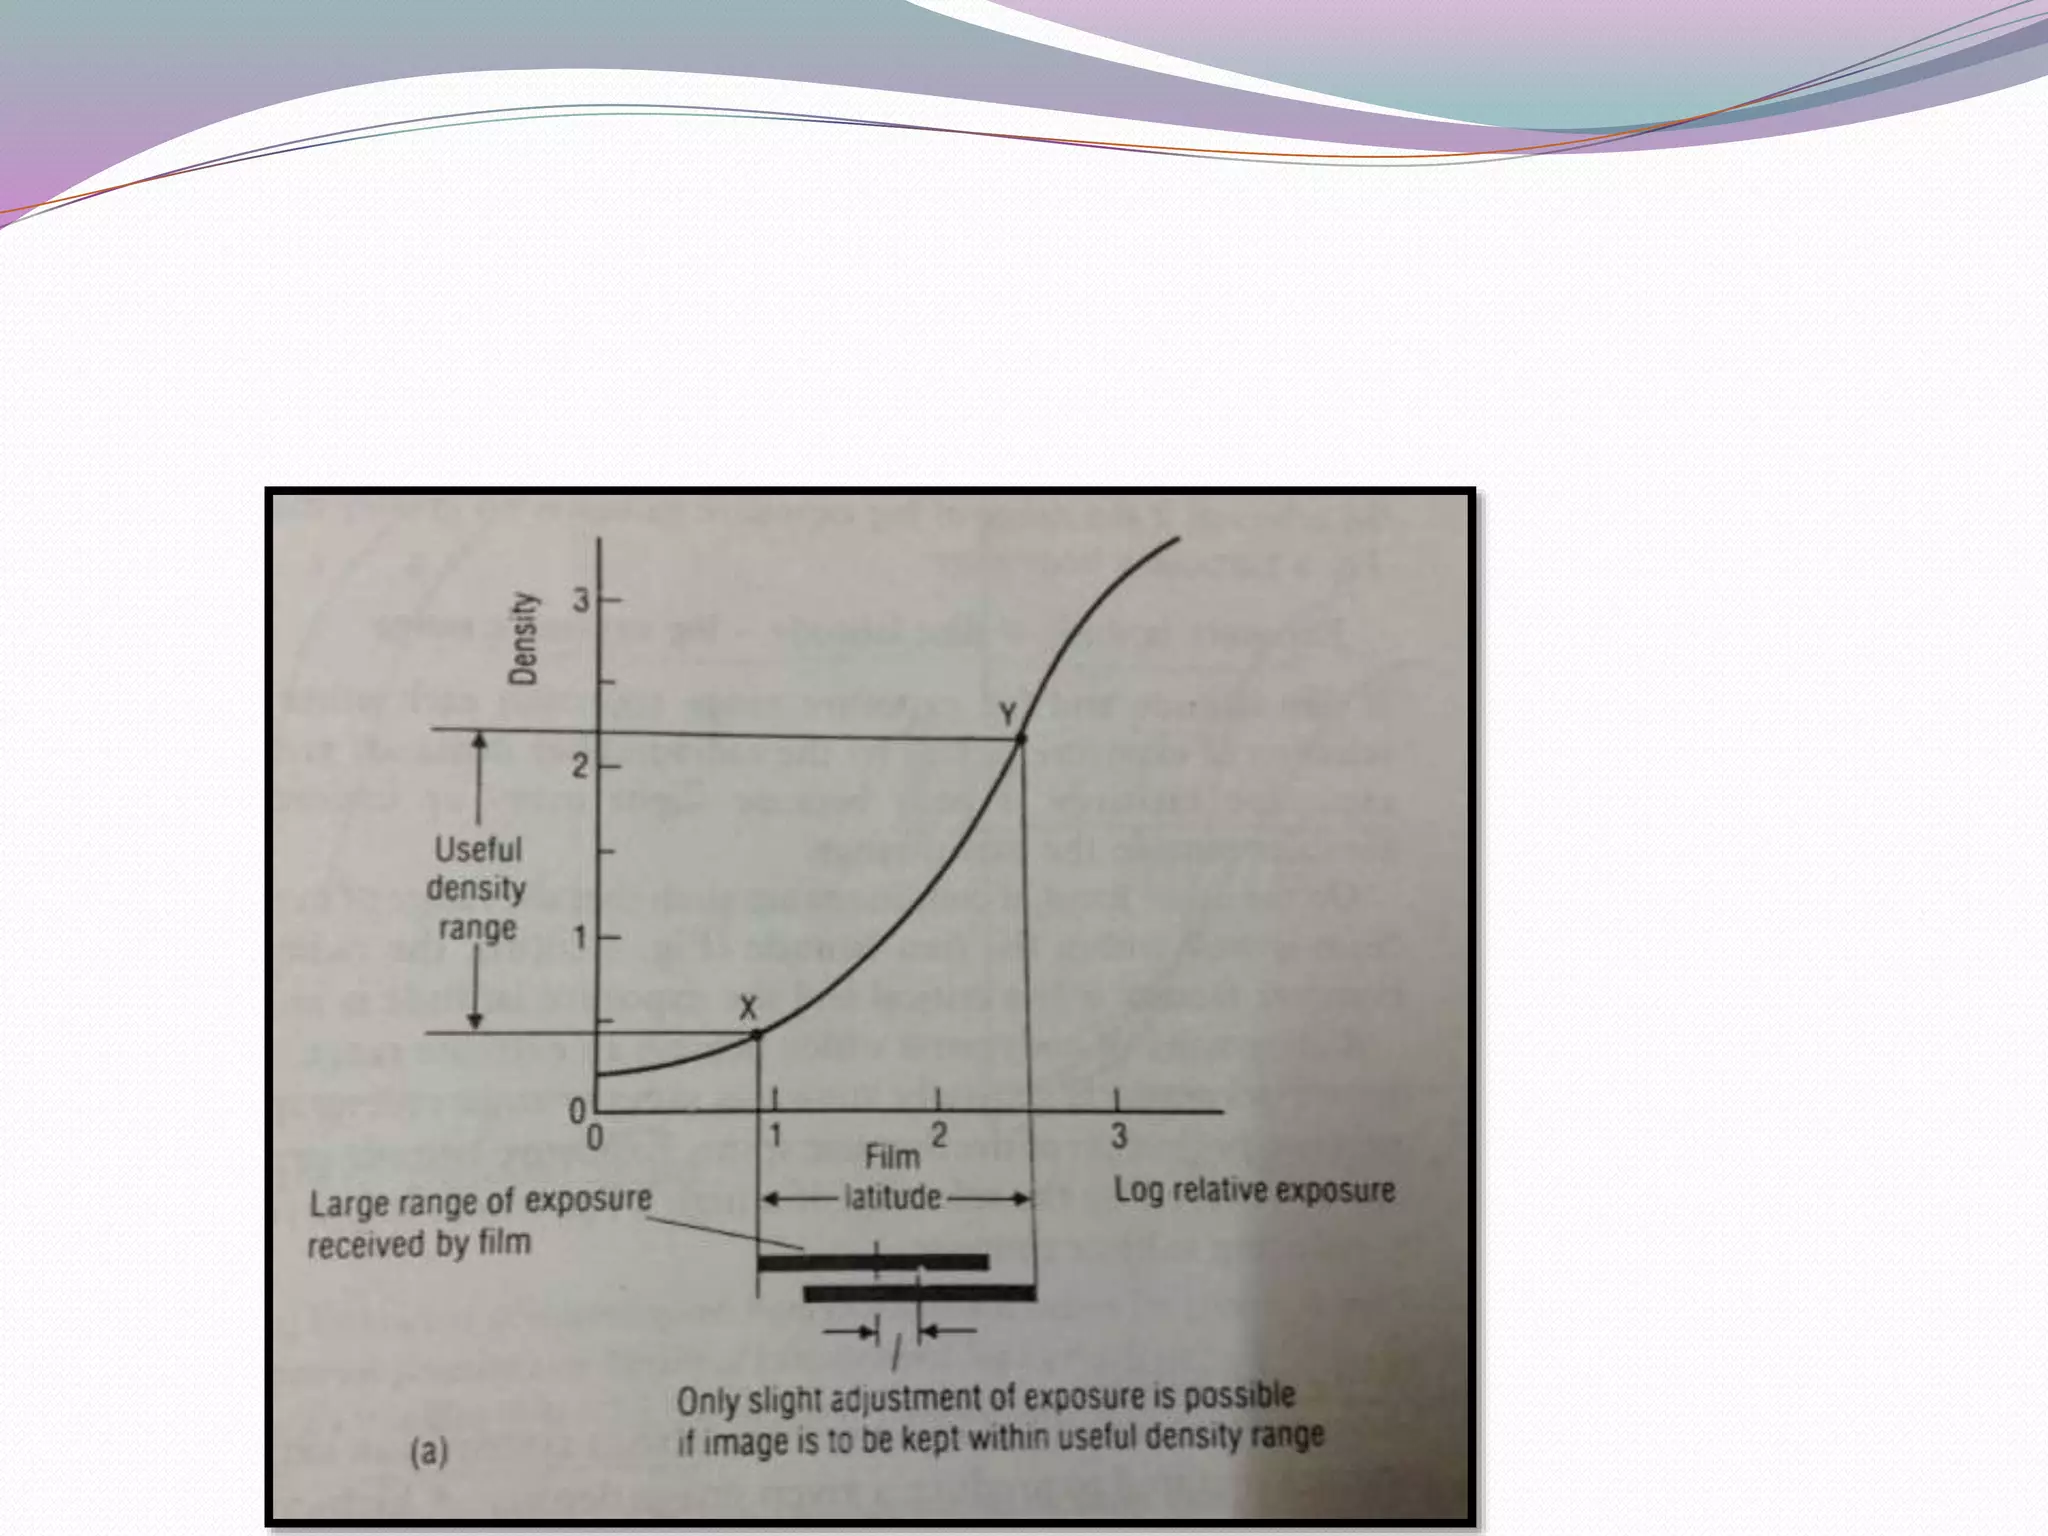
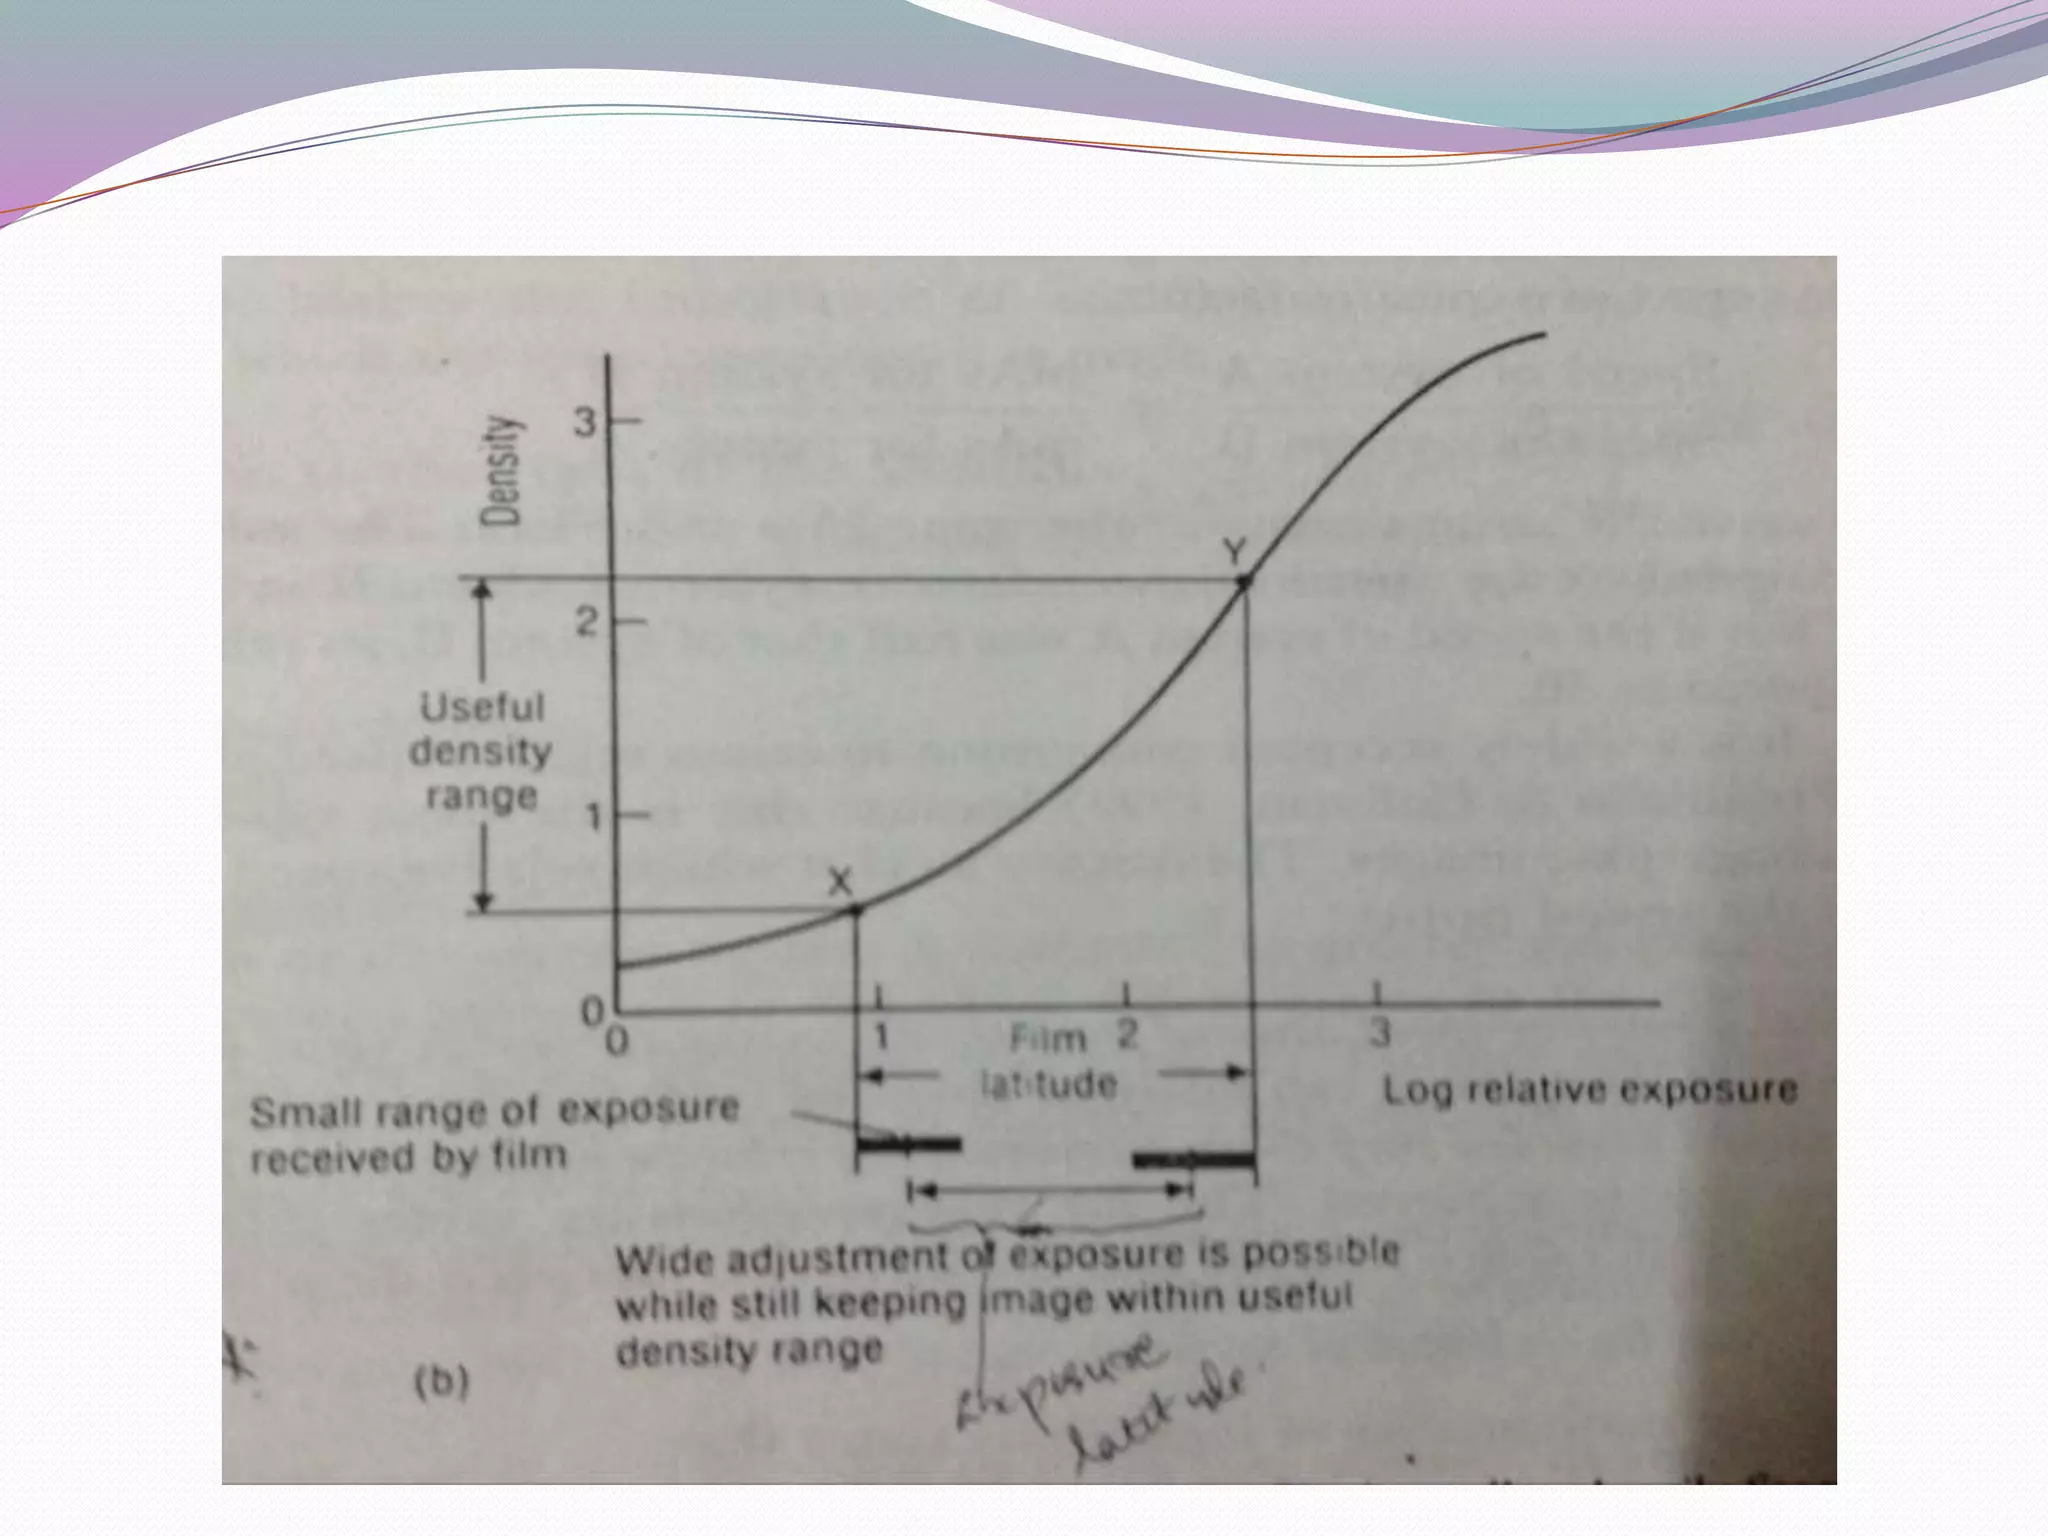
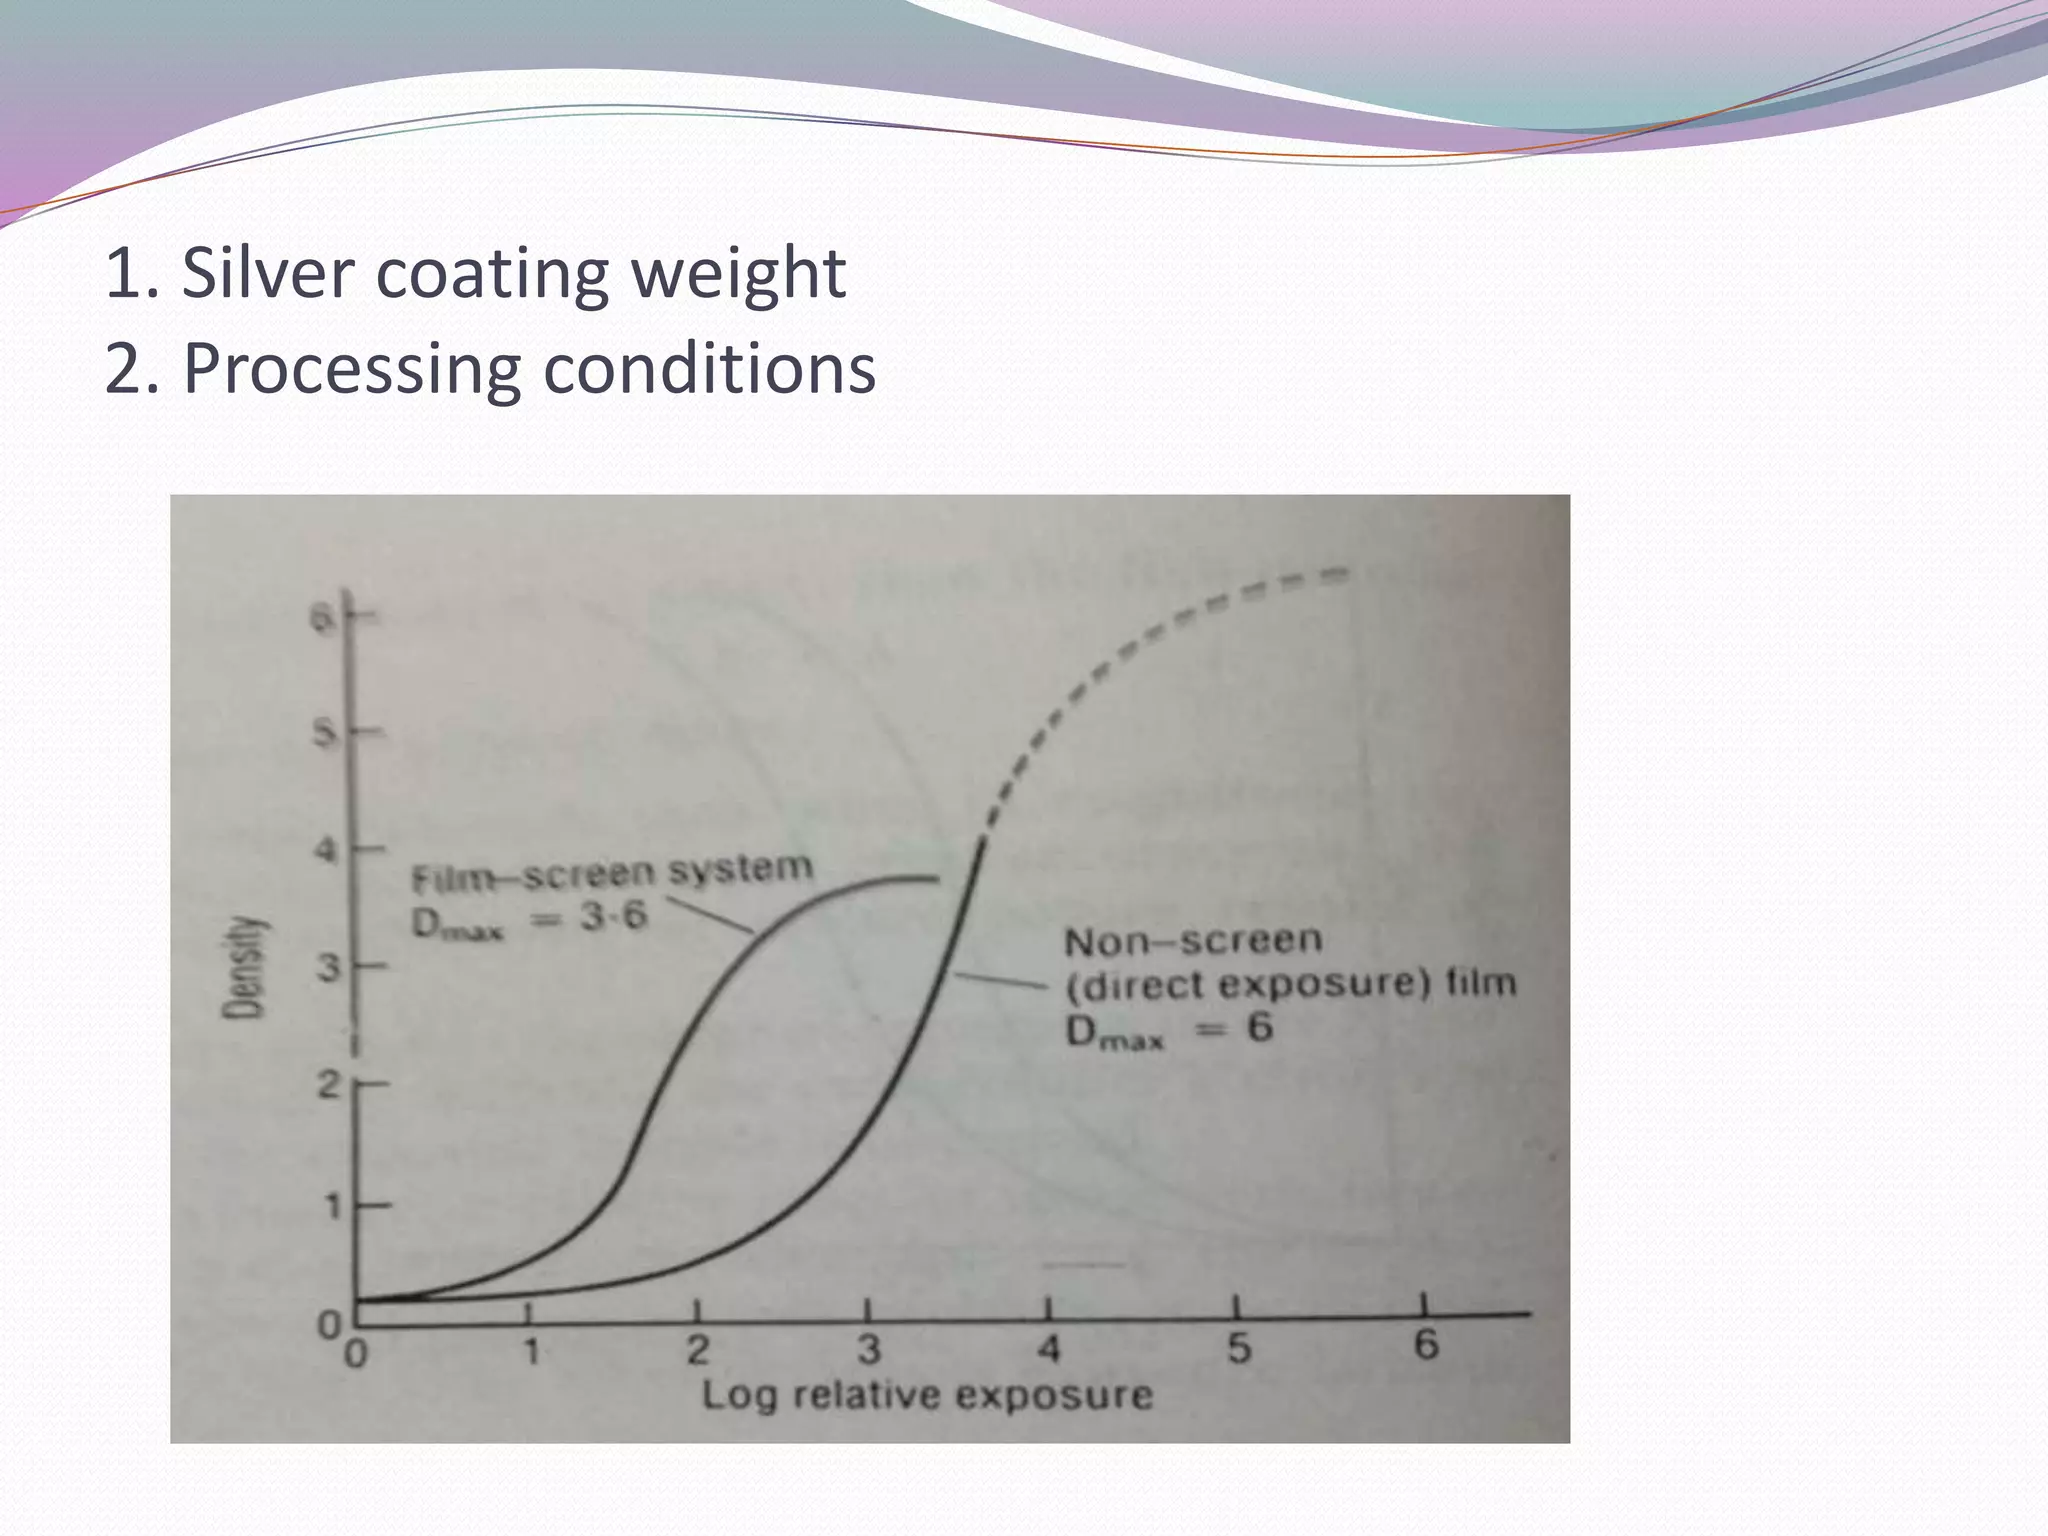
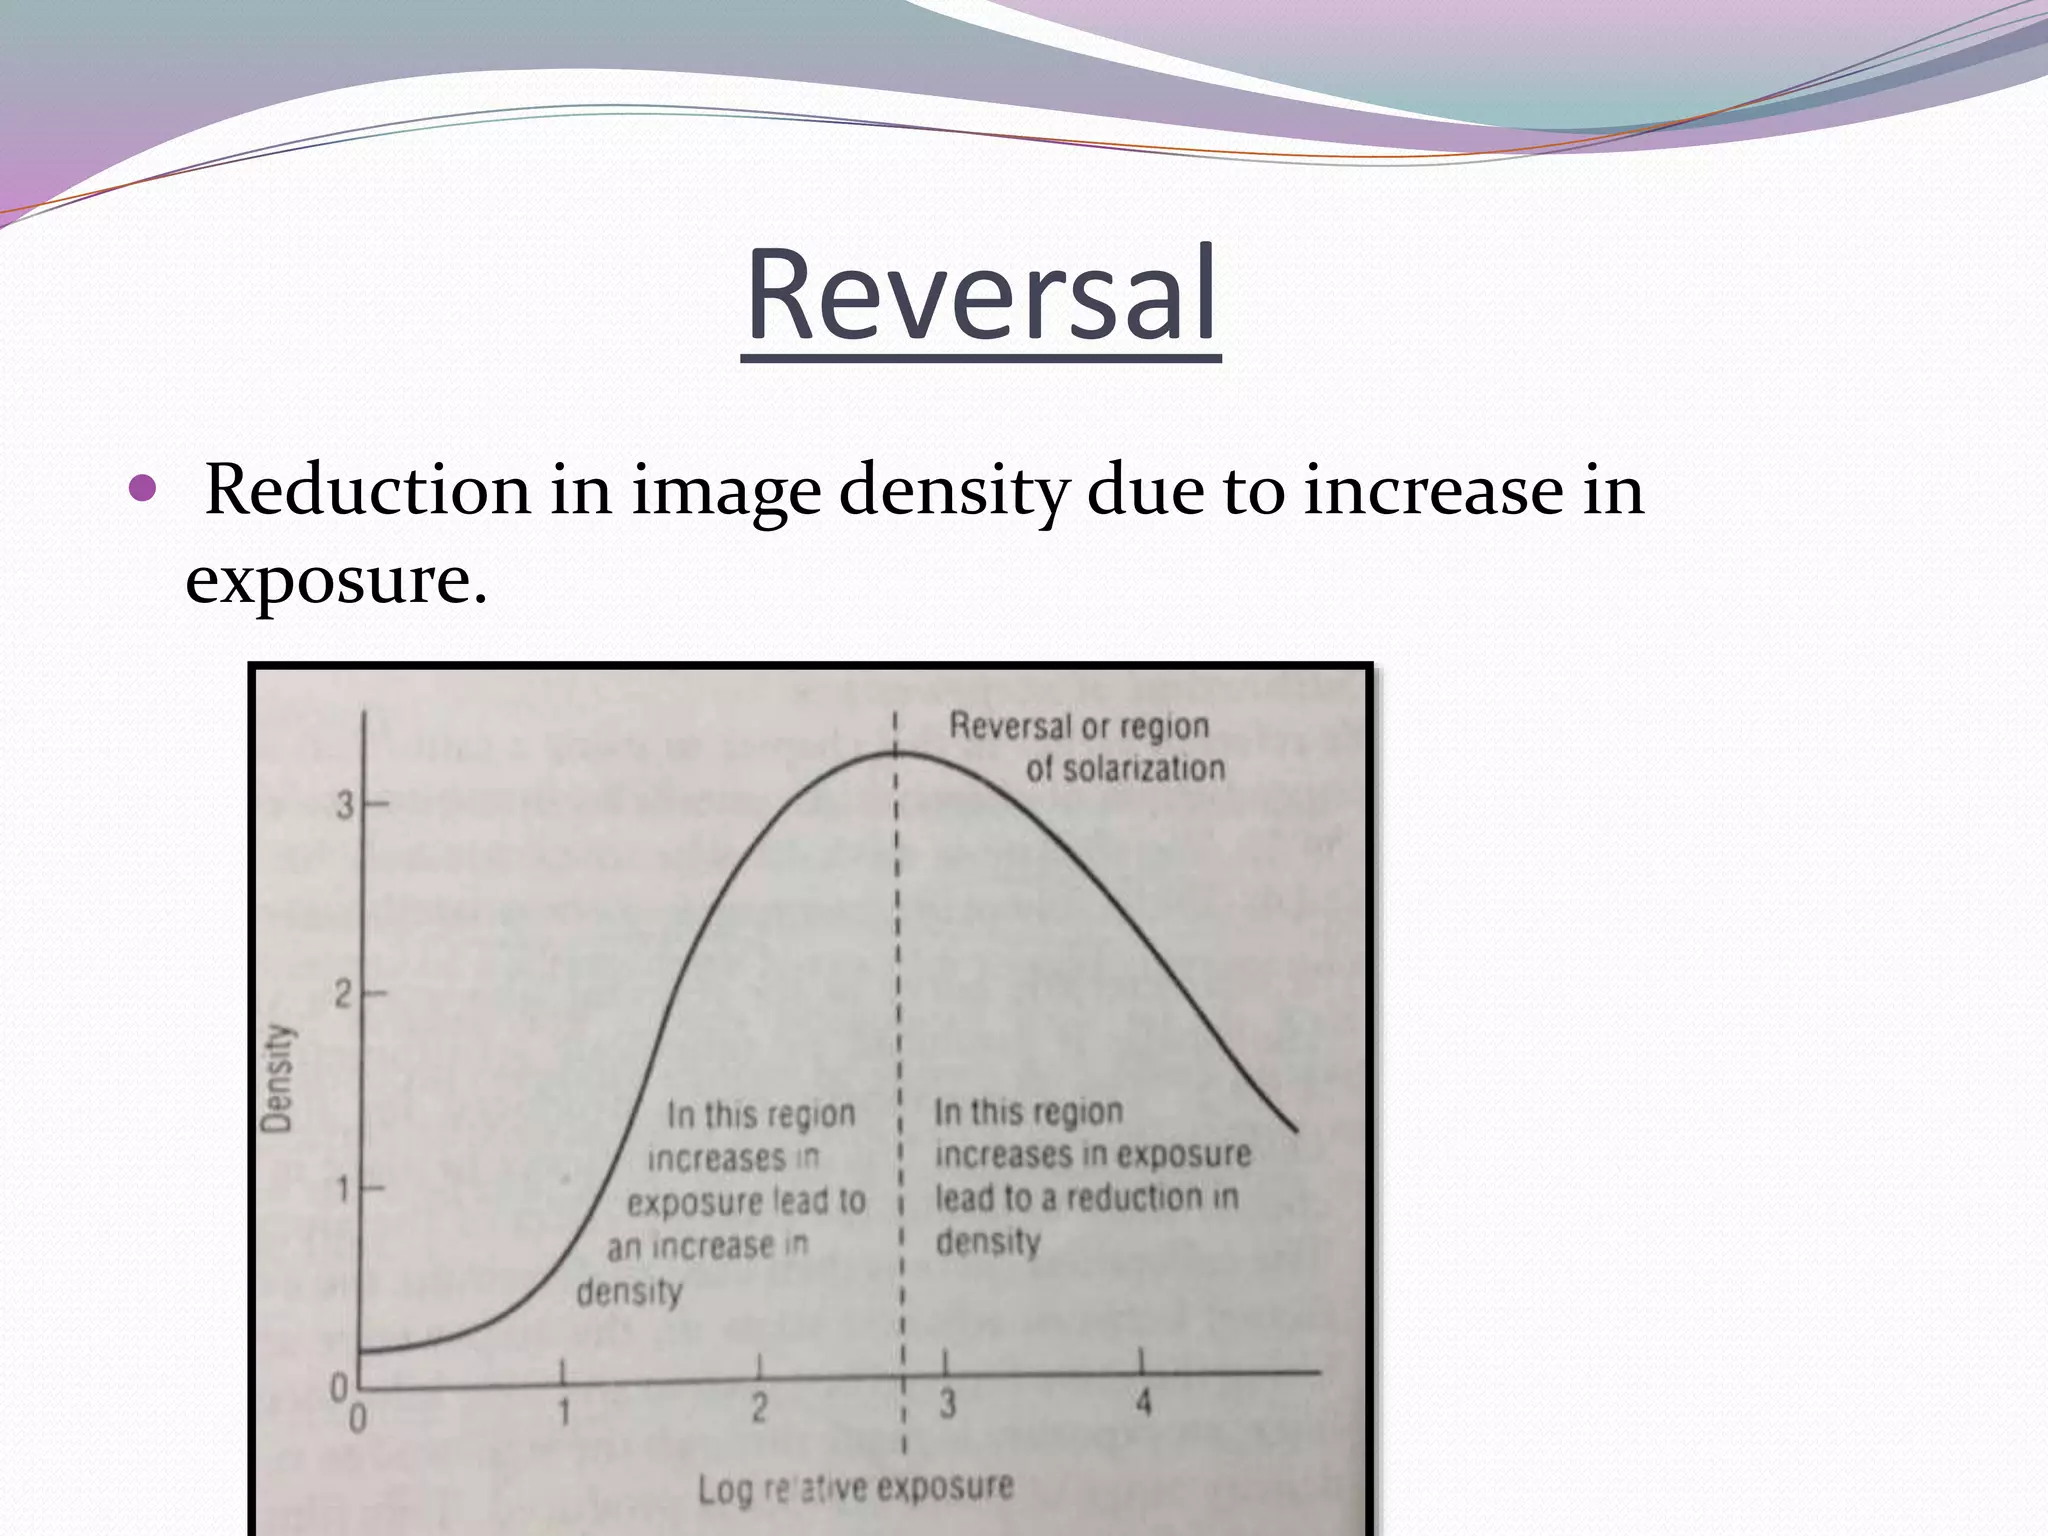
Describing photographic
perfomance
 To compare and to evaluate one film or film screen
system with another.
 Method - Characteristic curve
 Essential tool in sensitometry , scientific study of
response to exposure of photosensitive materials.
Optical density
 Opacity = I0/ It
 Optical density – expressing opacity in logarithmic
terms.
 Optical density= log 10 opacity
= log10 (Io / I t )
D=Density
I0=Light incident on film
It=Light transmitted by the film
Log relative exposure
 Typical radiographic image – range of exposure at
different areas of film.
 Expressed as logarithmic values.
 Range of 1 – 1000 becomes a range of 0 – 3.
Characteristic curve
 It is a graph which shows way in which a film or film
screen system responds to different levels of exposure.
 Plots optical density (D)against log relative exposure
(log E ).
 D log E curve
 Hurter and Driffield / H and D curve
STAGES OF CURVE
 1. Exposing and processing the film.
 2. Measuring the densities produced.
 3. Plotting the curve
1.Exposing and processing film
 Irradiate film with a series of exposures.
 Exposure series can be achieved in 2 ways :
 Time scale sensitometry– each area on film is exposed to
same intensity but duration of exposure is varied.
 Intensity scale sensitometry_Each area on film is exposd for
same duration of time but intensity varied
 X- ray exposure : Al step wedge calibration done to find
wedge factor.
 Wedge factor :- relationship with one exposure with next
exposure.
 Visible light exposure : Sensitometer
2.Measuring the densities
produced
 Densitometer – Optical density of each exposed step
on film strip
 Density is read out from a digital display or from an
analogue display using pointer & calibrated scale.
3. Plotting curve

Features of curve
 Curve is divided into 3 regions :
1. Region to left of toe
Base
density Fog Threshold
Region to left of toe
 Region of underexposure
 Base density
Due to absorption of light as it is transmitted through
base
 Fog : density produced by development of silver halide grains which
have received no intentional exposure.
Types : Storage fog, Safelight fog
 Threshold : As exposure increases , film emulsion begins to respond to
exposure and density begins to rise above gross fog.
Region between toe and shoulder

Contrast
Latitude
Speed &
Sensitivity
Contrast

1. Density difference and
image contrast
maximum where
curve is steepest.
2. Slope/ Gradient ( G)
of curve - measure
of contrast .
Gradient ( G) at a point on curve –
slope of the tangent to curve.
It angle of slope is A ,
G = tan A.
Gamma - Value of G is constant
along straightline .
Point of Inflection : Point
where curve changes from
concave to convex
Max gamma – tangent of angle
of slope of curve at its point of
inflection.
Average gradient
G̅ = DY – DX
log EY-log EX
FACTORS :
1. Film emulsion
characteristics
2. Film processing
conditions
3. Characteristics of
intensifying screen
For some direct exposure films, Point of inflection
occurs at density above midrange value used in
diagnostic imaging.
Latitude
 It refers way in which a film/ film screen system is able
to record successfully wide range of exposures.
FILM
LATITUDE
EXPOSURE
LATITUDE
Film latitude =log EY- log EX
Average gradient = DY - DX = Useful density range
log EY - logEx Film latitude
Exposure latitude
 Represents tolerance of a film / film screen system to
errors in selection of exposure factors when
radiographic exposure is made.
 Exp latitude = Film latitude – log exposure range
Speed & Sensitivity
 It is an expression of xray exposure required to
produce a given image density.
 Higher speed of system, less exposure to produce
given density. ( curve will be further to left )
 Speed of system A = mAs for system B
Speed of system B mAs for system A
How is relative speed assesed from
curve ?
Log exposure values corresponding to a net
density of 1 is 1.4 and 1.8
Log EB – log EA = .4 EB /EA = antilog ( .4) = 2.5
System A is 2 .5 times speed of system B
Region to right of shoulder

Maximum
Density
Reversal
Maximum density
 As film/ film screen is subjected to greater exposure ,a
point is reached where all of silver halide grains in
emulsion are reduced to silver.
1. Silver coating weight
2. Processing conditions
Reversal
 Reduction in image density due to increase in
exposure.
Testing for reversal property
 Film removed from cassette
 Exposed to bright light
 Film processed
 Normal films – black but film which exibits reversal –
almost transparent.
References
 Chesney’s Radiographic Imaging – John Ball and Tony
Price
Sensitometry & characteristic curve

Sensitometry & characteristic curve

  • 2.
    Describing photographic perfomance  Tocompare and to evaluate one film or film screen system with another.  Method - Characteristic curve  Essential tool in sensitometry , scientific study of response to exposure of photosensitive materials.
  • 3.
    Optical density  Opacity= I0/ It  Optical density – expressing opacity in logarithmic terms.  Optical density= log 10 opacity = log10 (Io / I t ) D=Density I0=Light incident on film It=Light transmitted by the film
  • 4.
    Log relative exposure Typical radiographic image – range of exposure at different areas of film.  Expressed as logarithmic values.  Range of 1 – 1000 becomes a range of 0 – 3.
  • 5.
    Characteristic curve  Itis a graph which shows way in which a film or film screen system responds to different levels of exposure.  Plots optical density (D)against log relative exposure (log E ).  D log E curve  Hurter and Driffield / H and D curve
  • 6.
    STAGES OF CURVE 1. Exposing and processing the film.  2. Measuring the densities produced.  3. Plotting the curve
  • 7.
    1.Exposing and processingfilm  Irradiate film with a series of exposures.  Exposure series can be achieved in 2 ways :  Time scale sensitometry– each area on film is exposed to same intensity but duration of exposure is varied.  Intensity scale sensitometry_Each area on film is exposd for same duration of time but intensity varied  X- ray exposure : Al step wedge calibration done to find wedge factor.  Wedge factor :- relationship with one exposure with next exposure.  Visible light exposure : Sensitometer
  • 8.
    2.Measuring the densities produced Densitometer – Optical density of each exposed step on film strip  Density is read out from a digital display or from an analogue display using pointer & calibrated scale.
  • 9.
  • 10.
    Features of curve Curve is divided into 3 regions : 1. Region to left of toe Base density Fog Threshold
  • 11.
    Region to leftof toe  Region of underexposure  Base density Due to absorption of light as it is transmitted through base  Fog : density produced by development of silver halide grains which have received no intentional exposure. Types : Storage fog, Safelight fog  Threshold : As exposure increases , film emulsion begins to respond to exposure and density begins to rise above gross fog.
  • 12.
    Region between toeand shoulder  Contrast Latitude Speed & Sensitivity
  • 13.
    Contrast  1. Density differenceand image contrast maximum where curve is steepest. 2. Slope/ Gradient ( G) of curve - measure of contrast .
  • 14.
    Gradient ( G)at a point on curve – slope of the tangent to curve. It angle of slope is A , G = tan A. Gamma - Value of G is constant along straightline . Point of Inflection : Point where curve changes from concave to convex Max gamma – tangent of angle of slope of curve at its point of inflection.
  • 15.
    Average gradient G̅ =DY – DX log EY-log EX FACTORS : 1. Film emulsion characteristics 2. Film processing conditions 3. Characteristics of intensifying screen For some direct exposure films, Point of inflection occurs at density above midrange value used in diagnostic imaging.
  • 16.
    Latitude  It refersway in which a film/ film screen system is able to record successfully wide range of exposures. FILM LATITUDE EXPOSURE LATITUDE
  • 17.
    Film latitude =logEY- log EX Average gradient = DY - DX = Useful density range log EY - logEx Film latitude
  • 18.
    Exposure latitude  Representstolerance of a film / film screen system to errors in selection of exposure factors when radiographic exposure is made.  Exp latitude = Film latitude – log exposure range
  • 21.
    Speed & Sensitivity It is an expression of xray exposure required to produce a given image density.  Higher speed of system, less exposure to produce given density. ( curve will be further to left )  Speed of system A = mAs for system B Speed of system B mAs for system A
  • 22.
    How is relativespeed assesed from curve ? Log exposure values corresponding to a net density of 1 is 1.4 and 1.8 Log EB – log EA = .4 EB /EA = antilog ( .4) = 2.5 System A is 2 .5 times speed of system B
  • 23.
    Region to rightof shoulder  Maximum Density Reversal
  • 24.
    Maximum density  Asfilm/ film screen is subjected to greater exposure ,a point is reached where all of silver halide grains in emulsion are reduced to silver.
  • 25.
    1. Silver coatingweight 2. Processing conditions
  • 26.
    Reversal  Reduction inimage density due to increase in exposure.
  • 27.
    Testing for reversalproperty  Film removed from cassette  Exposed to bright light  Film processed  Normal films – black but film which exibits reversal – almost transparent.
  • 28.
    References  Chesney’s RadiographicImaging – John Ball and Tony Price

Editor's Notes

  • #3 Photosensitive mat – silver halides light sensitive ..wen expsd to radtn they undergp changes which enable to form image
  • #4  Density – degree of blackness opacity of 1000 converts to 3 cos 1000 = 10 3 I not
  • #5 Causes problem in scaling values on graph.
  • #8 Time scalee – each area on film is exposed to same intensity but duration of exposure is varied. Intensity scale : Each area on film is exposd for same duration of time but intensity varied
  • #11 2 sharp curved sections – toe and shoulder
  • #13 Straightline part..feature – changes in exposure causes significant changes in density
  • #15 Gamma – tangent of angle of slope of straightline part of characeteristic curve. POINT OF INF- point at which curve changes from being concave to convex. Value of gradient goes on changing where on curve its measured.
  • #16 For some film emulsion( direct exp type ), point of infectn occurs at a density above midrange value useful in diagnostic imaging. Therfore Average gradient used.
  • #18 FIL LAT: DIFF BTW UPPER & LOWER LIMITS OF LOG RELATIVE EXPOSURE
  • #23 It can be calcutd from chaar curve of systems but theys hud hav comm log relatv exp axis. Diff btw log rel exp. Coree to a density of 1 is read and diff is calctd. Log eb – ea. By log, log eb – log ea = log eb / log ea. Obtain antilog of eb/ ea. Which is rel speed.
  • #27 Historically films were exposed to bright sunlight to trigger image reversal. Such films are said to be solarized ,, reversal part of curve – region of solarization.