Downloaded 89 times
![Solid Earth Geophysics Ali Oncel [email_address] Department of Earth Sciences KFUPM Today’s class: Seismology Measuring the Interior Reading: Fowler Chapter 4](https://image.slidesharecdn.com/lecture15-091219232635-phpapp01/85/ONCEL-AKADEMI-SOLID-EARTH-GEOPHYSICS-1-320.jpg)
![Seismographs A seismograph is an instrument which writes a permanent continuous record of earth motion.[ 1 ] Measuring the three orthogonal components of ground motion at a seismic.](https://image.slidesharecdn.com/lecture15-091219232635-phpapp01/85/ONCEL-AKADEMI-SOLID-EARTH-GEOPHYSICS-15-320.jpg)

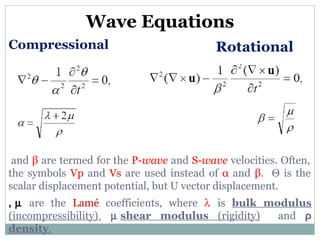
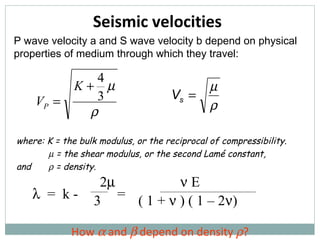
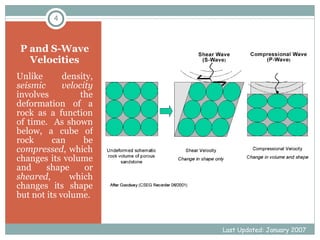
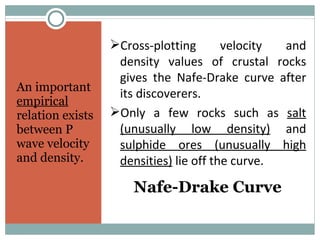
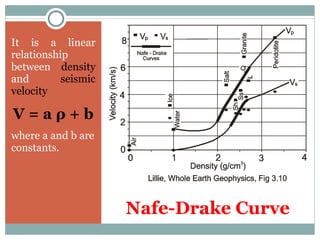
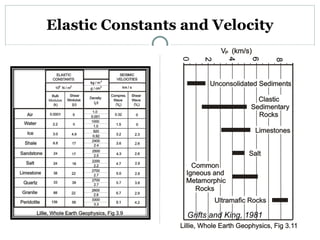
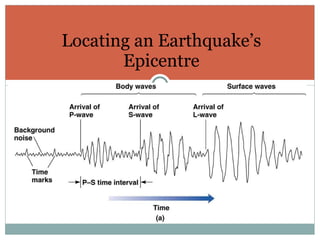
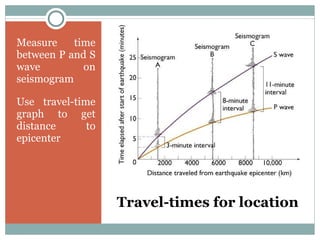
This document discusses concepts in seismology including: - P and S wave velocities are represented by symbols α and β or Vp and Vs. - Seismic velocities depend on properties like bulk modulus, shear modulus, and density. - There is an empirical relationship between P wave velocity and density known as the Nafe-Drake curve. - Earthquake locations can be determined by measuring travel times of seismic waves between stations.


![EARTHQUAKE Presentation [TIPS 2]](https://cdn.slidesharecdn.com/ss_thumbnails/learningearthquakedesignfinal-140726123358-phpapp02-thumbnail.jpg?width=640&height=640&fit=bounds)


