The document provides an overview of fundamental analysis and technical analysis techniques used in security analysis. It discusses various fundamental analysis approaches like economy analysis, industry analysis, and company analysis. It also covers technical analysis indicators like Dow Theory, Elliott Wave Principle, chart types, chart patterns, and moving averages. Finally, it provides a brief introduction to the efficient market theory which states that security prices reflect all available information.

![1. Economy Analysis
In actual practice, you must have noticed that investment decisions of individuals and the institutions made in
the economic set-up of a particular country. It becomes essential, therefore, to understand the star economy of
that country at the macro level. The analysis of the state of the economy at the macro level incorporates the
performance of the economy in the past, how it is performing in the present and how it is expected to perform
in future. Also relevant in this context is to know how various sectors of the economy are going to grow in the
future.
Economic variables are taken into consideration. Such as:
o Growth of national income (GNP, NNP, GDP)
o Business cycle (boom, depression, recession, recovery)
o Inflation
o Interest rate
o Exchange rate
o Infrastructure
o Political stability
• Economic forecasting-economic variables helps to forecast the economic growth
Eg: survey method, opinion method, barometric
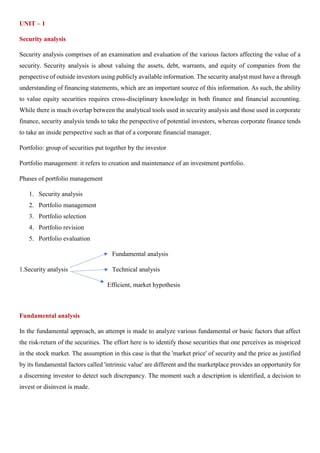
2. Industry Analysis
Industry Analysis After conducting an analysis of the economy and identifying the direction it is likely to take
in the short, interim and long-term, the analyst must look into various sectors of the economy in terms of
various industries. An industry is a homogenous group of companies.
Intro – maturity – growth - decline
It involves:
• Industrial lifecycle [pioneering/growth stage, expansion, stagnation, decay]
• Industry characteristics:
Industry
output
Company
Analysis
Industry Analysis
Economy Analysis](https://image.slidesharecdn.com/sapm-180422174233/85/Security-Analysis-and-Portfolio-Management-3-320.jpg)