Outline
• Fundamental andTechnical Analysis
• Random Walk
• Efficient Market Hypothesis (EHM) and Portfolio
Management
• Fixed Income Security Valuation and Analysis (Bond
Portfolio Management)
• Credit Rating and Development of Credit Rating
Regulations
• Analysis of fixed income investment in Ghana
• Municipal Bond and Sovereign Bonds
3.
What is aSecurity
Assets with some financial value
are called securities.
What is SecurityAnalysis ?
• The analysis of various tradable financial
instruments is called security analysis.
• Security analysis helps a financial expert or a
security analyst to determine the value of
assets in a portfolio.
7.
• Security analysisrefers to the analysis of
trading securities from the point of their
prices, returns and risks.
• All investments are risky and the expected
return is related to the quantum of risk. All
investors try to earn more return with low
level of risk or without risk. For this purpose
they are considering some objectives.
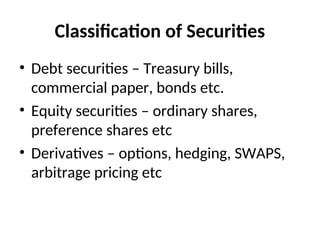
Classification of SecurityAnalysis
Security Analysis is broadly classified into three
categories:
•Fundamental Analysis
•Technical Analysis
•Quantitative Analysis
Technical Analysis
• Analystsand market technicians examine
prior price and volume data as well as other
market-related indicators to determine past
trends in the belief that they will help forecast
future ones.
• Technical analysis is the use of stock prices,
trading volume and other market data to
formulate rules telling the technician when to
buy or sell stocks.
12.
• The technicalanalysts are sometimes
called chartists because they study
records and charts of past stock prices
hoping to find patterns they can exploit
to make profit.
• Many of these technician do not even
consider the influence of other market or
company information to make their
investment decision.
13.
Assumptions of TechnicalAnalysis
• Market value is determined by the interaction of
demand and supply.
• It is assumed that though there are minor
fluctuations in the market, stock prices tend to
move in trends that persist for long periods.
• Reversals of trends are caused by shifts in
demand and supply
• Shifts in demand can be detected sooner or later
in charts.
• Many chart patterns tend to repeat themselves
14.
Tools of Technicalanalysts
• Some of the tools used by chartists to measure supply
and demand and to forecast security prices are the
• Dow theory chart: used to indicate reversals and trends
in the market as a whole or in individual securities
• Odd-lot theory: assumes that the common man is
usually wrong, and it is therefore advantageous to
pursue strategies opposite to his thinking.
• Confidence index, breadth-of-market indicators,
relative-strength analysis, and trading-volume data.
15.
Advantages of TechnicalAnalysis
• Once the technician has determined the
particular role to use in the technical strategy,
making the actual investment decision is easy
• Technical analysis is easy to learn and requires
no specialised financial knowledge
• Technicians have access to all the information
they require in their analysis. Stock prices,
and volume of activities are easily accessible
through the press or the Internet.
16.
Criticisms of TechnicalAnalysis
• Opponents of technical analysis claim that there is no real
objective, substantial evidence that it works. Indeed the wealth of
information supporting the weak form of efficient market
hypothesis (EMH) rejects technical analysis.
• Another criticism of the technical analysis is that it is self-fulfilling
prophecy. Consider several hundreds of technicians using the
same information and arriving at the same decision.
• By the time they have processed the stock price information and
acted, other technicians will have done same, the stock price will
have reached its new equilibrium and it will be too late to make
trading profit.
• The final criticism deals with the difficulty of discerning chart
patterns as they develop. A good instructional manual of charting
will show nice examples of all the standard chart patterns,
identifying the buy or sell points.
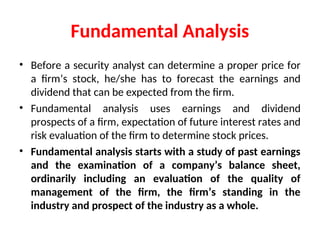
Fundamental Analysis
• Beforea security analyst can determine a proper price for
a firm’s stock, he/she has to forecast the earnings and
dividend that can be expected from the firm.
• Fundamental analysis uses earnings and dividend
prospects of a firm, expectation of future interest rates and
risk evaluation of the firm to determine stock prices.
• Fundamental analysis starts with a study of past earnings
and the examination of a company’s balance sheet,
ordinarily including an evaluation of the quality of
management of the firm, the firm’s standing in the
industry and prospect of the industry as a whole.
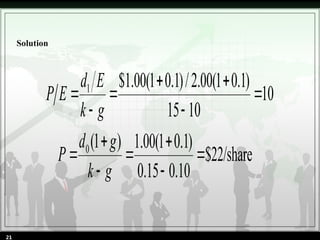
• The stockof XYZ Corporation is currently
paying a dividend of $1.00 per share. The firm’s
dividend growth rate is expected to be 10%. For
firms in the same risk class as XYZ, market
analysts agree that the capitalization rate is
approximately 15%. Current earnings for XYZ
are $2.00 per share and they are expected to
grow at 10%. What are the P/E ratio and the
price of XYZ shares given this information?
Sample Problem
20
• Fundamental analysisis therefore
conducted on three levels:
• The economy
• The industry and
• The firm
23.
• There aretwo types of fundamental analysis namely
• Top-down analysis and
• Bottom-up analysis.
• The top-down analysis starts with the broad economic
environment, examining the state of the aggregate
economy and even the international economy, the
firm’s position within the industry is examined by
looking at which firm(s) within the industry will
maximise investment return.
• The bottom-up analysis on the other hand, begins at
the micro-level (firm’s level) expand the analysis to the
company’s industry or sector and end with the analysis
of the economic environment.
24.
Economy Analysis
• Economicanalysis will be considered by
looking at both
• Global and
• The domestic economies.
25.
Global Economy
• Atop-down analysis must start with the global
economy. The international economy might affect
• A firm’s export prospects
• The price competition it faces from imported goods
(competitors)
• The profit it makes from investment abroad
• The political environment
• Exchange rate fluctuations
• Competition
• Social environment
• Economic environment etc
Industry Life Cycle
•An industry analysis helps place an industry on
the life cycle curve and in turn guides the analyst
towards decision on industry growth, the
duration of growth, profitability and potential
rate of return. The analyst can determine where
all companies in the industry are in the stage of
the life cycle and translate company differences
into various assumptions that will affect their
valuation.
• The life cycle of an industry is divided into 5
stages:
29.
Development Stage
• Thedevelopment stage includes
companies that are getting started in
business with new product development
or production technique that makes
them unique.
• At this stage it is difficult to predict which
firms will emerge as industry leaders.
30.
Growth Stage
• Itrepresents an industry or company
that has achieved a degree of market
acceptance for its products.
• At this stage earnings would be retained
for reinvestment.
• Companies will be dividend to
shareholders
31.
Expansion Stage
• Atthe expansion stage, sales and earnings
expansion continues at a decreasing rate.
Industrial leaders begin to emerge.
• The survivors in the industry are more stable
and market share is easier to predict.
• The performance of the surviving firms more
closely tracks the performance of the overall
industry.
32.
Mature
• At thisstage the product has reached its full
potential for use by consumers.
• The product has become standardised and
producers compete on the basis of price.
• This leads to narrower profit margin and
further pressure on profit.
• Sales grow at a rate equal to the economy as
measured by long-term trend in GDP.
33.
Decline
• At thisstage, the industry might grow at a rate
lower than the economy or it might even
shrink.
• Industries suffer decline in sales as a result of
competition from new products.
• It should be noted that it might not be the
whole industry that goes into decline but
rather weak firms within the industry.


![7.__Developing_a_Research_Proposal[1].pptx](https://cdn.slidesharecdn.com/ss_thumbnails/7-260131073037-df92dd7d-thumbnail.jpg?width=640&height=640&fit=bounds)


![Hacking-Uncovered-How-People-Get-Hacked-and-How-to-Stay-Safe[1].pptx](https://cdn.slidesharecdn.com/ss_thumbnails/hacking-uncovered-how-people-get-hacked-and-how-to-stay-safe1-260130170011-4883a9c7-thumbnail.jpg?width=640&height=640&fit=bounds)


