Download to read offline
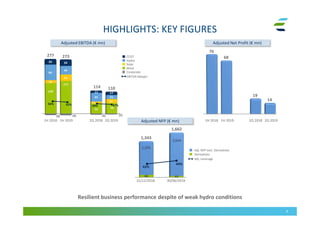
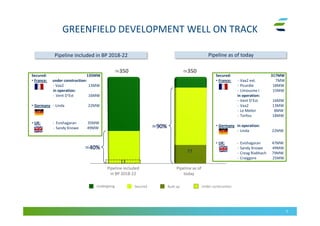
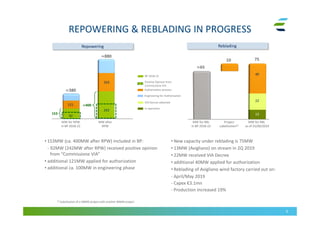
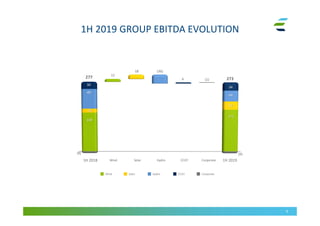
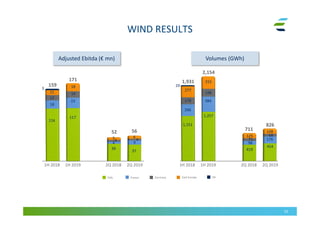
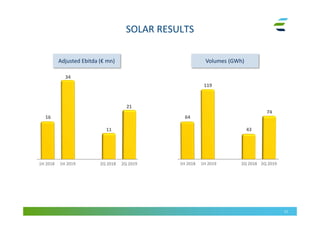
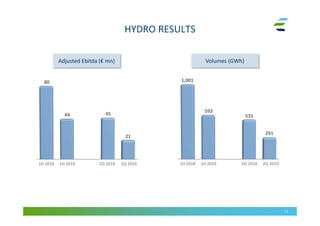
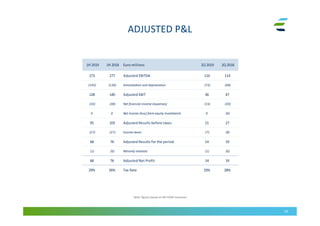
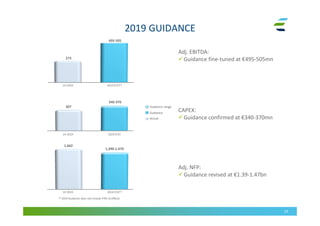
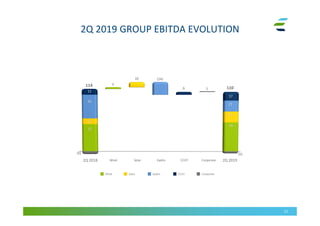
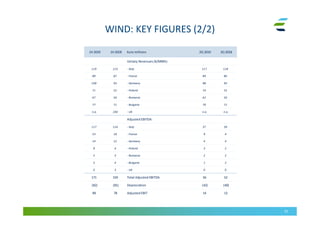


2Q 2019 Results - Adjusted EBITDA was €110 million, down slightly from €114 million in 2Q 2018. - Greenfield development pipeline remains on track at approximately 350MW. - Repowering and reblading projects are progressing with additional capacity in the authorization and engineering phases. - 2019 guidance was fine-tuned with an Adjusted EBITDA range of €495-505 million and Adjusted NFP revised to €1.39-1.47 billion.


