Download as PDF, PPTX

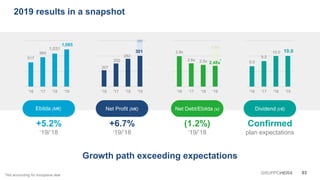
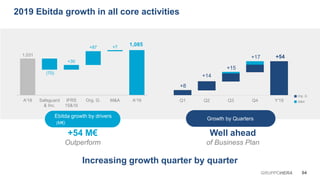
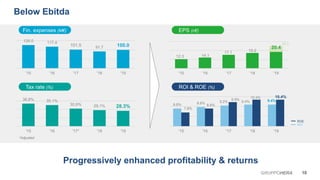
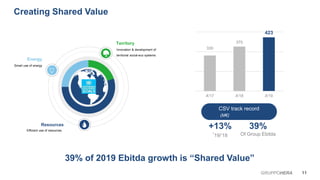
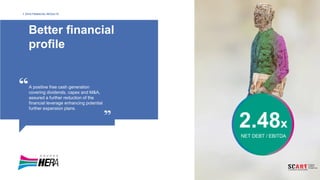
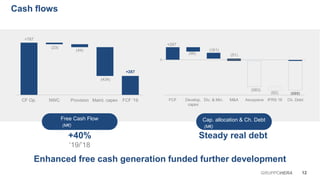
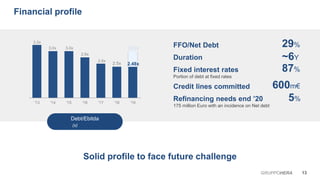
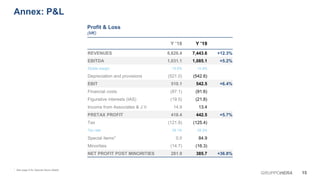

- The Group achieved record results in 2019, with EBITDA growing 5.2% to over 1 billion euros, exceeding expectations. - Net profit increased 6.7% despite one-off costs from the Ascopiave acquisition. - Strong cash flow generation allowed further deleveraging and investments in growth opportunities like M&A and organic projects.


