Download to read offline
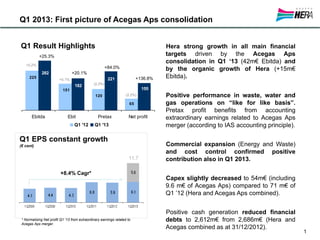
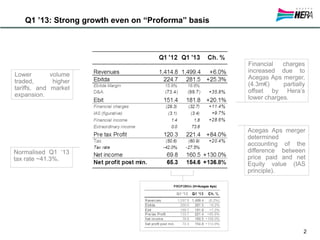
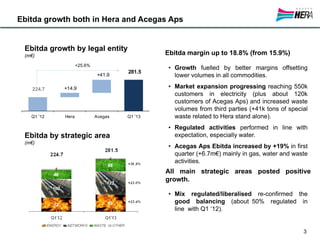
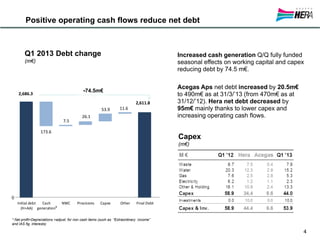
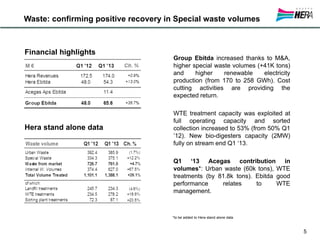
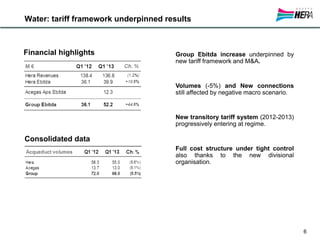
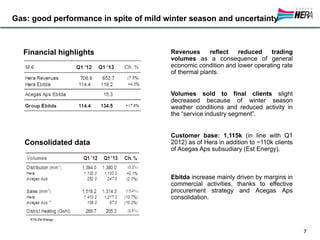
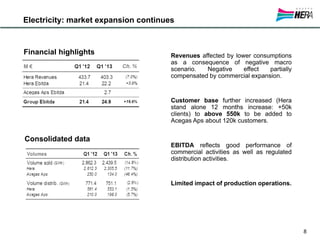
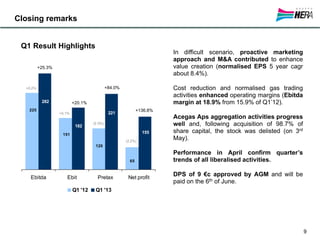
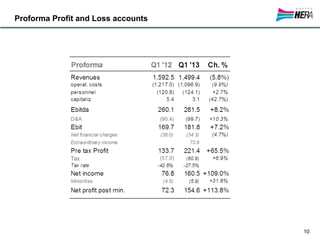

Hera Group reported strong growth in key financial figures in Q1 2013 driven by the consolidation of Acegas Aps and organic growth. EBITDA increased 25.3% to €282 million compared to Q1 2012. All business areas saw positive growth, with waste and renewable energy performing well. Net debt was reduced by €74.5 million despite capital expenditures and seasonal working capital needs. Management expects the positive trends to continue in liberalized activities in the remainder of the year.


