Download to read offline

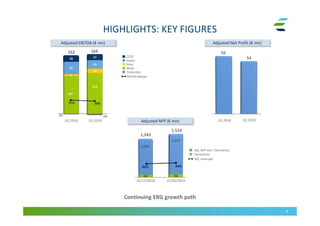
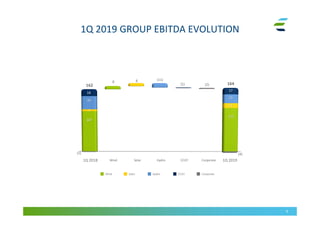
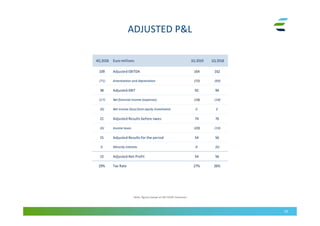
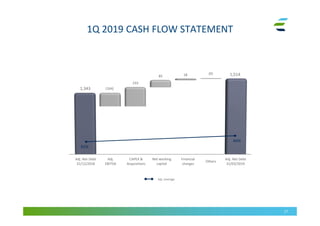
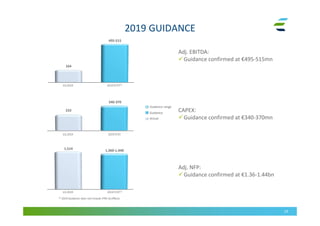


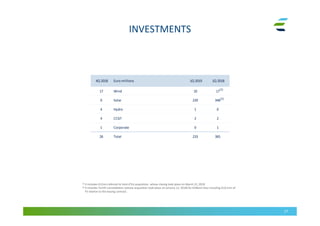

In the 1Q 2019 results document: - ERG reported adjusted EBITDA of €164 million, up slightly from €162 million in 1Q 2018. - Net debt increased to €1.514 billion from €1.343 billion at the end of 2018, due to investments and acquisitions totaling €233 million in the quarter. - Guidance for 2019 was confirmed, with expected adjusted EBITDA of €495-515 million and net debt of €1.36-1.44 billion.


