Download as PDF, PPTX


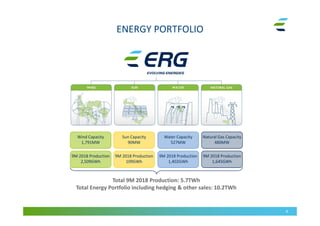
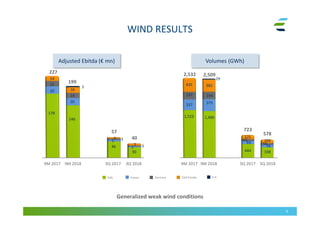


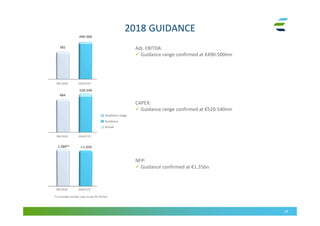


- ERG reported good third quarter 2018 results thanks to its diversified generation mix. Adjusted EBITDA was €381 million for 3Q 2018 and €356 million for 3Q 2017. - Electricity production was in line with the previous year despite weaker wind conditions in some markets. Hydro and CCGT benefited from good availability and margins. - Net financial position was €1,389 million as of September 30, 2018, including a vendor loan of €37 million. The company expects full year net financial position of approximately €1,350 million. - Guidance for 2018 adjusted EBITDA and capital expenditures were confirmed at €490-500 million and €520-540 million, respectively.


