Download as PDF, PPTX
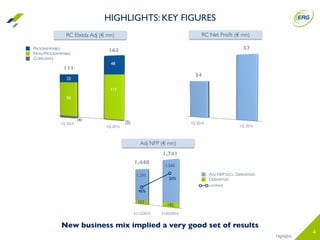
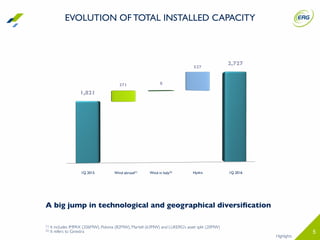
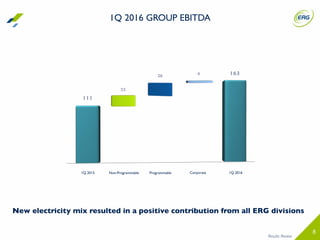
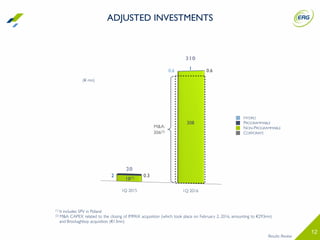
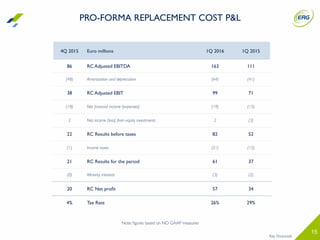
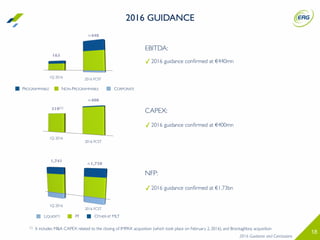
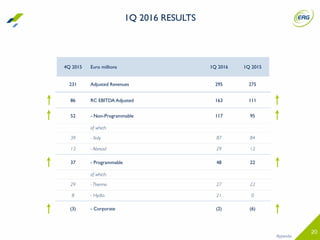
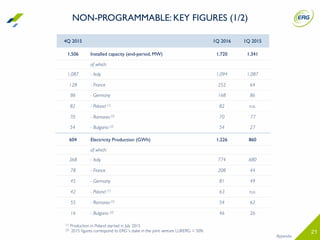
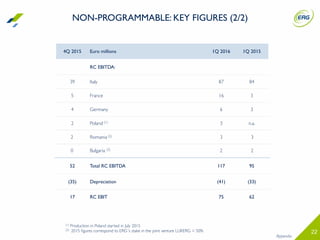
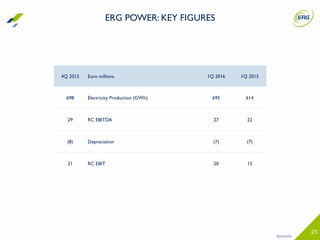
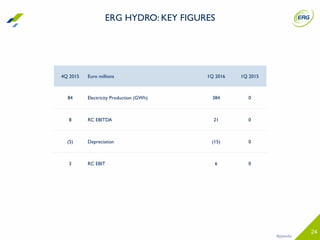

In the first quarter of 2016, ERG reported solid financial results. Total installed capacity increased to 1,720 MW due to acquisitions. Adjusted EBITDA was €163 million, up from €111 million in the first quarter of 2015. Guidance for 2016 was confirmed with adjusted EBITDA of €400 million, CAPEX of €440 million, and adjusted net financial position of €1.73 billion.


