Download as PDF, PPTX
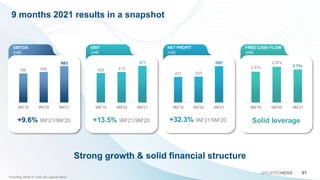
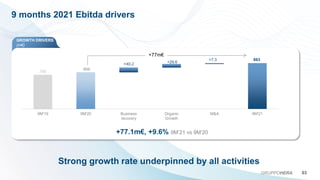
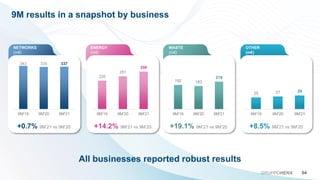
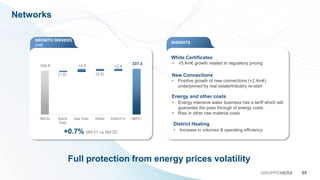
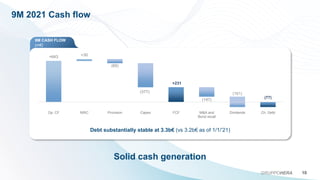
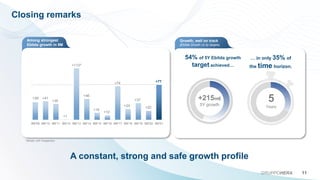
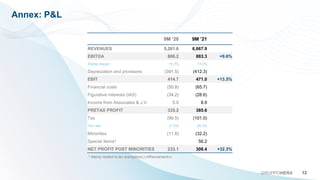

Gruppo Hera reported strong growth in its financial results for the first 9 months of 2021. EBITDA increased 9.6% to €883 million, driven by growth across all business segments. Net profit grew 32.3% to €308 million, benefiting from business recovery, organic growth initiatives, and acquisitions. Cash flow remained solid, allowing continued investment in infrastructure expansion. Management expects further growth in 2022 supported by economic recovery trends and its focus on sustainable resource management.


