Download as PDF, PPTX

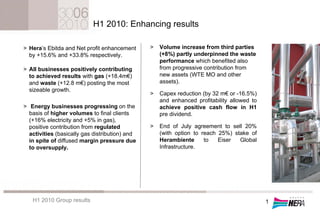
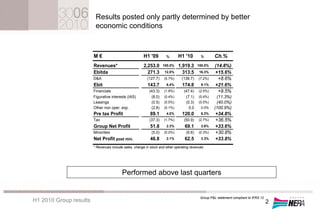
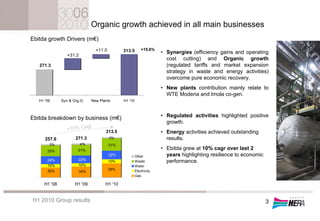

Hera achieved positive results in the first half of 2010, with EBITDA up 15.6% and net profit up 33.8% compared to the first half of 2009. All business lines contributed positively, with waste and gas posting the largest earnings growth. Capex was reduced by 16.5% while maintaining a positive cash flow. Volume increases across business lines, cost efficiencies, and the contribution of new assets supported the improved performance.


