Download as PDF, PPTX


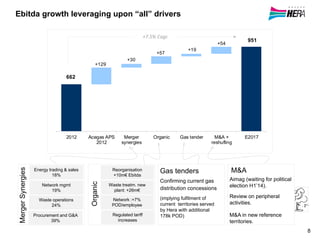

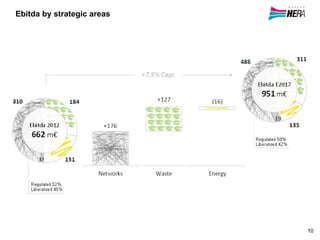
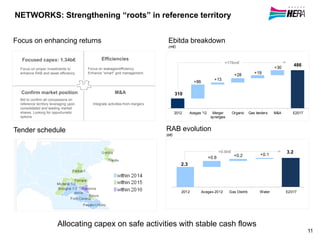


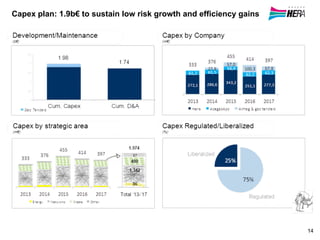


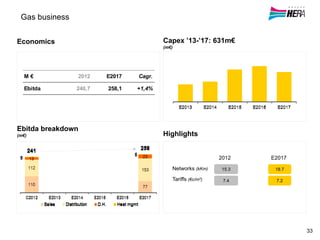
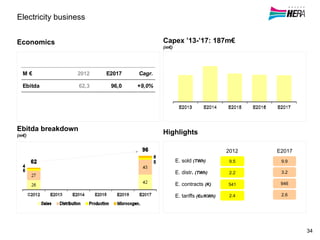
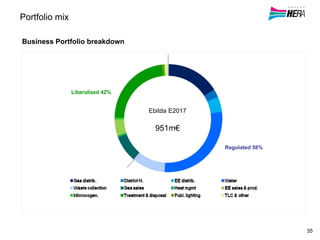


Hera Group presents a business plan update for 2017 that incorporates recent developments and outlines strategies across its network, waste, and energy businesses. Key points include: 1) EBITDA is forecasted to grow from 662 million euros in 2012 to 951 million euros in 2017 through organic growth, M&A synergies, gas tenders, and portfolio reshuffling. 2) Capex of 1.9 billion euros will be invested to sustain low-risk growth and efficiency gains, focusing on regulated network assets. 3) The strategy emphasizes efficiency, expanding downstream markets, value-adding M&A, and adapting to regulatory changes while executing the current M&A pipeline. 4) Financial