Effect of Stocking Density on the Resistance to Fasting, Growth and Survival ...Agriculture Journal IJOEAR
Abstract— After artificial reproduction of African catfish Heterobranchus bidorsalis, larvae of two days old and 2.18 ± 0.35 mg of mean weight were used to perform two experiments in order to assess the effect of stocking density on their fasting resistance, growth and survival. During the first experiment which lasted 11 days with four batches of larvae at densities of 1, 2, 3 and 4 individuals/ml, results showed that density did not significantly affect (p˂0,05) the resistance to fasting of larvae. However, first mortalities were observed at D5 for all the densities, the higher daily mortality was recorded at D10 and the last mortalities were obtained at D12.
Results of the second experiment revealed that the weight and growth performance of larvae decreased with the increasing of the density after 28 days of rearing. In contrast, the larval survival rate increased with the density. The values of survival rate were respectively 30.53 ± 4.32 and 55.30 ± 21.70 % for the densities 1 ind./l and 20 ind./l.
Kevin Hugins research paper.
Meriam-Webster defines endocrinology as “a branch of medicine concerned with the structure, function, and disorders of the endocrine glands.” When considering the human endocrine system, most people think of endocrine glands such as the hypothalamus, pituitary, gonads, adrenals, and pancreas. No one would deny that hormones released from endocrine glands have a powerful effect on cell function throughout the human body. A relatively new field of study called Microbial Endocrinology suggests that the interactions and effects of the human endocrine system involve more organisms than just the human.
Filling the Gaps: Arbuscular Mycorrhizal Fungi Biodiversity in the Tropical E...CrimsonpublishersMCDA
Filling the Gaps: Arbuscular Mycorrhizal Fungi Biodiversity in the Tropical Ecosystems by Geofrey E Soka* in Modern Concepts & Developments in Agronomy
Macroecology of environmental change responsePeter Jørgensen
PhD defense "Macroecology of Environmental Change Response" by Peter Søgaard Jørgensen at Center for Macroecology, Evolution and Climate, University of Copenhagen, presented on June 30, 2014. Main supervisor Carsten Rahbek. Assessment committee Jon Fjeldså, Rhys Green & David Orme.
Genome-wide association mapping of canopy wilting in diverse soybean genotypesAvjinder (Avi) Kaler
Genome-wide association analysis identified 61 SNP markers for canopy wilting, which likely tagged 51 different loci. Based on the allelic effects of the significant SNPs, the slowest and fastest wilting genotypes were identified.
With this calendar, PerkinElmer Applied Genomics takes the opportunity to both celebrate biodiversity and to remind us that inaction is not an option anymore. Since we understand the importance of concrete actions, PerkinElmer pledges to make a donation to the University of Texas at Austin, Biodiversity Center every time a QR code on this calendar is scanned.
Morphological Characteristics and Sexual Maturity in M.masonina, a Freshwater...paperpublications3
Abstract: The present study aims to assess the status of fresh water crab resources in the area. The study was made on species diversity including its taxonomic position, morphological characteristics, habits, habitat and distribution. Out of various water bodies scanned so far two species of crabs were recorded viz Maydelliathelphusa masoniana Henderson, (1893) from plain areas and Himalayapotamon emphysetum Alcock (1909) from hilly stretches of the region. A total of 592 crabs were obtained, 282 being males and 310 females. The maximum carapace in female was 6.0 cm with abdominal width of 4.5 cm. Males exhibited carapace width of 6.3 cm and chela length of 5.7 cm and chela depth of 3.5 cm.
Keywords: M.masoniana, Morphological features, sexual maturity.
Title: Morphological Characteristics and Sexual Maturity in M.masonina, a Freshwater Crab from Jammu Waters
Author: Meenakshi Bandral
International Journal of Recent Research in Life Sciences (IJRRLS)
ISSN 2349-7823
Paper Publications
Population Dynamics of the Annular Seabream Diplodus annularis (Linnaeus, 197...Premier Publishers
Age, growth, length-weight relationship (LWR), condition factor (K) and relative condition factor (Kn) were investigated for the annular seabream Diplodus annularis collected from non-commercial catches around the Maltese Islands between July 2012 and December 2017 (N=1661). The age distribution of the specimens was found to range between 0+ and 17+ years with a positive allometric growth. Average Kn was found to be 1.03 in males and 0.99 in females. The growth parameters of the von Bertalanffy equation were: L∞=21.38, K=0.123year-1 and tₒ = -5.40year for all individuals (males, females, hermaphrodites and unsexed). This study is the first reference for D. annularis on the length weight equation parameters, condition factor, relative condition factor and age around the Maltese Islands and establishes a new maximum of 17 years.
Environmental protection is critical to maintain ecosystem services essential for human well-being. It is important to be able
to rank countries by their environmental impact so that poor performers as well as policy ‘models’ can be identified. We
provide novel metrics of country-specific environmental impact ranks – one proportional to total resource availability per
country and an absolute (total) measure of impact – that explicitly avoid incorporating confounding human health or
economic indicators. Our rankings are based on natural forest loss, habitat conversion, marine captures, fertilizer use, water
pollution, carbon emissions and species threat, although many other variables were excluded due to a lack of countryspecific
data. Of 228 countries considered, 179 (proportional) and 171 (absolute) had sufficient data for correlations. The
proportional index ranked Singapore, Korea, Qatar, Kuwait, Japan, Thailand, Bahrain, Malaysia, Philippines and Netherlands
as having the highest proportional environmental impact, whereas Brazil, USA, China, Indonesia, Japan, Mexico, India,
Russia, Australia and Peru had the highest absolute impact (i.e., total resource use, emissions and species threatened).
Proportional and absolute environmental impact ranks were correlated, with mainly Asian countries having both high
proportional and absolute impact. Despite weak concordance among the drivers of environmental impact, countries often
perform poorly for different reasons. We found no evidence to support the environmental Kuznets curve hypothesis of a
non-linear relationship between impact and per capita wealth, although there was a weak reduction in environmental
impact as per capita wealth increases. Using structural equation models to account for cross-correlation, we found that
increasing wealth was the most important driver of environmental impact. Our results show that the global community not
only has to encourage better environmental performance in less-developed countries, especially those in Asia, there is also a
requirement to focus on the development of environmentally friendly practices in wealthier countries.
Content Marketing World Sydney: 125 tweeted takeawaysLenovo
After the whirlwind that was Content Marketing World Sydney, we scrolled through the endless stream of #cmworld tweets to bring you a bite-sized selection of the event's top takeaways.
fish population dynamics, Population structureDegonto Islam
Estimation of fish population dynamics are often based on age structures. Understanding past
population structure is of interest to evolutionary biologists because it can reveal when migration
regimes changed in natural populations, thereby pointing to potential environmental factors such as
climate changes as driving evolutionary forces. Characterizing the structure of extent populations is also
key to conservation genetics as translocation or reintroduction decisions must preserve evolutionary
stable units. Finally, population structure has important biomedical consequences either when a number
of subpopulation groups is locally adapted to particular environmental conditions (and maladapted
when exposed to new environments) or represents a confounding factor in the study of the statistical
association between genetic variants and phenotyp
Genotype-By-Environment Interaction (VG X E) wth ExamplesZohaib HUSSAIN
Introduction
Phenotypic variation can be caused by the combination of genotypes and environments in a population. Genotypes are all equally sensitive to their environments, meaning that a change of environment would impact the phenotype of all genotypes to the same extent. In fact, genotypes very often have different degrees of sensitivity to environmental conditions. This cause of phenotypic variance is called genotype by- environment interaction and is symbolized by VG x E. This adds another term to the expression for the independent causes of total phenotypic variation in a population
Ve = VG + VE + VG xE
August 2000 Vol. 50 No. 8 • BioScience 653ArticlesTh.docxrock73
August 2000 / Vol. 50 No. 8 • BioScience 653
Articles
The Global Decline
of Reptiles, Déjà Vu
Amphibians
J. WHITFIELD GIBBONS, DAVID E. SCOTT, T R AVIS J. RYA N , KURT A.
B U H L M A N N , T R ACEY D. TUBERV I L L E , BRIAN S. METTS, JUDITH L. GREENE,
TONY MILLS, YALE LEIDEN, SEAN POPPY, AND CHRISTOPHER T. WINNE
A s a group [reptiles] are nei t h er ‘good ’n or ‘b ad ,’ butia re intere s ting and unu su a l , a l t h o u gh of m i n ori m port a n ce . If t h ey should all disappe a r, it wo u l d
not make mu ch differen ce one way or the other ”( Zim and
Smith 1953, p. 9 ) . Fortu n a tely, this op i n i on from the Golden
Gu i de Series does not persist tod ay; most people have com e
to recogn i ze the va lue of both reptiles and amph i bians as an
i n tegral part of n a tu ral eco s ys tems and as heralds of
envi ron m ental qu a l i ty (Gibbons and Stangel 1999). In
recent ye a rs , as overa ll envi ron m ental aw a reness among the
p u blic has incre a s ed , con cerns have come to inclu de intere s t
in the eco l ogical state of reptile and amph i bian spec i e s
t h em s elves and of t h eir habi t a t s . In c re a s ed aw a reness may
s tem from bet ter edu c a ti on abo ut threats to bi od ivers i ty in
gen era l , and to reptiles and amph i bians in parti c u l a r, a n d
po s s i bly even from an innate attracti on to these taxa
( Kell ert and Wi l s on 1993).
From the perspective of many nonscientists, the two
vertebrate classes comprising reptiles and amphibians,
collectively referred to as the herpetofauna, are inter-
changeable. For example,the Boy Scout merit badge pam-
phlet for herpetology was called simply Reptile Study from
1926 to 1993 (Conant 1972, Gibbons 1993), and major
zoos (e.g., National Zoo in Washington, DC; Zoo Atlanta;
and San Diego Zoo) use only the name “reptile” to refer to
the facility that houses both amphibians and reptiles.
Thus, public attitudes about the need for conservation of
reptiles are probably linked to concern about amphibian
declines and deformities (Alford and Richards 1999, John-
son et al. 1999, Sessions et al. 1999), which have been the
subject of numerous, well-documented scientific studies.
Because amphibians are distributed worldwide, but her-
petologists who document amphibian declines are not, it
is difficult to accurately assess what p ortion of amphibian
populations are experiencing significant declines or have
already disappeared. Furthermore, the means of deter-
mining a species’ conservation status is a rigorous and
time-intensive process, and therefore counts of “officially”
recognized endangered and threatened species are likely to
grossly underestimate the actual number of imperiled
s pecies (Ta ble 1). The worl dwi de amph i bian decl i n e
prob l em , as it has come to be known, has garne red sig-
nificant attention not only among scientists but also in the
popular media and in political circles.
The reptile probl em
Despite the fact that reptiles and amphibians are ...
Is homo sapiens a key species in an ecological system?Ernst Satvanyi
About the role of the species Homo Sapiens in environment. The postulate of human ecology can help us to better understand the connections between Homo Sapiens as a key species and its natural environment in order to ensure the sustainability of ecological systems.
Operation “Blue Star” is the only event in the history of Independent India where the state went into war with its own people. Even after about 40 years it is not clear if it was culmination of states anger over people of the region, a political game of power or start of dictatorial chapter in the democratic setup.
The people of Punjab felt alienated from main stream due to denial of their just demands during a long democratic struggle since independence. As it happen all over the word, it led to militant struggle with great loss of lives of military, police and civilian personnel. Killing of Indira Gandhi and massacre of innocent Sikhs in Delhi and other India cities was also associated with this movement.
Read| The latest issue of The Challenger is here! We are thrilled to announce that our school paper has qualified for the NATIONAL SCHOOLS PRESS CONFERENCE (NSPC) 2024. Thank you for your unwavering support and trust. Dive into the stories that made us stand out!
Macroeconomics- Movie Location
This will be used as part of your Personal Professional Portfolio once graded.
Objective:
Prepare a presentation or a paper using research, basic comparative analysis, data organization and application of economic information. You will make an informed assessment of an economic climate outside of the United States to accomplish an entertainment industry objective.
Welcome to TechSoup New Member Orientation and Q&A (May 2024).pdfTechSoup
In this webinar you will learn how your organization can access TechSoup's wide variety of product discount and donation programs. From hardware to software, we'll give you a tour of the tools available to help your nonprofit with productivity, collaboration, financial management, donor tracking, security, and more.
Biological screening of herbal drugs: Introduction and Need for
Phyto-Pharmacological Screening, New Strategies for evaluating
Natural Products, In vitro evaluation techniques for Antioxidants, Antimicrobial and Anticancer drugs. In vivo evaluation techniques
for Anti-inflammatory, Antiulcer, Anticancer, Wound healing, Antidiabetic, Hepatoprotective, Cardio protective, Diuretics and
Antifertility, Toxicity studies as per OECD guidelines
The Roman Empire A Historical Colossus.pdfkaushalkr1407
The Roman Empire, a vast and enduring power, stands as one of history's most remarkable civilizations, leaving an indelible imprint on the world. It emerged from the Roman Republic, transitioning into an imperial powerhouse under the leadership of Augustus Caesar in 27 BCE. This transformation marked the beginning of an era defined by unprecedented territorial expansion, architectural marvels, and profound cultural influence.
The empire's roots lie in the city of Rome, founded, according to legend, by Romulus in 753 BCE. Over centuries, Rome evolved from a small settlement to a formidable republic, characterized by a complex political system with elected officials and checks on power. However, internal strife, class conflicts, and military ambitions paved the way for the end of the Republic. Julius Caesar’s dictatorship and subsequent assassination in 44 BCE created a power vacuum, leading to a civil war. Octavian, later Augustus, emerged victorious, heralding the Roman Empire’s birth.
Under Augustus, the empire experienced the Pax Romana, a 200-year period of relative peace and stability. Augustus reformed the military, established efficient administrative systems, and initiated grand construction projects. The empire's borders expanded, encompassing territories from Britain to Egypt and from Spain to the Euphrates. Roman legions, renowned for their discipline and engineering prowess, secured and maintained these vast territories, building roads, fortifications, and cities that facilitated control and integration.
The Roman Empire’s society was hierarchical, with a rigid class system. At the top were the patricians, wealthy elites who held significant political power. Below them were the plebeians, free citizens with limited political influence, and the vast numbers of slaves who formed the backbone of the economy. The family unit was central, governed by the paterfamilias, the male head who held absolute authority.
Culturally, the Romans were eclectic, absorbing and adapting elements from the civilizations they encountered, particularly the Greeks. Roman art, literature, and philosophy reflected this synthesis, creating a rich cultural tapestry. Latin, the Roman language, became the lingua franca of the Western world, influencing numerous modern languages.
Roman architecture and engineering achievements were monumental. They perfected the arch, vault, and dome, constructing enduring structures like the Colosseum, Pantheon, and aqueducts. These engineering marvels not only showcased Roman ingenuity but also served practical purposes, from public entertainment to water supply.
Model Attribute Check Company Auto PropertyCeline George
In Odoo, the multi-company feature allows you to manage multiple companies within a single Odoo database instance. Each company can have its own configurations while still sharing common resources such as products, customers, and suppliers.
The French Revolution, which began in 1789, was a period of radical social and political upheaval in France. It marked the decline of absolute monarchies, the rise of secular and democratic republics, and the eventual rise of Napoleon Bonaparte. This revolutionary period is crucial in understanding the transition from feudalism to modernity in Europe.
For more information, visit-www.vavaclasses.com
The French Revolution Class 9 Study Material pdf free download
Science aug-2005-cardillo-et-al
1. 7. E. L. Charnov, U. Skuladottir, Evol. Ecol. Res. 2, 1067
(2000).
8. A. Purvis, P. H. Harvey, J. Zool. 237, 259 (1995).
9. K. E. Jones, A. MacLarnon, Evol. Ecol. Res. 3, 465 (2001).
10. A. W. Gemmill, A. Skorping, A. F. Read, J. Evol. Biol.
12, 1148 (1999).
11. S. Morand, Funct. Ecol. 10, 210 (1996).
12. R. E. Willemsen, J. Zool. 248, 379 (1999).
13. R. E. Ricklefs, Condor 102, 9 (2000).
14. A. P. Moller, M. D. Jennions, Oecologia 132, 492 (2002).
15. M. Heino, V. Kaitala, J. Evol. Biol. 12, 423 (1999).
16. N. P. Lester, B. J. Shuter, P. A. Abrams, Proc. R. Soc.
London Ser. B 271, 1625 (2004).
17. K. Hawkes, Nature 428, 128 (2004).
18. E. P. Economo, A. J. Kerkhoff, B. J. Enquist, Ecol. Lett.
8, 353 (2005).
19. J. X. He, Ecology 82, 784 (2001).
20. J. Kozlowski, J. Weiner, Am. Nat. 149, 352 (1997).
21. M. Mangel, Evol. Ecol. 10, 249 (1996).
22. A. L. Jensen, Can. J. Fish. Aquat. Sci. 53, 820 (1996).
23. J. R. Beddington, G. P. Kirkwood, Philos. Trans. R. Soc.
London Ser. B 360, 163 (2005).
24. P. M. Buston, P. L. Munday, R. R. Warner, Nature 428,
783 (2004).
25. A. Gardner, D. J. Allsop, E. L. Charnov, S. A. West, Am.
Nat. 165, 551 (2005).
26. E. H. Williams, K. W. Shertzer, Can. J. Fish. Aquat. Sci.
60, 710 (2003).
27. J. Kozlowski, Proc. R. Soc. London Ser. B 263, 556 (1996).
28. E. L. Charnov, Nature 387, 393 (1997).
29. E. L. Charnov, T. F. Turner, K. O. Winemiller, Proc.
Natl. Acad. Sci. U.S.A. 98, 9460 (2001).
30. R. Cipriani, R. Collin, J. Evol. Biol. 10.1111/j.1420-9101.
2005.00949.x (2005).
31. J. Maynard Smith, Q. Rev. Biol. 68, 557 (1993).
32. D. B. Miles, Ecology 75, 2143 (1994).
33. G. B. West, J. H. Brown, Phys. Today 57, 36 (2004).
34. J. Clobert, T. Garland, R. Barbaut, J. Evol. Biol. 11,
329 (1998).
35. R. E. Willemsen, A. Hailey, J. Zool. 248, 379 (1999).
36. S.W. is funded by The Royal Society. We are grateful
to three anonymous referees, one of whom pointed
out the constraint on the M/b ratio referred to in the
text.
5 May 2005; accepted 4 July 2005
10.1126/science.1114488
Multiple Causes of High Extinction
Risk in Large Mammal Species
Marcel Cardillo,1,2
* Georgina M. Mace,2
Kate E. Jones,4
.
Jon Bielby,2
Olaf R. P. Bininda-Emonds,5
Wes Sechrest,4
-
C. David L. Orme,1
Andy Purvis1,3
Many large animal species have a high risk of extinction. This is usually thought
to result simply from the way that species traits associated with vulnerability,
such as low reproductive rates, scale with body size. In a broad-scale analysis of
extinction risk in mammals, we find two additional patterns in the size
selectivity of extinction risk. First, impacts of both intrinsic and environmental
factors increase sharply above a threshold body mass around 3 kilograms.
Second, whereas extinction risk in smaller species is driven by environmental
factors, in larger species it is driven by a combination of environmental factors
and intrinsic traits. Thus, the disadvantages of large size are greater than
generally recognized, and future loss of large mammal biodiversity could be far
more rapid than expected.
A major challenge for conservation biology is
to explain why some species are more likely to
be threatened with extinction than others (1).
One of the traits associated most often with
high extinction risk among animal species is
large body size (2). In mammals, for example,
declining species considered threatened with
extinction are an order of magnitude heavier
(1374 T 1.43 g), on average, than nonthreat-
ened species (139 T 1.13 g) (3). Futhermore,
the size selectivity of the current extinction
crisis echoes past extinction events such as that
of the late Pleistocene, which dispropor-
tionately affected larger species (4, 5). How-
ever, it is not clear which mechanisms are
primarily responsible for the association be-
tween body size and extinction risk (5–9), and
a thorough investigation requires large com-
parative data sets for sizable groups of species
spanning a wide range of body sizes. Here, we
investigate the association between size and
risk with the use of a data set including nearly
4000 species of nonmarine mammals, a group
spanning eight orders of magnitude in body
mass, from the 2-g least woolly bat to the
4000-kg African elephant.
We used multiple linear regression on phy-
logenetically independent contrasts (10) to test
associations between extinction risk and a
range of predictor variables. As our measure
of extinction risk, we followed previous studies
in the use of classifications based on criterion
A of the IUCN Red List (3), converted to a
numerical index from 0 to 5 (11–13). This
corresponds to a coarse but quantitative mea-
sure of the rate of recent and ongoing decline
and excludes those threatened species listed
simply on the basis of small geographic distri-
bution or population size (3). Potential pre-
dictors of extinction risk can be grouped into
three broad types: (i) environmental factors,
where the size and location of a species_
geographic range determines the environmen-
tal features and human impact to which it is
exposed; (ii) species_ ecological traits, such as
population density; and (iii) species_ life-
history traits, such as gestation length. To
represent each of these types, we selected six
key predictors Egeographic range size, human
population density, an index of external threat
level, population density, gestation length, and
weaning age; see (10) for justification^.
Extinction risk shows a positive association
with adult body mass Et 0 3.86, degrees of
freedom (d.f.) 0 1530, P 0 0.0001, controlling
for geographic range size^. In separate regres-
sion models, each key predictor except wean-
ing age is also significantly associated with
extinction risk (Table 1). When a term de-
scribing the interaction between body mass
and the key predictor is added to each model, a
significant interaction is found in every case
except in the model for geographic range size
(Table 1). In every model, the sign of the
interaction term indicates that the slope of
extinction risk against the key predictor
becomes steeper with increasing body mass.
The effects of risk-promoting factors on ex-
tinction risk, therefore, become stronger as
body mass increases.
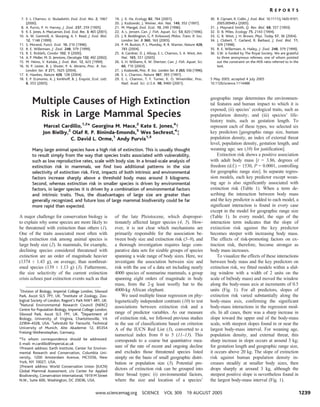
To visualize the effects of these interactions
between body mass and the key predictors on
extinction risk, we fitted models within a slid-
ing window with a width of 2 units on the
scale of ln(body mass) and moved the window
along the body-mass axis at increments of 0.5
units (Fig. 1). For all predictors, slopes of
extinction risk varied substantially along the
body-mass axis, confirming the significant
body-mass interactions in the regression mod-
els. In all cases, there was a sharp increase in
slope toward the upper end of the body-mass
scale, with steepest slopes found in or near the
largest body-mass interval. For weaning age,
population density, and external threat, this
sharp increase in slope occurs at around 3 kg;
for gestation length and geographic range size,
it occurs above 20 kg. The slope of extinction
risk against human population density in-
creases steadily at smaller body sizes, then
drops sharply at around 3 kg, although the
steepest positive slope is nevertheless found in
the largest body-mass interval (Fig. 1).
1
Division of Biology, Imperial College London, Silwood
Park, Ascot SL5 7PY, UK. 2
Institute of Zoology, Zoo-
logical Society of London, Regent’s Park NW1 4RY, UK.
3
Natural Environmental Research Council (NERC)
Centre for Population Biology, Imperial College London,
Silwood Park, Ascot SL5 7PY, UK. 4
Department of
Biology, University of Virginia, Charlottesville, VA
22904–4328, USA. 5
Lehrstuhl fu¨r Tierzucht, Technical
University of Munich, Alte Akademie 12, 85354
Freising-Weihenstephan, Germany.
*To whom correspondence should be addressed.
E-mail: m.cardillo@imperial.ac.uk
.Present address: Earth Institute, Center for Environ-
mental Research and Conservation, Columbia Uni-
versity, 1200 Amsterdam Avenue, MC5556, New
York, NY 10027, USA.
-Present address: World Conservation Union (IUCN)
Global Mammal Assessment, c/o Center for Applied
Biodiversity, Conservation International, 1919 M Street
N.W., Suite 600, Washington, DC 20036, USA.
R E P O R T S
www.sciencemag.org SCIENCE VOL 309 19 AUGUST 2005 1239
2. Dividing mammal species into small-bodied
and large-bodied subgroups at a cutoff of 3 kg,
we used multiple regression with model sim-
plification to find the sets of predictors, se-
lected from a wide range of variables (table
S1), that independently contribute to extinction
risk in each subgroup (Table 2). For species
smaller than the cutoff body mass, the min-
imum adequate regression model includes no
intrinsic biological traits, only environmental
factors determined by the size and the location
of species_ geographic ranges (size and median
latitude of geographic range and human
population density and external threat level
within the geographic range). For species
larger than the cutoff body mass, intrinsic
biological traits (population density, neonatal
mass, and litters per year), in addition to envi-
ronmental factors, are independent, significant
predictors of extinction risk. This basic result
is robust to bracketing the small-large cutoff
below and above 3 kg; the sets of significant
predictors vary only slightly in each case (10).
Large size has often been linked to elevated
extinction risk in mammals because larger
species tend to exist at lower average popula-
tion densities (14), the intrinsic rate of popu-
lation increase declines with body mass (15),
and larger species are disproportionately ex-
ploited by humans (16, 17). However, our
models reveal further complexity in the as-
sociation between size and extinction risk and
provide a compelling explanation for the strong
size selectivity of the current extinction crisis
that goes beyond a simple scaling of risk-
promoting factors with body size. Intrinsic
factors predict extinction risk only in species
weighing more than 3 kg; above this size, sus-
ceptibility to both intrinsic and external threats
increases sharply. This may represent the
approximate body mass above which extinction
risk begins to be compounded by the cumula-
tive effects of multiple threatening factors. For
example, forest fragmentation elevates the sen-
sitivity to hunting pressure of populations of
medium- and large-sized vertebrates (18), and
larger body sizes demand larger home ranges,
bringing individuals into increasing contact with
people in fragmented habitats (19). Above cer-
tain critical body sizes, species become targets
for increased hunting pressure: in neotropical
forests, subsistence hunter preference increases
abruptly for mammal species above about
6.5 kg (16). Those species with low population
densities or slow life histories, which tend to
be of larger size, are the most vulnerable to
population declines caused by hunting (17).
The reason for the sharp dip in the slope of
extinction risk against human population den-
sity around the same body mass that the slopes
of other predictors increase is less intuitive. It
could represent the effects of an extinction
filter, whereby the most susceptible species
have long since disappeared from regions of
highest human population density, leaving
behind a fauna consisting of species more
robust to extinction (20). This scenario is sup-
ported by evidence for widespread disappear-
ance of mammal populations from regions of
high human population density (21).
Our results also suggest that, as human
impacts on natural environments continue to
increase, declines toward extinction will be
more rapid, on average, in large species com-
pared with small species with similar biolog-
ical characteristics or that are exposed to
similar amounts of human impact. This can be
illustrated with the use of our model predicting
extinction risk from the level of external threat
(Table 1 and table S2). We predicted extinction
risk for two hypothetical species that vary in
body mass but are identical in other respects
(we assigned both species the median values
for all mammals of geographic range size and
degree of exposure to external threat). From
this model we obtained a predicted extinction
risk index value of 1.00 for a species of 300 kg
compared with only 0.38 for a species of
300 g. The difference in predicted risk stems
solely from the difference in body size and the
interaction between body size and external
threat. This, together with the interactions be-
tween other risk-promoting factors and body
Table 1. Separate regressions of key predictors against extinction risk. Each test includes geographic range
size as a covariate; tests for weaning age, gestation length, and population density also include adult body
mass as a covariate. For clarity, only results for key predictors and interaction terms are shown here;
quadratic and cubic terms are shown where significant. Full model results are in table S2. HPD, mean human
population density; ETI, external threat index (10). Dagger indicates P e 0.1; single asterisk, P e 0.05; double
asterisks, P e 0.01; triple asterisks, P e 0.001. Blank entries indicate terms that were not measured or not
significant in a particular model.
Predictors
Predictors tested without
body-mass interaction
Predictors tested with
body-mass interaction
d.f. slope t d.f. slope t
Weaning age 674 0.034 0.5 673 –0.344 –2.87**
Weaning age:body mass 0.074 3.8***
Gestation length 748 –5.754 –3.34*** 747 –1.447 –2.96**
(Gestation length)2 0.666 3.5***
Gestation length:body mass 0.183 4.19***
Population density 570 –0.058 –3.35*** 569 0.064 1.73.
Population density:body mass –0.015 –3.73***
Geographic range size 1625 0.311 1.61 1623 0.305 1.52
(Geographic range size)2 –0.043 –2.47* –0.042 –2.36*
(Geographic range size)3 0.001 2.37* 0.001 2.26*
Geographic range size:body mass 0.0004 0.12
HPD 1595 –0.154 –2.95** 1594 –0.075 –0.63
HPD2 0.024 3.14** –0.053 –1.34
HPD3 0.008 2.06*
HPD:body mass 0.018 3.51***
ETI 1592 –0.562 –1.32 1589 –5.783 –4.45***
ETI2 1.02 3.6*** 6.256 3.48***
ETI3 –1.941 –2.71**
ETI:body mass 0.366 5.73***
Table 2. Minimum adequate regression models of extinction risk. Results shown are models where each
predictor is significant at P e 0.05 after model simplification (10). Dagger, P e 0.1; single asterisk, P e 0.05;
double asterisks, P e 0.01; triple asterisks, P e 0.001. Blank entries indicate terms that were not measured or
not significant in a particular model.
Predictors
Small species (G3 kg)
(d.f. 0 1207)
Large species (Q3 kg)
(d.f. 0 131)
All species
(d.f. 0 404)
slope t slope t slope t
Geographic range size –0.142 –14.03*** –0.165 –3.9*** –0.516 –2.52*
(Geographic range size)2 0.016 2.13*
Latitude 0.01 5.49***
HPD –0.084 –2.1* 1.65 5.36***
HPD2 0.03 3.48*** –0.081 –3.81***
ETI 0.629 3.71*** 1.82 2.99**
Weaning age 0.3 3.46***
Neonatal mass 0.401 2.09*
Litters per year –0.618 –2.04*
Population density –0.111 –0.27** –0.148 –0.45***
(Population density)2 0.013 2.91**
Geographic range size:HPD –0.087 –4.62***
Geographic range
size:population density
–0.045 –3.03**
R E P O R T S
19 AUGUST 2005 VOL 309 SCIENCE www.sciencemag.org1240
3. size, suggests that the ongoing loss of the
world_s large mammal biodiversity could be
far more rapid than currently predicted Efor
example, by extrapolating from current extinc-
tion risk levels (22, 23)^. The likelihood of this
loss being highly selective and clustered in
large-bodied groups, such as ungulates and
primates, means the concomitant loss of mam-
malian evolutionary history and ecological
diversity could also be greater and more rapid
than currently expected (24, 25).
A recurring question in the study of ex-
tinctions, both recent and prehistoric, has been
whether species that have declined or gone
extinct have been the victims of bad genes or
simply bad luck (26, 27). Our results suggest
the answer to this question may be different for
small and large mammals. Smaller species are
more likely to become threatened simply
through environmental disadvantage: that is,
the size and location of their geographic ranges
and the levels of human impact to which they
are exposed. For larger species, intrinsic
biological traits become a significant determi-
nant of extinction risk in addition to environ-
mental factors: Large species are thus more
likely to be evolutionarily predisposed to
decline. One implication this has for conserva-
tion is that it provides a possible means of
reconciling opposing views over whether area-
based or species-based approaches to conser-
vation are most effective (28). Smaller species
should, in general, benefit more from the
conservation of important threatened areas,
whereas larger species will tend to benefit
most from a conservation approach that also
singles out individual species for particular
attention. We do not suggest that detailed eco-
logical studies of small mammal species are
unimportant; in conservation planning, there is
no substitute for a thorough knowledge of each
species_ unique circumstances. However, analy-
ses of global patterns of extinction risk from
large-scale comparative studies such as ours
can lead to a better general understanding of
the underlying causes of decline and, impor-
tantly, of the selectivity of decline among dif-
ferent species. This may help to identify those
species likely to be most susceptible to future
decline, providing the basis for a more pre-
emptive approach to conservation planning.
References and Notes
1. M. L. McKinney, Annu. Rev. Ecol. Syst. 28, 495 (1997).
2. D. O. Fisher, I. P. F. Owens, Trends Ecol. Evol. 19, 391
(2004).
3. IUCN, 2003 IUCN Red List of Threatened Species
(IUCN, Gland, Switzerland, 2003).
4. P. S. Martin, in Pleistocene Extinctions: The Search for a
Cause, P. S. Martin, H. E. Wright, Eds. (Yale Univ. Press,
New Haven, CT, 1967), pp. 75–120.
5. C. N. Johnson, Proc. R. Soc. Lond. Ser. B 269, 2221 (2002).
6. M. Cardillo, L. Bromham, Conserv. Biol. 15, 1435 (2001).
7. J. H. Lawton, in Extinction Rates, J. H. Lawton, R. M. May,
Eds. (Oxford Univ. Press, Oxford, 1995), pp. 147–163.
8. S. L. Pimm, The Balance of Nature? (Univ. of Chicago
Press, Chicago, 1991).
9. S. L. Pimm, H. L. Jones, J. Diamond, Am. Nat. 132,
757 (1988).
10. Materials and methods are available as supporting
material on Science Online.
11. M. Cardillo et al., PLoS Biol. 2, 909 (2004).
12. K. E. Jones, A. Purvis, J. L. Gittleman, Am. Nat. 161,
601 (2003).
13. A. Purvis, J. L. Gittleman, G. Cowlishaw, G. M. Mace,
Proc. R. Soc. Lond. Ser. B 267, 1947 (2000).
14. J. Damuth, Nature 290, 699 (1981).
15. T. Fenschel, Oecologia 14, 317 (1974).
16. A. Jerozolimski, C. A. Peres, Biol. Conserv. 111, 415 (2003).
17. R. E. Bodmer, J. F. Eisenberg, K. H. Redford, Conserv.
Biol. 11, 460 (1997).
18. C. A. Peres, Conserv. Biol. 15, 1490 (2001).
19. R. Woodroffe, J. R. Ginsberg, Science 280, 2126 (1998).
20. A. Balmford, Trends Ecol. Evol. 11, 193 (1996).
21. G. Ceballos, P. R. Ehrlich, Science 296, 904 (2002).
22. M. L. McKinney, Anim. Conserv. 1, 159 (1998).
23. G. J. Russell, T. M. Brooks, M. L. McKinney, C. G.
Anderson, Conserv. Biol. 12, 1365 (1998).
24. J. Jernvall, P. C. Wright, Proc. Natl. Acad. Sci. U.S.A.
95, 11279 (1998).
25. A. Purvis, P.-M. Agapow, J. L. Gittleman, G. M. Mace,
Science 288, 328 (2000).
26. D. M. Raup, Extinction: Bad Genes or Bad Luck?
(Oxford Univ. Press, Oxford, 1993).
27. P. M. Bennett, I. P. F. Owens, Proc. R. Soc. Lond. Ser.
B Biol. Sci. 264, 401 (1997).
28. G. M. Mace, J. L. Gittleman, A. Purvis, Science 300,
1707 (2003).
29. We thank S. Adamowicz, L. Bromham, B. Collen, T.
Coulson, J. Gittleman, C. Godfray, M. Hassell, E. J.
Milner-Gulland, and I. Owens for comments and
discussions and R. Beck, E. Boakes, C. Carbone, T.
Clary, C. Connolly, M. Cutts, J. Davies, J. Foster, R.
Grenyer, M. Habib, V. Kanchaite, R. Liu, M. Miyamoto, J.
O’Dell, C. Plaster, S. Price, E. Rigby, J. Rist, M. Tambutti,
A. Teacher, and R. Vos for contributing to the con-
struction of the databases. This work was funded by
grants from NERC (U.K.) to G.M.M. and A.P. (NER/A/S/
2001/00581 and NE/B503492/1), from NSF to J.L.G.
(DEB/0129009), from Bundesministerium fu¨r Bildung
und Forschung (Germany) to O.R.P.B. (031U212E), and
by an Earth Institute Fellowship to K.J.
Supporting Online Material
www.sciencemag.org/cgi/content/full/1116030/DC1
Materials and Methods
Figs. S1 to S3
Tables S1 to S3
References and Notes
13 June 2005; accepted 8 July 2005
Published online 25 July 2005;
10.1126/science.1116030
Include this information when citing this paper.
A B
C D
E F
weaning age
population density
external threat index human population density
geographic range size
gestation length
Lower bound of body mass interval (kg)
Slopeofpredictoragainstextinctionrisk
Fig. 1. (A to F) Slopes of key predictors against extinction risk at different body masses. Each point
is located at the lower bound of a body-mass interval of width 2ln(g). Triangles indicate slopes
significantly greater or less than zero (P e 0.05); circles, slopes not significantly different from zero.
Lines are Lowess smoothers fitted through the points with span of 0.3. Solid squares indicate
slopes (T1 SE) of the predictor against extinction risk for small (G3 kg) and large (Q3 kg) species,
respectively. Dashed horizontal lines indicate slopes of zero. Note that the y axes in (C) and (D)
have been inverted to improve the visual clarity of the pattern.
R E P O R T S
www.sciencemag.org SCIENCE VOL 309 19 AUGUST 2005 1241